ISSN 0024-9521
IJG Vol. 45, No.1, June 2013 (38 - 47) © 2013 Faculty of Geography UGM and The Indonesian Geographers Association
THE ROLE OF URBAN AREA AS THE DETERMINANT FACTOR OF
POPULATION GROWTH
Sri Rum Giyarsih
Faculty of Geography, Gadjah Mada University
Muhammad Arif Fahrudin Alfana
[email protected] Faculty of Geography, Gadjah Mada University
ABSTRACT
This research aims to (1) find the determinants for the increase of population growth rate and (2) understand the role of urban area as the pulling factor for the migrant. This research held in Yogyakarta Special Region since the population growth has increasing during 2000-2010. Secondary data from the Bureau of Statistic (BPS) were used for the main analysis. Data processing and analysis were performed by using descriptive-quantitative method.The result of this research indicates that population growth rate in Yogyakarta Special Region is affected by the increase of immigration from the other provinces. This migration is referred to the recent migration, in which people entering this province as motivated by educational, family, sense of security, tourism, and job seeking background. This research also reveals that Yogyakarta City and Sleman Regency becomes the center for pulling the migrant. This is especially due to its function as the base for economy, educational city, area with stable security, and low cost of living.
Keywords: population growth, urban area, determinant factor
ABSTRAK
Penelitian ini bertujuan untuk (1) menemukan faktor penentu bagi peningkatan laju pertumbuhan penduduk dan (2) memahami peran daerah perkotaan sebagai faktor menarik untuk migran. Penelitian ini dilakukan di Daerah Istimewa Yogyakarta dengan pertimbangan semakin meningkatnya pertumbuhan penduduk selama 2000-2010. Data sekunder dari Biro Statistik (BPS) digunakan sebagai dasar analisis utama. Pengolahan dan analisis data dilakukan dengan menggunakan deskriptif-kuantitatif. Hasil penelitian ini menunjukkan bahwa laju pertumbuhan penduduk di Daerah Istimewa Yogyakarta dipengaruhi oleh peningkatan migrasi masuk dari provinsi lain. Migrasi yang dimaksud adalah migrasi risen yang masuk menuju provinsi ini yang dilatarbelakangi oleh motif pendidikan, ikut suami/istri, rasa aman, wisata, dan mencari pekerjaan. Penelitian ini juga mengungkapkan bahwa Kota Yogyakarta dan Kabupaten Sleman menjadi pusat penarik migran. Hal ini dikarenakan fungsi keduanya sebagai basis perekonomian, kota pendidikan, daerah dengan keamanan yang stabil, dan biaya hidup yang terjangkau.
Indonesian Journal of Geography, Vol 45, No.1, June 2013 : 38 - 47
INTRODUCTION
In the scope of national development, population growth plays an aimprotant role in the producing social, economic, and population related problems. Low population growth therefore becomes expected target that must be fullfiled by every nation. It can be postulated when the population quantity can be controlled, the quality can be improved. High population growth at present becomes source of various population problems, such as hunger, unemployment, conflict, etc. In this case, population control is required to prevent the increase of population growth as well as to achieve zero population growth. Therefore, by zero population growth, ideal condition which population considered stable, without increasing or decreasing, can be achieved.
Generally spoken, population structure is influenced by the growth of population. The population growth and structure in developing countries, including Indonesia, changed drastically due to the utilization of advanced medical-pharmacheutical technology, including the findings of antibiotics. This condition has revealed to reduce the number of death/mortality drastically. In the other hand, the decrease of natality becomes lower than mortality. The decrease of natality is highly influenced by socio-cultural conditions, for example by using contraception. Advancement in transportation and communication also give influence to the movement of the population, incuding permanent migration and recent migration (i.e. circulation migration and commuting) In addition to mortality and natality, the influence of migration also becomes factor that cannot be simply neglected [Rogerson 1994, in Tukiran 2010).
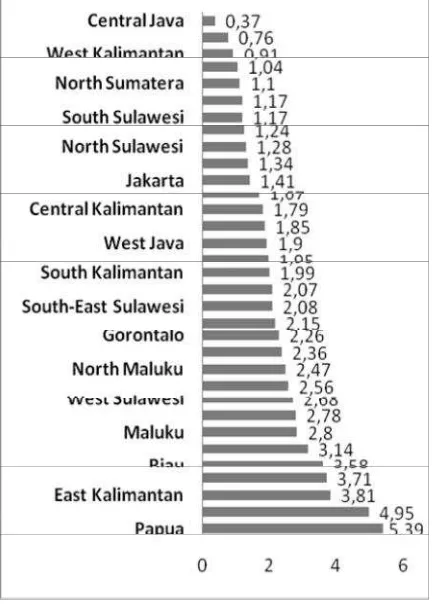
Compared to the other provinces in Indonesia, population growth in Yogyakarta Special Region generally has low rates. Since 1971-1980, the growth rate was 1.1% and became one of the lowest rates in the national level. The population growth also became lower in 1980-1990 with the rate of 0.57%. Meanwhile, the population growth rate was increasing in 1990-2000, was higher compared to several other provinces, such as Moluccas, Jakarta, and West Sumatra (Bureau of Statistics-BPS 2010).
The result of Indonesian population cencus in 2010 has revealed the increasing growth of 1.04% (Figure 1). Although the population growth rate is still considered as low in the national level, the increase from the previous decade becomes interesting phenomena for further analyzed. The fertility, mortality, and migration therefore become determinant in this phenomena, as the main source of the changes of the population structure.
This research is aimed to find the determinant factors for the increase of population growth and to understand the role of urban area as the pulling factor for the migrant in Yogyakarta Special Region. Theoritical and practical-empirical advantages from this research are also expected from this research. From the theoritical benefit, this research is expected to bring enrichment to the previous research in urban geography studies, especially related to role of urban area as determinant of the increase of population growth rate. From the practical-empirical benefit, this research provides fundamental aspect in building up theoretical framework and construction of regulation related to the spatial development, especially in the topics of urban area and its population.
THE ROLE OF URBAN Sri Rum Giyarsih, Muhammad Arif Fahrudin Alfana
Figure 1. Population growth rate in Indonesian Provinces. Source: BPS 2010
Population growth, as the changes of the increasing or decreasing number of population, is affected by various factors. War, diseases, hunger, and natural disaster are well known to be the source of decrease of the population. In contrast, increasing of the population is mainly affected by stable political-economical condition, increase of human health, and increasing food security.
Several source have been identified to play a role in population growth, which including natality, mortality, and migration. Natality and mortality are categorized as the natural factors to the population growth. In contrast, migration, which can be in-migration and out-migration, comes from the non-natural factor. In the dynamic process of population growth, the increasing population is mainly caused by natality and in-migration. Meanwhile decreasing population is mainly caused by mortality and out migration [Mantra, 2003] .
Natality, as the source of incrasing population, is affected by its resistance factor (anti-natality) and support factor (pro-natality). Pro-natality, as the support factor, is therefore causing higher population. Factors contributing to pro-natality are including young-age marriage, the thinking way in which the child can provide family worker and also give fortune to the family, and the pride for having the male child, in which the parent is countinously getting born until they got male child.
Journal of Geography, Vol 45, No.1, June 2013 : 38 - 47
In addition to natality, population dynamic is also influenced by mortality. Mortality, as permanent loss of human life signs, will reduce the number of population. Mortality is influenced by the pro-mortality factors and anti-mortality factors. Pro-mortality factors are including: 1) inadequate health facilities, 2) low awareness of the community realted to health, 3) natural disasters, 4) war, 5) traffic and industrial accident, 6) assasiantion and suice. This condition tends to increase the mortality, while anti-mortality tends to reduce the mortality. These factors are including: 1) healthly environment, 2) adequate health facilities, 3) religion, which forbid suicide and murder, 4) high level of public health, and 5) high level of education.
In addition to the natality and mortality, the decrease or increase of population is also affected by the population mobility. According to Mantra, [2003], the habit in population mobility is rather different compared to natality and mortality. While natality and mortality are remain stable, in which the case of Yogyakarta is about 24.1 and 7.8 for each 1000 people in 1993 and did not change until 1995, the population mobility is not stable.
The concept of mobility has boarder range compared to migration, in which mobility covers the permanent and recent migration. Migration is mainly generated by environmental condition, such as limited land resources that cannot support the living of local population. Therefore, the migrant will also consider the stock of natural resources, socio-cultural condition, economic potential, and technological use. Mantra 2003) stated that the excessive migration in the nation is generated by fast
population growth that supported by decrease of the mortality and also the bias government regulation in urban area. Higher migration towards the urban area generates imbalance on the population distribution, which therefore triggers concentration of urban population. Higher density of urban population is caused by pulling factors, in which rural population are doing migration to the urban area.
Push factors in the rural area also become the source for migration. Those factors are including: (1) the decrease of natural resources (i.e. the decrease of environment carrying capacity and the decrease of demands for certain goods, in which the raw materials, such as mining materials, lumbers, or materials from agriculture become difficult to obtain), (2) decrease of job opportunities in previous area (such as due to the decrease of agricultural lands), (3) pressure from political, religion, or ethnic group, in which disturb the human rights in former area (4) educational, employment, and marriage reason, and (5) natural hazards, such as flood, fire, earthquake, tsunami, drought or disease outbreak. Pull factors for the migration are including the expectations on improving standard of living, opportunity to gain better education quality, good environmental condition and pleasant living, and abundance of activities in urban area (i.e. entertainment venues and center for cultural activities)
THE METHODS
THE ROLE OF URBAN Sri Rum Giyarsih, Muhammad Arif Fahrudin Alfana
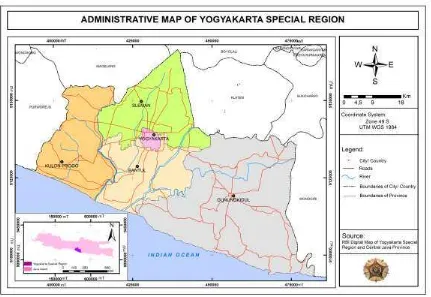
Figure 2. Administrative Map of Yogyakarta Special Region
RESULT AND DISSCUSSION
Number and growth of the population
As observed from the result of population census since 1971 to 2010, the number of population in Yogyakarta Special Region was continuously increasing. In 1971, the population was about 2.5 million inhabitants, while in 1980 became 2.8 million inhabitants. The population became 2.9 million inhabitants in 1990. While in 2000 and 2010, the population was increasing to 3.1 million and 2.46 million inhabitants.
The increasing population in Yogyakarta Special Region indicates the fluctiative change of the population itself. In the specific time interval, the population growth rate is increasing, while in other time is decreasing. In 1971-2000, the average population growth rate was 1.10 percent per year. While in 1980´1990, the population growth rate was decreasing to
increasing again to 0.72 percent per year in 1990-2000, while in 2000-2010, the population growth rate became 1.04 percent per year. This increase is mainly affected by in-migration to the area.
Indonesian Journal of Geography, Vol 45, No.1, June 2013 : 38 - 47
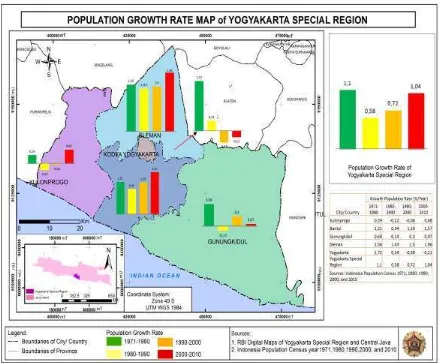
Figure 3. Population growth rate based in Yogyakarta Special Region
In the period of 1990-2000, the population growth rate varied in each municipality/regency. Only Yogyakarta Municipality experienced decrease of population growth rate, while four other regency experienced increase of population growth rate. Highest population growth rate occurred in Sleman Regency (1.50 percent per year), while the lowest occurred in Yogyakarta Municipality (-0.39 percent per year). Population growth rate in Kulon Progo Regency remain low compared to other regency, although only -0.04 percent per year. This condition is very contrast with Gunung Kidul Regency, in which the growth was increasing to 0.30 percent per year. The increase of population growth in Gunung Kidul Regency was generated by economic crysis in this period, in which affected the economic condition of the inhabitants, including the Gunung Kidul inhabitants
which maily becomes migrants to other areas as as traders, servants or work in the industry. Most of them became the victims of the layoff due to slack of economy in industrial sector, while another came back to this regency due to lack of adaptation in the destionation area.
Fertility
Fertility, as one of demographic variable, affects the population profile of an area. Fertility will provide positive contribution to the population growth. Therefore, it can be assumed that the higher the fertility of an area, the higher the population growth. Based on the increase of the population growth in Yogyakarta Special Region, it can be assumed that fertility value will be also increasing.
THE ROLE OF URBAN Sri Rum Giyarsih, Muhammad Arif Fahrudin Alfana
the indicator. With the increase of the population, the TFR value also will be
increase because of its positive correlation in nature. Based on the population census (SP) and inter-census population survey
(SUPAS), as combined with several TFR
calculations using specific method, the
TFR value in this area is considered has
low value. Population census revealed that the significant decrease of TFR from
1971-2010 was occurred. The value of TFR in major source of the increasing TFR in this
province. Nevertheless, as mentioned by
BPS, the TFR of Yogyakarta Special
Region is in the right track because of the low level that have been achieved, in which in this case leading to the end of demographic transition. This condition is caused by the higher age for the marriage, higher education, and higher socialization of the family planning program, which has been done well.
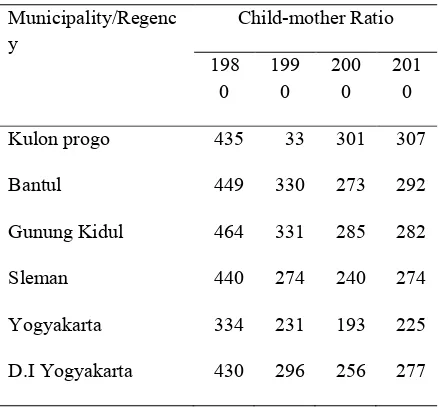
Another fertility indicator used is child-mother ratio, as it represents the comparison of the number of children below five years per 1000 women in reproductive age. Based on this ratio, it can be revealed that the number of infants in Yogyakarta has increased to 8.2% in 2010, compared to 2000. The increase of this ratio from 1980-2010 can be shown in Table 1.
Table 1. Child-mother ratio in Yogyakarta Special Region based on the
municipality/regency from 1980, 1990, population quantity. Although the scale is very coarse, it can be assumed that the lower mortality indicates the advancement of a region. Therefore, it can be postulated that advancement in health facility produces lower mortality. Several indicators used are Infant Mortality Rate (IMR), Child Mortality Rate (CMR), and
life expectancy index.
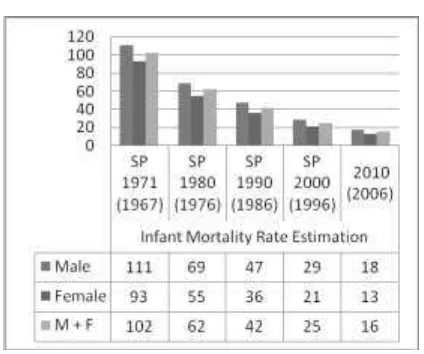
Infant mortality rate (IMR) is one of the
indicators in determining the degree of mortality in the region. Moreover it can also become indicator of the public health.
Indonesian Journal of Geography, Vol 45, No.1, June 2013 : 38 - 47
Migration factor as population growth determinant
Migration is one of demographic component which give influence to the population dynamic in addition to fertility and mortality. Migration that occurred in a region becomes the main factor for increasing and accumulation of population. Therefore it also gives an influence to the higher population growth. One of the indicators to calculate the migration is based on lifetime migration and recent migration.
Lifetime migration calculated based on the difference of the number of inhabitants in current place compared to the place of birth. Based on the population cencus in 2010, number of incoming migrant in Yogyakarta Special Region were 16.27 percent from the total amount of population. Sleman Regency had the highest incoming lifetime migrant with value of 45.73 % (375,923 inhabitants). Kulon Progo and Gunungkidul Regency had the lowest value of about 4-5 percent. Another indicator used in this research is recent migration value, in which calculated based on the comparation of the migration occurred in Sleman Regency with value of 48.1 % (146,454 inhabitants) from the total recent migration. This number was followed by Bantul Regency and Yogyakarta Municipality with the value of 22.6 % and 20.7 consecutively. Recent migration in Kulon Progo and Gunungkidul Regency remain lowest which consist of 3-5% from total migration.
Figure 4. Estimation diagram for Infant Mortality Rate in Yogyakarta Special Region 1971-2010. Source: Bureau of Statistics (BPS) 1980, 1990, 2000, 2010
Very high recent migration in Sleman Regency, Bantul Regency, and Yogyakarta Municipality are mainly caused by the growing of universities, which attract the growth of residential area adjacent to the education facilities. This condition is revealed based on the growth of population in the districts surrounding the educational institution in 2010, such as in the Districts of Banguntapan, Kasihan, and Nganglik [BPS, 2010].
The result of population census in 2000 has shown similar pattern in which education became the main reason for incoming recent migration in Yogyakarta Special Region. About 48.68% of the total recent migration mentioned that their main reason is for edication, while 23.71 percent were due to following husband/wife. The rest stated that their recent migration were due to safety, job opportunity, settlement, following their family, and etc.
THE ROLE OF URBAN Sri Rum Giyarsih, Muhammad Arif Fahrudin Alfana
group of 20-24 years was the higest, with value of 36.9%. Therefore, it can be clearly seen that most of them are high school or college student. From all of the recent migration, 84.83 % is unmarried, while the migrants got married or divorced is 14.3 % and 0.87 % consecutively. The result of population cencus in 2010 also explain that the last education of the recent migration in this region is dominated by high school student with value of 56.74 %.
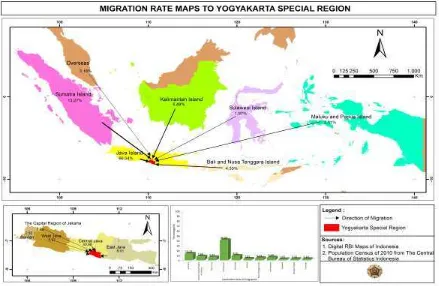
Based on the province of origin of the incoming migrant to Yogyakarta Special Region, it can be revealed that 40.68 % of them come from the Central Java Province. In addition to the Central Java, another province that contribute to the migrant is including South Sumatra (13.27 %), East Java (8.91 %), Jakarta (7.66 %), and West Java (5.97 %)
The availability of good education facility and quality become the pulling factor for the outsider to come to Yogyakarta Special Region. The flow of migration in this province is shown in Figure 5.
Role of Urban Area as Determinant Factor to the Increase of Population in Yogyakrta Special Province
role of urban area in the increase of pupulation growth in Yogyakarta Special Region is quite high. The urban area, according to Yunus, [2010], is an area
which has characteristic as a city in the term of physical, social, economy, and cultural. In this analysis, the urban area is including part of Yogyakarta Municipality, part of Bantul Regency, and part of Sleman Regency, which share a boundary with the municipality.
The role of urban area, such as Yogyakarta Municipality, part of Bantul Regency, and part of Sleman Regency in determining the increase of population is rather to bring the pulling factor to the migrant. As identified before, migration is the determinant factor for the increase of population in 2010 compared to 2000. The reason of the migration is including due to education, good infrastructure, and also savety and security.
CONCLUSION
The increase of population growth in Yogyakarta Special Region in 2010, when analyzed from its determinants, can be concluded to be originated from the migration factor, although the fertility and mortality also giving the influence. In this case, the migration is incoming recent migration to this province. Further analysis has revealed that the education motive became the major source of this migration. Yogyakarta Special Region, which well known as education city, therefore becomes pulling factor for the migrant from outside the province. In addition to this factor, other puling factors such as felling safety and security, following the family, tourism, and job opportunity, also giving its influence to the migration.
REFERENCES
Bureau of Statistics (BPS) Yogyakarta Special Region. (2010), Sensus Penduduk 2010. BPS Provinsi
Daerah IstimewaYogyakarta.
--- (2000). Sensus Penduduk 2000. BPS Provinsi Daerah
IstimewaYogyakarta.
---(1971), Sensus Penduduk 1971. BPS Provinsi Daerah
IstimewaYogyakarta.
---(1980), Sensus Penduduk 1980. BPS Provinsi Daerah
IstimewaYogyakarta.
---(1990), Sensus Penduduk 1990. BPS Provinsi Daerah
IstimewaYogyakarta.
---(2010), Profil Kependudukan SP 2010 Provinsi Daerah Istimewa Yogyakarta. BPS Provinsi
Yogyakarta.
Cameron, Noel. (2002), Growth Population and Development. New
York: academic press.
Mantra, Ida Bagoes. (2003), Demografi Umum. Yogyakarta: Pustaka
Pelajar.
Tukiran. (2010), Kependudukan. Jakarta:
Universitas Terbuka.
Yunus, Hadi Sabari. (2010), Megapolitan.
Yogyakarta: Pustaka Pelajar.