47 Gadjah Mada International Journal of Business
Vol. 17, No. 1 (January-April 2015): 47-64
* Corresponding author’s e-mail: soemarso_s.rahardjo@yahoo.com
Trading Behavior of Foreign Vis a Vis Local Investors
in The Indonesian Stock Market
Soemarso Slamet Rahardjo
Faculty of Economics at University of IndonesiaAbstract: This paper studies the behavior of foreign, local investors and total market in a stock trading. The analysis is focused on their implementation of positive feedback strategy, the existence of mean reverting process and their sensitivity toward expected capital gain and losses. The result reveals that both of these two investors apply the positive feedback strategy, at a different degree. The investment horizon of the foreign investors is shorter than the local investors. There is a mean reverting pattern in the price volatilities. The convergence period for local investor is 2.4. The market needs 1.8 month. No conver-gence period for foreign investors. The local investors and total market are neutral toward expected gain and losses. The foreign investors are more sensitive to capital loss. Previous price and volume changes have a leverage effect to the current demand of foreign investors. The local investors are affected by changes in price only.
Abstrak: Makalah ini meneliti perilaku investor asing dan lokal serta total pasar dalam perdagangan saham. Penelitian ditekankan pada implementasi strategi umpan balik positif, ada-tidaknya pola kembali ke rata-rata dan ada tidaknya perbedaan sensitivitas antara harapan keuntungan dan kerugian modal. Hasil studi menunjukkan bahwa ke dua investor sama-sama menerapkan strategi umpan balik positif dengan tingkat yang berbeda. Horizon investasi investor asing berjangka waktu pendek. Horison investor lokal berjangka waktu lebih panjang. Terdapat pola kembali ke rata-rata dalam volatilitas harga saham. Periode konvergensi untuk investor lokal adalah 2,4 bulan. Untuk total pasar 1,8 bulan. Tidak ada periode konvergensi untuk investor asing. Investor lokal dan total pasar netral terhadap harapan keuntungan atau kerugian modal. Investor asing, sebaliknya, lebih sensitif terhadap kerugian modal dibandingkan dengan keuntungan.
Keywords:capital market; demand for shares model; market crash; investment decision; investor’s behavior; shares pricing model; speculative
Introduction
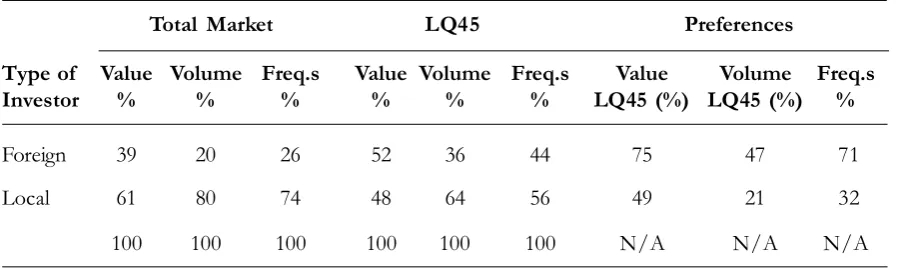
Foreign investors have a significant role in the Indonesian Stock Exchanges. During 2013, the foreign investors contributed 20 percent of the transaction volume (sell and buy) in the market. However, their value rep-resents 39 percent of the total stock trading. In the total market, the portion of foreign investor frequencies was only 26 percent com-pared to 74 percent for the local investors. In terms of preferences, the shares included in the LQ45 index were the most favorable in-vestment outlet for them. The value of trans-actions in LQ45 shares represents 75 percent of their total trading in the market. This num-ber becomes 47 percent if we view it from the stand point of volume and 71 percent of the frequencies. Within LQ45 trading, the portions of foreign investors, in the light of volume, value and frequencies, were 36 per-cent, 52 percent and 44 percent respectively. Table 1 shows this information about stock trading in the Indonesian Stock Exchanges during 2013.
Dichotomizing the foreign investor vis a vis the local one creates several interesting points to study. One of them is their trading behavior. Different trading behavior may lead the market in a different direction. In this
context, direction refers to a price fluctua-tion and the possibility of market crash. Price determination in stock trading is very com-plex. It is not solely affected by the intrinsic value as supported by the foundation theory (See Dodd’s 1934; and William 1938 in Malkiel 1990). This theory assumes that the market is efficient and the investors are ra-tional. The efficient market hypothesis, first introduced by Samuelson (1965) in Picerno (2010) and further developed by Fama (1970), stated that the efficiency of stock price de-pends on information available for decision making.
Keynes (1936) stated that, instead of estimating the intrinsic value, the professional investors tend to focus on the trend of the crowd’s behavior. This view has been sup-ported by the behavioral scientists (among others Shleifer 2000 and Shefrin 2002; also Malkiel 2010) who assume that a stock mar-ket is not efficient. The individual or mass psychological factors also influence the in-vestment decisions. These factors cause the stock price to deviate from the intrinsic value. The positive deviation of stock price against the intrinsic value is commonly de-fined as the price bubble (Tirole 1985). Shiller (1981, 2003 and 2008) in his study concluded that the stock market volatilities have been Table 1. Stock Trading in the Indonesian Stock Exchanges (2013)
Total Market LQ45 Preferences
Type of Value Volume Freq.s Value Volume Freq.s Value Volume Freq.s
Investor % % % % % % LQ45 (%) LQ45 (%) %
Foreign 39 20 26 52 36 44 75 47 71
Local 61 80 74 48 64 56 49 21 32
100 100 100 100 100 100 N/A N/A N/A
exceeded the growth of dividend during the period of 1871 to 2000. The market tends to goes up in an extreme direction and hence creates a speculative bubble from time to time. This process also applies for the reverse direction when prices start to decline. When the fundamental economics of the market can no longer support the bubble, then a boom-bust situation might happen (Tirole 1985). The sudden and significant decline of the stock price usually indicates such a boom-bust situation. This situation may also, popu-larly, be called market crash. It is in this con-text that a difference in trading behavior be-tween foreign vis a vis local investors may lead to the possibility of a stock market crash. Additionally, since the funding of for-eign investors is, basically, from abroad, the capital in-out flow due to their trading ac-tivities will affect the balance of payments in the monetary sector. Volatilities in the trad-ing activities of foreign investors in the capi-tal market may create a possibility of mon-etary crisis in the financial sector. Krugman (1979); Flood and Garber (1984); and Blanco and Garber (1986) in Agenor (2010) stated that a financial crisis might happen if foreign exchange reserves have been used up and the money supply has been fully absorbed for domestic credit. The transactions of foreign investors in the capital market affect the for-eign exchange reserves and money supply. Therefore their transactions may create risk in a capital market by contributing to a fi-nancial crisis, i.e. if the demand for foreign currency, when they intend to pull out, can-not be supplied by the reserves.
The decision to trade in a stock market is a process involving the investor’s attitude toward risk, their paradigm, method of analy-sis and information used. Shleifer and Sum-mers (1990) classify the investors into noise traders and the sophisticated ones.
Follow-ing Black (1986); and De Long et al. (1990a) in defining a noise trader as an investor whose decision to invest is based on a belief, which is misperceived, and based on non-fundamen-tal information about future prices or mar-kets.
Shleifer (2000) denoted that the belief, manifested by over/under reaction toward information they received, will be used as a basis for investment decisions and, therefore, will be implemented in the trading strategy. Noise traders use what De Long et al . (1990a) called positive feedback strategy in their stock trading. This strategy tends to extrapolate the past information received based on the para-digm of thinking they have. Following mar-ket trends is the most common method used by them. Such decision making processes cre-ate a new type of risk called sentiment based risk (Shleifer 2000) or noise trader risk (De Long et al . 1990a). In this paper, this will be considered as speculative risk.
The sophisticated investor, on the other hand, tries to maximize utility reflected in their consumption function at the end of the investment period. The investment decision will be based on the rational expectation of the return. They are supposed to act as an arbitrator during a significant price fluctua-tion, and hence reduce the volatilities of the market. Additionally, since the sophisticated investors act on a rational and optimization hypothesis, their trading strategy will lead to less volatile market.
investors. The role of each type of investor in determining the price will depend upon the size of their presence in the market.
The purpose of this paper is to study the trading behavior of foreign vis a vis local investors and their relationship with the to-tal market behavior in the Indonesian Stock Exchange. They could be either a noise trader or sophisticated investors. Analysis will be focused on the way they conduct the trading, especially on their implementation of posi-tive feedback strategy and the consequences of this behavior on the stock market price volatilities. Their responsiveness toward price changes will be examined, on the basis of differences of their attitude toward misperception risk, which indicates the dif-ferences in their trading behavior. Addition-ally, the existence of a mean reverting pat-tern in the market influenced by foreign vis a vis local investors, as well as total market, will also be investigated.
Knowledge of market as well as inves-tor behavior may be used to anticipate the price volatilities during the stock trading. The role of foreign vis a vis local investors in driv-ing the market could be analyzed. Further-more, since funding of the foreign investors may create a potential liability from the view point of the nation, that behavior may be used as a basis to analyze the possibility of a mar-ket crash in the capital marmar-ket and monetary crisis in the financial sector.
Theoretical Framework and
Hypothesis Development
Stock trading is activities where demand for stock meets its supply. In this paper, how-ever, the term trading is limited to transac-tions in the secondary market. The demand for a stock, represented by volume of
trans-actions (v), is derived from the investor’s util-ity function with the objective of maximiz-ing wealth. Utility function is a representa-tion of preferences. As in other goods and services, demand for shares is a function of its price, although, Aiyagari (1988) concludes that the demand for stock is not only deter-mined by the current, but also the future price as well. De Long et al . (1990b) study the effect of positive feedback strategy in the noise trader demand for stock. In his study, De Long et al . (1990b) classify the investors into three different categories with different demand patterns. Those are: (1) noise trader (also called positive feedback or speculative investors); (2) sophisticated or rational or real investor and; (3) passive investor.
A noise trader, based on his/her believe toward non fundamental information, drives price to increase. Their demand (Df) is an exponential function of price with the posi-tive feedback coefficient as the exponent. The latter reflects the implication of the positive feedback strategy. The noise trader’s decision, however, contains a misperception risk, which, in this study, will be viewed as part of the speculative element. The demand of the sophisticated investors (Dr), on the other hand, is the result of their utility maximiza-tion reflected in their consumpmaximiza-tion funcmaximiza-tion at the end of the investment period. The in-vestment decision will be based on the ratio-nal expectation of the return. The passive investors follow the market, therefore, their demand (De) represents the residual of those allocated to noise trader and sophisticated investors.
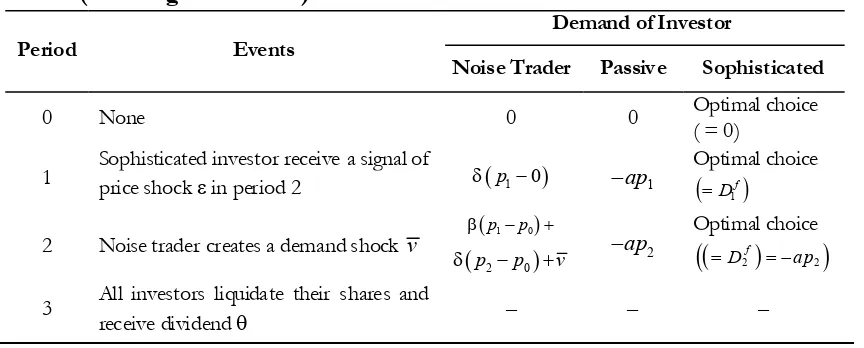
is equal to the fundamental value stated at zero (0). During period 1, information on price shock in period 2 was received by the sophis-ticated investor. The noise trader creates de-mand shock in period 2. In period 3, all in-vestors liquidate the shares, received a fixed dividend and the price is back to the funda-mental value. The existence of noise trader, sophisticated and passive investors are stated at 1, m and 1 – m respectively. These repre-sent the portion of each investor in the total demand in the market. The sophisticated in-vestor, being the arbitrator, is doing the arbi-trage transaction only with the passive inves-tor.
The Model
De Long et al. (1990b) use the follow-ing structure in their modellfollow-ing (Table 2). In Table 2, 2
1 2 a
indicates the fundamental risk on dividend or fundamental value (2) and investors risk aversion g. The symbols d and b are used for the positive feedback coeffi-cient toward current and previous price re-spectively.
The demand of noise traders is affected by the coefficient of positive feedback (d and
b) and the demand shock v . The demand
of passive investors is a function of the fun-damental risk and their risk aversion only (a). The market will always be in equilibrium whereby supply of the stocks is comprised of the sum of the demand of noise traders, sophisticated investors and passive investors. Therefore, the net supply of shares is assumed to be equal to zero. The demand of the so-phisticated investors would be the residual in a market clearing condition. As shown in Table 2, the demand of sophisticated inves-tors in Period 1 and 2 still has to be deter-mined. The demand of these investors was analyzed using backward induction method started from Period 2. The demand of the sophisticated investors in Period 1 and 2 will be based on the objective of maximizing the average variances of the utility function with the coefficient of risk aversion .
The demand shock condition is symbol-ized by v. If the signal of demand shock is still uncertain, then, the demand of sophisti-cated investors will depend upon the shock condition, which, from the positive point of view, the value is v = 0 or vv. From the negative side the value would be v= 0, or
v v
. The analysis of the effect of positive Table 2. Structure of Demand for Stock Model(De Long et al. 1990b)
Period Events Demand of Investor
Noise Trader Passive Sophisticated
0 None 0 0 Optimal choice ( = 0)
1 Sophisticated investor receive a signal of price shock in period 2
p10
ap1Optimal choice
D1f
2 Noise trader creates a demand shock v
p p1 0
2 0
p p v
ap2
Optimal choice
D2f ap2
3 All investors liquidate their shares and receive dividend
or negative shock would be the same. The shock condition is denoted by subscript a if
v= 0 and b if v v. The analysis below will be made from the positive point of view. In Period 2, the aggressiveness of the sophisticated investors will be constrained by the fundamental risk on dividend only be-cause they have to liquidate the shares in Period 3. Therefore, the demand in Period 2 would be: D2r ap2.
The demand of sophisticated investors in Period 1
D1r could be found using certainequivalent wealth concept in Period 2. The use of 1
r
D to maximize the average
variance of the expected utility in Period 1, result (Equation 1).
... (1) The price in Period 1 and 2 will be de-pend on the existence (size) of the sophisti-cated investors. Price in Period 0 is equal to the fundamental value stated at zero (0) and the price in Period 3 will be back to this value. In this period all shares are liquidated. The price in Period 1, therefore, as Equation 2 and Equation 3.
if > 0...(2) or
1
p , if ...(3)
If there are no sophisticated investors (= 0) the price in Period 1 will be equal to
zero. Therefore, there is no changes compared to the price in Period 0. However, if sophis-ticated investors is in existence > 0) the price in Period 1 (p1) will be positive when
a> ( + ) and v must be small. Meanwhile. If p1> 0 and a> , then, p1 will increase if m increase.
The price in Period 2 will be categorized into p2a when the shock actually happened
v v
and p2b when there is no shock (v= 0). The trend of price in Period 2 will depend on the application of positive feedback strategy in Period 2 (). invariant with the price in Period 1. In this case, an increase in (sophisticated inves-tors) will result a price deviation from the fun-damental value in Period 1, but no effect to the price of Period 2. On the other hand, if > 0, prices in Period 1 and 2 will continu-ally deviate from the fundamental value in any time and condition. The price in Period 2 will increase toward Period 1 regardless the condition of v. This condition will be revert-ing in Period 3 where the stock price will be back to the fundamental value.The model, concludes that if the noise traders apply their positive feedback strategy in Period 1 and 2, and there is a sophisticated investors in the market, then the stock price will continually increase in those periods com-pared to Period 0. It will be back to the fun-damental value in Period 3. There is a revert-ing pattern in the movement of stock price. The mean reverting pattern is a process whereby in the short run the stock prices have
a positive serial correlation and finally will be followed by a reversion to the average price in the long run.
The Behaviour of Investors and
the Demand Function
The study concludes that, instead of acting as an arbitrator and bringing the share’s price back to the fundamental value, the so-phisticated investors, during a price increase, have actually been doing the opposite. They follow the positive feedback strategy, there-fore, shifting the demand function up-ward, and then, withdraw from the market when price is going to fall. This phenomenon, whereby, in the short run, the share’s price has a positive serial correlation, and is fol-lowed by a reversion to it’s mean in the long run, has been indicated in many empirical studies such as Fama and French (1988), Poterba and Summer (1988); and Lo and Mackinslay (1988), see De Long et al. (1990b).
The pattern of the mean reverting pro-cess will be dependent upon the existence of the noise trader. There also should be enough passive investors so that the demand could be manipulated by noise traders as well as sophisticated investors. Note that this pat-tern is basically due to the different demand function between noise traders and sophisti-cated investors. The differences in demand function reflect the inequality of preferences and, therefore, the behaviour between noise traders and sophisticated investors in re-sponding price changes. The different behaviour, basically, corresponds (among oth-ers) to the different investors’ attitudes to-ward risk. Moix (2001) classifies the risk into those related to individual aversion and the risk of the game (transaction).
The model above is, basically, analyz-ing the effect of demand pattern and size of the different type of investors on the price movement in the market. The mean revert-ing pattern indicates a price fluctuation due to noise trader’s misperception of risk (of the transaction). Additionally, in fluctuations, price contains a deviation from the fundamen-tal value caused by factors other than the fun-damental risk. Shleifer (2000) calls this ele-ment sentiele-ment based risk, while De Long et al. (1990a) call it noise trader risk. In this pa-per it will be considered as speculative risk.
Demand Pattern and Price
Volatilities
De Long et al. (1990a) accommodate those misperception risks in their price for-mulation model. The price of risky assets will comprise of its fundamental value plus the premium associated with the noise traders’ misperception toward risk. They elaborated the speculative element through the idiosyn-cratic variances (De Long et al. 1990), which is a random variable with parameter t. This parameter describes the noise trader’s opin-ion about the standard of deviatopin-ion (vari-ances) of the return. If the investor’s deci-sion is based on this perception, the variances will not be constant.
(Widarjono 2007). Singleton (2006) stated that this method is widely used in a discrete time volatility model.
If the price contains a misperception of risk, then, the related demand will also be affected by this risk. The element of misperception of risk in the demand func-tion indicates the behaviour of the investors. The mean reverting process of the price vola-tilities is basically due to movement in de-mand function.
The misperception of risk creates a bubble, defines as a deviation from the fun-damental value (Tirole 1985). As mentioned by West (1988) there are rational as well as speculative bubble. The positive strategy adopted by the noise trader has caused the bubble price tend to leverage up. Malkiel (2010) refers those situations as feedback loop. Price increase tends to motivate inves-tors to push their demand. In turn, the in-crease in demand will push the price up any further. Continuously, the price will always be moving upward with more and more bubble content in it. In this paper the bubble will be considered as a manifestation of misperception of risk.
The bubble price fluctuates and could only be maintained if the real economy is still been able to support it (Tirole 1985). The real economic support could be represented by the growth of the gross domestic product (Tirole 1985). The financial economist spells out those supports by the fundamental value of the firm. Soemarso (2012) measures the real economic support using the debt paying abil-ity of the investors, viewed from the macro-economic side, i.e. the portion of foreign in-vestors transactions vis a vis local inin-vestors. If the real economic foundation can no longer support the bubble, then, a boom bust could
happen. In the capital market, a market crash, is a manifestation of a boom bust situation.
The probability of market crash could be evaluated using the De Long et al. (1990b) model on noise traders’ demand function as has been described above. If the sophisticated investors are dominant in the market, the mean reverting process will take place gradu-ally because of their objective to maximize utility in an efficient market condition. On the other hand, if the noise trader dominates the market, price will not revert to the mean, although the maximum threshold allowed by the growth of the fundamental value has al-ready been exceeded. In this speculative bubble situation, the mean reverting process will last longer or, alternatively, a market crash will take place, i.e., when the noise trader’s economic capacity can, no longer, support the price increase.
Hypothesis Development
The purposes of the study, as has been mentioned before, could be rewritten as fol-lows:
Purpose (1) : To observe the implementation of the positive feedback strat-egy during the stock trading. Purpose (2) : To observe the existence of
misperception risk in deciding the investment in stock. Purpose (3) : To observe the existence of
The first purpose of the study will be tested using the following Hypothesis 1. H1: Positive feedback strategy is not implemented
by local and foreign investors as well as the total market during their trading in the Indo-nesia Stock Exchange.
This paper studies the behaviour of in-vestors during their trading in stock market. Therefore, the concern will primarily be in their demand side. The De Long et al. model (1990b), with respect to demand function (Equation 1), will be used as a basis for mod-elling. The price equations in the model (Equation 2, 3, 4 and 5) are presented to prove the reversing pattern of the prices when a positive feedback strategy is applied by the noise traders during their trading.
As indicated in Table 2, the critical de-mand function in the model is the dede-mand of the sophisticated investor in Period 1. This is a demand function of the sophisticated investors, as a response to the signal of shock identified by the noise traders at the same period. The price movement in Period 1 will be determined by this demand function (note that the demand function in Period 2 will be back to the basis of maximum utility).
The model to capture the demand func-tion of local, foreign and total investors is as Equation 6.
lnV ti ilnP t ...(6)
In the equation above i refers to the type of investors which could be foreign, lo-cal and total investors. The symbol indi-cates the positive feedback coefficient which may be different for each type of investor. This coefficient represents the elasticity of volume representing demand and the price. The hypothesis would be = 0. If this hy-pothesis holds true then the demand func-tion of the total market as well as the foreign
and local investors will not be affected by their positive feedback strategy.
Testing for the second purpose of the study will be based on the following Hypoth-esis 2.
H2: Misperception of risk is not considered in the investment decision of local and foreign inves-tors as well as the total market in the Indone-sia Stock Exchange.
Misperception of risk is always associ-ated with price formation (see Wu and Xiao 2008). However, application to the demand function will also be plausible became demand depend on price and by using transitive prop-erty, the approach will be academically sup-ported. The existence of misperception of risk will be detected through the variances () of the residuals, (Equation 6). This will be considered as speculative element in the equation which will be analyzed on the basis of the existence of: (1) positive serial corre-lation with the previous residual; (2) positive serial correlation with the previous residual variances and; (3) the symmetrical effect of positive versus negative shock (Widarjono 2007).
Referring to Widarjono (2007) the speculative element will be tested using the Equation 7.
variances of the residuals () of the main equation, . The equation is trying to ex-plain that variances of the residual consist of the constant variable (which deemed to be the effect of systematic risk), the serial correlation of the previous residual
1
and the previous residual variances
t1 and the asymmetrical effect ofposi-tive vis a vis negaposi-tive shock 1 1 pothesis is empirically proven, the variances of the residuals will be constant at . No posi-tive serial correlation of the variances exists and, therefore, no misperception of risk was applied in price determination. Meanwhile, the assymetricality of the responses toward positive vis a vis negative shocks could be determined as true.
Purpose (3) uses the following Hypoth-esis 3:
H3: Stock price fluctuation is not reverted back to the mean due to the trading behaviour of local and foreign investor as well as total market in the Indonesia Stock Exchange.
The reverting pattern of the price (Equa-tion 2, 3, 4 and 5) will be tested through the existence of misperception of risk during the formation of demand. Note that variables affecting price in Equation 2, 3, 4 and 5 con-sist of, among others, coefficient of positive feedback (d and â), coefficient of risk aver-sion (g) and the demand shock (v). All of these risks are subject to misperception. Ad-ditionally, the price is also affected by the portion of sophisticated investor (m) which is conditional to the market and fundamen-tal risk which depends on the performance of the company issuing the shares. The
misperception of risk, therefore, will be re-flected in the variances of the residuals of the equation.
The existence of the mean reverting process and the period needed to come back to the mean will be tested using Error Cor-rection Model (ECM). Referring to Widarjono (2007), the error correction model of the above equation is as Equation 8.
0 1 2
lnV h ht lnP h ECt t
...(8) The hypothesis is that the coefficient of must be equal to zero. If not, then, this coefficient can be used to calculate the pe-riod of mean reverting. If there is no dis-equilibrium error in the short run. Short run equilibrium equals the long run one. There is no need to have an equilibrating process. The disequilibrium coefficient (in absolute amount) measures the time (period) needed to achieve the equilibrium. The coefficient indicates short run disequilibrium error.
Methods
Two methods will be used during the empirical testing ie Vector Auto Regression (VAR) and EGARCH. The VAR method is, basically, used to detect to nature and direc-tion of the reladirec-tionship among variables, and the stability of the equation. VAR method comprises three step, ie: (1) stationary test-ing; (2) cointegration testing and; (3) estima-tion. The stationary testing was made to in-dicate the existence of unit root in the data. If the stationary does exist, then, the vari-ances are constant at and the data could be used for further testing.
Cor-rection Model (VECM) will be used to esti-mate the model. Conversely, if there is no co-integration, the Vector Auto Regression (VAR) method should be applied. Analysis of the significance and direction of the rela-tionship could be made during estimation. The Granger Causality test is used for this purpose. The stability of the model will be tested during the empirical testing. The VECM method can also be used to test the existence of mean reverting process and it’s convergence period. The EGARCH method test the existence of speculative element in the price formulation.
The model was empirically tested using LQ45 companies listed in the Indonesian Stock Exchange as a sample. Data used are: (1) LQ45 index (index) represent price; and (2) volume of transaction (volume or V) for demand. The data for volume will be broken down into foreign foreign), local (vol-local) and total (vol-total). Monthly data dur-ing February 1997 to December 2010 will be used for the testing. All data was converted into logarithmic form. All of the statistical regression was processed using Eview 7.
Result
The test for index does not have a unit root at first difference. The data is, therefore, stationary. The same result was obtained for volume of local as well as foreign investors and total investors. The co-integration test indicates that there is no such co-integration between index and foreign investor volume. With regard to local and total investors, the test concluded the existence of co-integra-tion. The appropriate lag period for both to-tal and foreign investors is 10 and 4 for local investors. This choice is based on the small-est value of Akaike Information Criterion (AIC) or Schwarz Information Criterion (SIC). Based on this result, VECM is applied for
local and total market while VAR is used to regress the data of foreign investors.
Hypothesis (1)
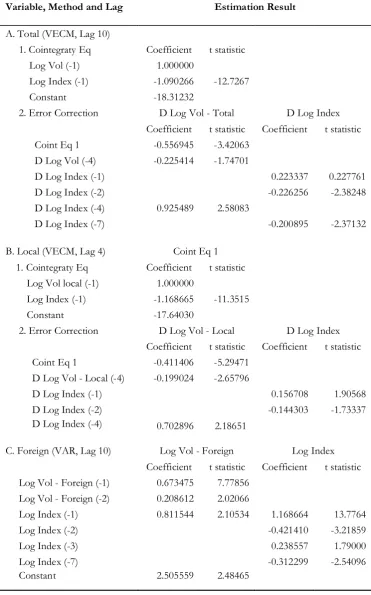
The result of the regression using VECM for local and total investor and VAR for foreign investor is shown in Table 3. The regression was made to test the Equation (6 as well as 8). As can be seen from the table, in totality (local plus foreign investors) the relationship between volume and index will tend to reach a long run equilibrium. This relationship can be written in the Equation 9.
Log Vol (-1) = – 1.090266{Log Index (-1)} – 18.31232
...(9) The t-statistic result that log Index (-1) was significant in influencing Log Vol (-1). The co-integrating equation could be obtained from Table 3 as: -0.556945 [1.000000 {Log Vol (1)} 1.090266{Log Index (1)} -18.31232]. The coefficient of cointegrating equation (-0.556945) indicates the speed needed to reach the long run equilibrium value.
Table 3. Result of Estimation: Volume and Index by Type of Investor
Variable, Method and Lag Estimation Result
A. Total (VECM, Lag 10)
1. Cointegraty Eq Coefficient t statistic
Log Vol (-1) 1.000000
Log Index (-1) -1.090266 -12.7267
Constant -18.31232
2. Error Correction D Log Vol - Total D Log Index
Coefficient t statistic Coefficient t statistic
Coint Eq 1 -0.556945 -3.42063
D Log Vol (-4) -0.225414 -1.74701
D Log Index (-1) 0.223337 0.227761
D Log Index (-2) -0.226256 -2.38248
D Log Index (-4) 0.925489 2.58083
D Log Index (-7) -0.200895 -2.37132
B. Local (VECM, Lag 4) Coint Eq 1
1. Cointegraty Eq Coefficient t statistic
Log Vol local (-1) 1.000000
Log Index (-1) -1.168665 -11.3515
Constant -17.64030
2. Error Correction D Log Vol - Local D Log Index
Coefficient t statistic Coefficient t statistic
Coint Eq 1 -0.411406 -5.29471
D Log Vol - Local (-4) -0.199024 -2.65796
D Log Index (-1) 0.156708 1.90568
D Log Index (-2) -0.144303 -1.73337
D Log Index (-4)
C. Foreign (VAR, Lag 10)
0.702896 2.18651
Log Vol - Foreign Log Index
Coefficient t statistic Coefficient t statistic
Log Vol - Foreign (-1) 0.673475 7.77856
Log Vol - Foreign (-2) 0.208612 2.02066
Log Index (-1) 0.811544 2.10534 1.168664 13.7764
Log Index (-2) -0.421410 -3.21859
Log Index (-3) 0.238557 1.79000
Log Index (-7) -0.312299 -2.54096
These indicate that the previous changes in price have a leverage effect on the current demand at different lag.
The relationship between current vol-ume and the previous one (lag 1 and 2) is positive for foreign investors. However, note that the sign is negative for the local. This indicates that there is a leveraging effect of changes in previous volume in pushing the current demand of foreign investors. On the other hand, the negative sign for local inves-tors may be interpreted as being the restrain-ing effect. Both indicate the existence of se-rial correlation in the variables.
The relationship as shown in the result of the regression above indicates the impor-tance of positive feedback strategy imple-mented by the foreign investors. The short run nature of the foreign investors’ view sup-port the conclusion that the investment hori-zon of the foreign investor is shorter com-pared to the local one. Volatilities of the for-eign investors, therefore, are much bigger. The existence of long run equilibrium in the local investors side will pull the price volatilities back to the mean. Therefore there is a long term equilibrium in the total market and the mean reverting process applies.
The Granger causality test indicates that, at a confidence level of 95 percent, there is one direction of relationship with volume as dependent variable and index as indepen-dent variable for foreign investors. This sup-ports the theory that volume is a function of price. At 90 percent confidence level those kinds of relationship was valid for all types of investors. Meanwhile, the stability test in-dicates that at lag 10, the model is stable for local and total investors. The model for for-eign investors is stable at lag 2, 4 and 6.
Hypothesis (2)
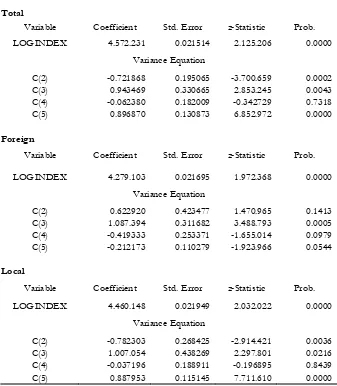
Using EGARCH, the regression result for volume and index broken down by type of investor can be seen in Table 4. Translat-ing to Eviews 7 software, the Equation (7) has been rewritten as follows:
LOG(GARCH) =C(2)+C(3)*ABS[RESID (-1)@SQRT(GARCH(-1)] + C(4)*RESID (-1)/@SQRT[GARCH(-1)] +
C(5)*LOG[GARCH(-1)].
The C(2) is a constant, while C(3), C(4) and C(5) represent and respectively in Equation (7). These coefficients will be used to evalu-ate the differences of the investors’ attitude toward misperception risk.
The table shows the consistency of for-eign, local and total investors in terms of the existence of a relationship between volume and price. Index has significantly affected volume. The coefficient of index for foreign is 4.279103, local 4.460148 and total inves-tors: 4.372231. The elasticity of index to volume for local investor is slightly higher than the foreign meaning that the local in-vestors are more responsive to price changes compared to the foreign. The sign of the co-efficient is positive for foreign, local as well as total investor. They are all using the posi-tive feedback strategy, at a different degree, in the stock trading.
Equation used in the model:
LOG(GARCH) = C(2) + C(3)*ABS(RESID(-1)/@SQRT[GARCH(-1)] + C(4)
*RESID(-1)/@SQRT[GARCH(-1)] + C(5)*LOG[GARCH(-1)]
Total
Variable Coefficient Std. Error z-Statistic Prob.
LOGINDEX 4.572.231 0.021514 2.125.206 0.0000
Variance Equation
C(2) -0.721868 0.195065 -3.700.659 0.0002
C(3) 0.943469 0.330665 2.853.245 0.0043
C(4) -0.062380 0.182009 -0.342729 0.7318
C(5) 0.896870 0.130873 6.852.972 0.0000
Foreign
Variable Coefficient Std. Error z-Statistic Prob.
LOGINDEX 4.279.103 0.021695 1.972.368 0.0000
Variance Equation
C(2) 0.622920 0.423477 1.470.965 0.1413
C(3) 1.087.394 0.311682 3.488.793 0.0005
C(4) -0.419333 0.253371 -1.655.014 0.0979
C(5) -0.212173 0.110279 -1.923.966 0.0544
Local
Variable Coefficient Std. Error z-Statistic Prob.
LOGINDEX 4.460.148 0.021949 2.032.022 0.0000
Variance Equation
C(2) -0.782303 0.268425 -2.914.421 0.0036
C(3) 1.007.054 0.438269 2.297.801 0.0216
C(4) -0.037196 0.188911 -0.196895 0.8439
C(5) 0.887953 0.115145 7.711.610 0.0000 Table 4. Result of Estimation Using EGARCH Method Variable: Volume and Index
At the same confidence level, the serial cor-relation with the previous residual is also proven as indicated by the significance of coefficient C(5). The existence of serial cor-relation supports the conclusion that stock market is following the trend.
The constant variable represented by C(2) is significant only for local and total in-vestors. The probability of error for foreign investors seems to be too high to justify the
Hypothesis (3)
The result of the Equation (9) is repre-sented in the error correction equation in Table 3. As shown from the table, in the short run, the first difference equation indicates that the variable D log vol is affected by lag 4 of it’s own variable {(D Log Vol (– 4) and index {D Log Index (– 4)}. The sign of D Log Vol (– 4) is negative meaning that the changes in lag 4 of volume will influence negatively the current changes of D Log Vol. On the other hand, the current changes of D Log Vol are positively affected by the changes of index with a lag period of 4. This kind of relation-ship indicates the implementation of positive feedback strategy by the investors. The ef-fect of positive feedback strategy was cor-rected negatively by the changes in volume. This will reduce the power of these strate-gies. The period needed to converge to the long term equilibrium is 1.8 months.
The relationship between volume and index of the local investor also tends to reach a long term equilibrium (t statistic – 11.3515). The co-integrating equation is: – 0.411406 [1.000000 {Log Vol Local (-1)} – 1.168665 {Log Index (-1)} – 17.64030]. As for total investors, in the long run, the volume of lo-cal investors is also affected significantly by index. The error correction equation indicates that in the short run, the first difference of local investor volume (D Log Vol-Local) is affected by lag 4 of the changes in volume-local and index. The sign of relationship was negative for volume-local and positive for index (consistent with total investors). The convergence period needed by the local in-vestor to reach the long term equilibrium is 2.4 months. Since the related data does not cointegrate to long term equilibrium, no con-vergence period exist for the foreign inves-tors. No mean reverting process took place for them.
The asymmetrical test shows that there is no difference in the behaviour of local and total investors toward positive vis a vis nega-tive shock. They are neutral toward shocks with expected gain or losses. The insignifi-cancies of coefficient C(4) in the Eviews version of Equation (7) support the above conclusion. The type of shock does not af-fect the reverting process of the fluctuation. At confidence level 90 percent, however, the asymmetrical test saw a significant statistical result for foreign investors. They are con-cerned about the nature of the shock whereby they are more responsive toward negative shock (losses) rather than the positive one (gains). In other words, the foreign investors will be more reactive in responding to the expected price decline rather than to the ex-pected increases of price.
Statistical Evaluation
Using VECM or VAR, certain statisti-cal results are shown in Table 5.
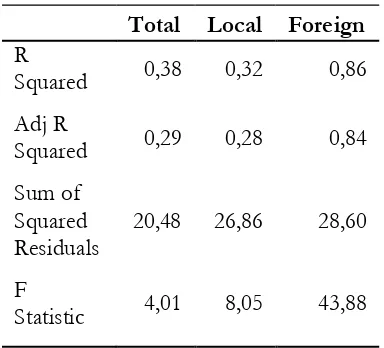
The table shows that, for foreign inves-tors, the sole independent variable, Index (represent price) explain 86 percent of the variation of the dependent variable, Volume
Table 5. Certain Statistical Result
Total Local Foreign
R
Squared 0,38 0,32 0,86
Adj R
Squared 0,29 0,28 0,84
Sum of Squared
Residuals 20,48 26,86 28,60
F
Statistic 4,01 8,05 43,88
(represent demand). The numbers for local investors and total market were 32 percent and 38 percent respectively. The tendency is also true for adjusted R Squared. Addition-ally, the sum of squared residuals for total market, local and foreign investor were 20,48; 26,86 and 28,60 respectively. The gap among investors is not so material.
It is clear from the result above that price is the most dominant factor in deter-mining the demand for foreign investors. The role of price in determining the local and to-tal market, however, is less than 40 percent. It does mean that other factors (other than speculative element which is unobservable) may contribute to the variances of their de-mand. It supports the conclusion that local investors and total market tend to reach equi-librium in the long run. The mean reverting process with the local investors as the arbitrageurs, therefore, holds.
The goodness of fit for the regression could be calculated using F statistic. As shown in Table 5 above, the calculated F value for total market, local investor and for-eign investors were 4,01; 8,05 and 43,88 re-spectively. The critical value for confidence level 95 percent and degree of freedom (1,200) is 3,89. All the calculated values ex-ceed the critical one. The hypothesis that demand is a function of price, then, is ac-cepted.
Conclusions,
Recommendations, and
Limitations
Based on the result of the study, it is concluded that positive feedback strategy seems to dominate the stock trading in the Indonesian stock market. Both foreign and local investors use this strategy to different
degrees. The foreign investor tends to rely on the short run market trend, while the local investors are still interested in investing on a long term basis. The investment horizon of the foreign investor is shorter compared to the local one. This finding supports the view that in terms of perception of risk, local in-vestors are not followers of the foreign ones. The condition above also drives the mean reverting process of stock prices in the Indonesian stock market. Short run price volatilities due to foreign investors will be neutralized in the long run by the local in-vestors. They will pull the volatilities back to the mean. With respect to the mean revert-ing process, the local investor needs a period of 2.4 months to converge while the total market is only 1.8 months. No convergence period is needed for foreign investors. It should be noted that every quarter the capi-tal market will update the information on fundamental values. The local investors, therefore, could be regarded as the arbitrageur of the market, in the long run. Meanwhile, the foreign investors are more noise trader type with their short run objectives in mind. Although the application of positive feedback strategy is stronger, the foreign investor’s demand sensitivity toward price changes is less than the local investor’s. This probably is due to the fact that the foreign investor is more interested in the short run trading and following the market trend. This behaviour may create more volatility in the market. However, since the local investors still dominate the Indonesian stock market, the total market tends to follow the local investor’s trading strategy.
aver-sion of local investors, as well as the total market. is neutral toward the expected gains or losses. From the view point of foreign in-vestors, however, there are asymmetrical re-sponses toward positive vis a vis negative shock. They are more responsive to capital loss rather than the gain.
The policies to influence the investor behaviour should be directed toward a situa-tion where there should be no asymmetric information and mispricing or misevaluation during an investment decision. Effort to boost the local institutional investors (who are not noise traders by nature) to play in the capital market should be encouraged.
The capital inflows for indirect invest-ment in the capital market should be man-aged carefully. Enough exchange reserve must be available to cover capital outflows when the foreign investor pulls back their
investment from Indonesia. There should be a special reserve maintained permanently for it.
The speculative intention should be minimized by, for example, levying tax on capital flowing-in within a period less than a certain time. The information system to monitor foreign ownership in the capital mar-ket should be developed. Improvement should be made on the coordination between mon-etary and capital market policies.
As a limitation, it should be noted when reading this paper that the behaviour analyzed in this study is basically relevant only to the market behaviour not individual (investor’s) behaviour. It is assumed that the individual behaviour will be reflected in the market. The model, therefore, could not be used to ana-lyze individual behaviour or that of a group of individuals.
References
Agenor, P-R. 2000. The Economics of Adjustment and Growth: 240-249. Academic Press.
Widarjono, A. 2007. Ekonometrika, Teori dan Aplikasi untuk Ekonomi dan Bisnis: 319-391. Ekonisia.
Aiyagari, S. R. 1988. Economic fluctuations without shock to fundamentals; or, does the stock market dance to its own music. Quarterly Review 12 (1) (Winter). Federal Reserve Bank of Minneapolis. De Long, J. B., and A. Shleifer, L. H. Summers, and R. J. Waldmann. 1990a. Noise Trader Risk in Financial
Market.Journal of Political Economy (98) (4) (December): 703–738.
De Long, J. B., and A. Shleifer, L. H. Summers, and R. J. Waldmann, 1990b.Positive Feedback Investment Strategies and Destabilizing Rational Speculation.The Journal of Finance (45) (2): 379–395.
De Long, J. B., A. Shleifer, L. H. Summers, and R. J. Waldmann. 1988. The Survival of Noise Traders in Financial Markets.The National Bureau of Economic Research.
Edenfield, A. K. 2003. Book review: Irrational exuberance’ Robert J. Shiller. Journal of Banking & Finance
(27): 779–782.
Fama, E. 1970. Efficient capital market: A review of theory and empirical work.Journal of Finance (May): 383–417.
Fama, E, and R. F. Kenneth. 1988. Permanent and temporary components of stock price. The Journal of Political Economy (96) (2): 246–273.
Malkiel, B. G. 1990. A Random Walk Down Wall Street. US: W.W Norton & Company.
Malkiel, B. G. 2010. Bubbles in asset prices. CEPS Working Paper (200): 1–21.
Picerno, J. 2010. Dynamic Asset allocation, Modern Portfolio Theory Updated for the Smart Investor. NY: Bloomberg Press.
Shiller, R. J.1981. Dostock price move too much to be justified by subsequent changes in dividends?.The American Economic Review 71 (3) (June): 421-436.
Shiller, R. J. 2000. Irrational Exuberance. Princeton University Press.
Shiller, R. J. 2008. The Subprime Solution, How Today’s Global Financial Crisis Happened and What to Do about It. Princeton University Press.
Shleifer, A. 2000. Inefficient Market, an Introduction to Behavioral Finance. Oxford University Press.
Shleifer, A; and L. H. Summers. 1990. The noise trader approach to finance. Journal of Economic Perspectives
(4) (2): 19–33.
Singleton, K. J. 2006. Empirical Dynamic Asset Pricing. Princeton University Press.
Rahardjo, S. R. 2012. The role of investor’s debt paying ability in the stock market crisis. Asia Pacific Journal of Accounting and Finance (2) (2) (June): 147–164.
Tirole, J. 1985. Asset bubbles and overlapping generations. Econometrica (53) (6): 1466–1528.
West, K. D. 1988. Bubbles, fads and stock price volatility tests: A partial evaluation. The Journal of Finance
(XLIII) (3): 639–656.