www.elsevier.comrlocaterdsw
The impact of new manufacturing requirements on production
line productivity and quality at a focused factory
Ashok Mukherjee
a,), Will Mitchell
b, F. Brian Talbot
c aWSOM, Case Western ReserÕe UniÕersity, 10900, Euclid AÕenue, CleÕeland, OH 44106-7235, USA
b
UniÕersity of Michigan Business School, MI, USA
c
UniÕersity of Michigan Business School, MI, USA Received 2 October 1998; accepted 17 June 1999
Abstract
This research studies how changes in manufacturing requirements affect production line performance in a focused factory. Specifically, we examine whether production line labor productivity and conformance quality decline as the range of models produced and the heterogeneity of production volume increase in a factory designed for high volume production of a narrow range of models. We use the organizational nature of production lines to argue that the performance of focused production lines will decline when the lines adopt new manufacturing tasks that are outside the scope of the absorptive capacity developed through the execution of their prior focused manufacturing task, but not otherwise. The study examines four years of data from 16 production lines of a compressor manufacturing factory of the Copeland Corporation. Our statistical analysis identifies limits to change, suggests paths to successfully changing the manufacturing requirements of a focused factory, and places the operations strategy discussion of focused factories in a dynamic environment. q2000 Elsevier Science B.V. All rights reserved.
PACS: M11
Keywords: Operations strategy; Focused factory; Organizational change; Field research
1. Introduction
In the Operations Management literature, the ar-gument that focused factories should typically out-perform more general-purpose production facilities
Ž .
started with the seminal work of Skinner 1974 and
Ž .
continues to date Schmenner and Swink, 1998 . Although most of the writing on manufacturing fo-cus emphasizes stable manufacturing environments
)Corresponding author. i2 Technologies, Irving, TX, USA. Tel.:q1-214-860-600; e-mail: ashok [email protected]–
ŽStobaugh and Telesio, 1983; Hayes and Wheel-wright, 1984, p. 90, p. 108; Hayes and Clark, 1985;
.
Hill, 1994, p. 152 , most factories inevitably face changes in their manufacturing requirements. Owing to difficulties in adaptation, it is possible that the performance of focused factories will decline when their activities change. This paper examines the rela-tionship between manufacturing focus and factory performance in a dynamic environment. Specifically, we examine how the performance of a focused fac-tory’s production lines changes after the factory changes its manufacturing requirements. We define focus in terms of manufacturing requirements and
0272-6963r00r$ - see front matterq2000 Elsevier Science B.V. All rights reserved.
Ž .
measure changes in focus through variables that affect production line activities.
Our explanations of relationships between change in manufacturing requirements and production line performance draw from a conceptual model of man-ufacturing activities that includes two dimensions: manufacturing routines and absorptive capacity for adaptation of routines. We base the model on the organizational nature of production line activities. A production line is an organizational unit, which one can view as a collection of self-sustaining routines
ŽNelson and Winter, 1982 . Organizations and their.
sub-units such as production lines often find it diffi-cult to depart from prevailing routines. We draw most directly on the concept of absorptive capacity, which is the ability to recognize, evaluate,
assimi-Ž
late, and utilize new knowledge Cohen and
.
Levinthal, 1990 . We argue that manufacturing focus sometimes creates conditions under which produc-tion lines lack the absorptive capacity to adapt effec-tively to requirements unrelated to their existing focused task. We conceptualize manufacturing tasks as activities that the manufacturing function needs to accomplish. We hypothesize that the performance of focused production lines will decline when the lines adopt new manufacturing requirements that are out-side the scope of the absorptive capacity developed through the execution of their prior focused manu-facturing requirement.
We test the hypotheses at 16 production lines of a well-known focused factory of the Copeland Corpo-ration of Sidney, Ohio, using primary output and performance data over a four-year period during which the company changed the manufacturing re-quirements of the production lines. The factory is located at Hartselle, AL. Consistent with the require-ments of a theory testing case study, the conceptual variables of the hypotheses are general constructs, while the operational variables are specific to the site. Our statistical analysis both illustrates the limits of change in operations strategy and identifies paths through which factories may undertake successful change.
2. Background literature
Studies seeking empirical evidence on the benefits and costs of factory focus include case studies and
statistical studies. Several broad, multi-industry,
Ž
multi-plant case studies Skinner, 1974, Ferdows,
.
1997 as well as narrower-scope site-specific studies
ŽHayes and Wheelwright, 1984, p. 34, Ruwe and .
Skinner, 1987 suggest that focused factories lead to better manufacturing performance and competitive success. In the practitioner literature, studies by
con-Ž
sulting firms such as McKinsey Rommel et al.,
. Ž .
1995 , and Andersen Consulting Harmon, 1992 report substantial improvement of operating perfor-mance of factories through implementation of focus at over 2000 factories worldwide. However, while case studies examining specific focusing efforts of-ten suggest superior factory performance, the conclu-sions often come from broad observations rather than scientific examinations.
In addition, a few statistical studies have studied how product variety, which is one surrogate of focus, affects manufacturing performance, producing am-biguous results. Some researchers have observed positive relationships between manufacturing perfor-mance and measures of limited product variety, both
Ž
cross-sectionally Banker et al., 1990; Brush and
.
Karnani, 1996; McDuffie et al., 1996 and
longitudi-Ž .
nally Anderson, 1995 . Other researchers have found little effect of product variety on manufacturing
per-Ž
formance Hayes and Clark, 1985; Foster and Gupta,
.
1990; Kekre and Srinivasan, 1990 . Thus, it is diffi-cult to arrive at a generalizable empirical conclusion about the relationship between product variety and performance from prior studies. More importantly for our purpose, however, most of these examina-tions do not address whether the manufacturing plants they studied engaged in the managerial exercise of focusing, which involves determining limited manu-facturing requirements and tailoring the manufactur-ing systems to these requirements. Moreover, the studies differ in the variables they have used as measures of performance and product variety. Stud-ies that use relatively simple measures of product variety find little correlation between variety and
Ž
cost e.g., Hayes and Clark, 1985; Foster and Gupta,
.
1990; Kekre and Srinivasan, 1990 , while studies using more sophisticated measures of product variety often find a positive relationship between limited
Ž
variety and superior performance e.g., Banker et al.,
.
metrics of focus. We believe that our work facilitates the measurement of aspects of the complex phe-nomenon of focus. Finally, theoretical economic models have been unable to include the number of products in the cluster of complementary elements that maximize the profits of most modern
manufac-Ž .
turing firms e.g., Milgrom and Roberts, 1990 . Therefore, substantial room remains for additional research.
We use an approach, involving the production line as the unit of analysis, that we believe can be applied in many discrete manufacturing industries. Our study explicitly considers the nature of focusing at production lines, and then rigorously examines the impact of changing two dimensions of production line focus. In contrast to the above-mentioned quanti-tative studies that examine aspects of product vari-ety, which represents only one dimension of the complex phenomenon of focus, some recent studies have begun to measure focus as a multi-dimensional
Ž
concept, using perceptual data Bozarth, 1993; Pesch
.
and Schroeder, 1996; Berry and Bozarth, 1997 . We discuss these studies in detail in Section 5.2 where we measure manufacturing requirements, and posi-tion our work relative to the conceptual frameworks that these authors suggest. In the next section of the
paper, we present a conceptual model of factory focus that we hope will help clarify the discussion of manufacturing focus in the literature and facilitate empirical research.
3. Conceptual model of factory focus
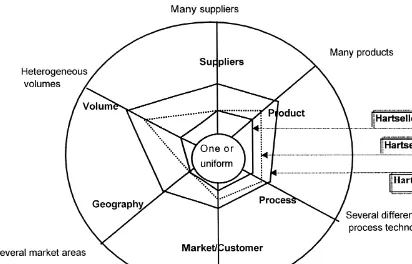
We propose a conceptual model of manufacturing activities that includes two key dimensions: manu-facturing routines and absorptive capacity for adapta-tion of routines. The model suggests two proposi-tions concerning adaptation to changed manufactur-ing requirements. Fig. 1 portrays the model and propositions.
3.1. Limited-Õariation manufacturing routines
We start by discussing the role of manufacturing routines in a focused factory strategy. In our ap-proach, as Fig. 1 highlights, a factory that has chosen to adopt focused manufacturing requirements will develop a set of manufacturing routines that involve a limited skill set for its production lines. One can define the manufacturing task of a factory as
oping and exploiting a set of manufacturing skills deemed necessary by the firm’s strategy. We can think of the manufacturing skills as manifestations of
Ž
the corporate core competencies Prahalad and
.
Hamel, 1990 that are resources of the firm
ŽWernerfelt, 1984 . Indeed, Prahalad and Hamel ar-.
gue that organizational learning about how to coordi-nate diverse production skills is a key element of core competence. The skill-based view of manufac-turing tasks has the appealing characteristic that it provides a theoretical basis for defining focus, be-cause the view connects closely with the
evolution-Ž .
ary theory of Nelson and Winter 1982 . A firm’s manufacturing skills are one component of the firm’s skills. Similarly, the manufacturing skills of a factory comprise the skills of the production lines and re-lated support functions. Following Nelson and Win-ter’s view that routines are the skills of an organiza-tion, we equate skills of a production line with the routines executed at the line. Examples of routines at a production line include technological processing, information flow, material flow, and manufacturing support routines. The general description of routine performance of a production line in equilibrium con-tains two elements. First, the line must retain in its repertoire all routines the line invokes in the given state of operation. Second, the operators of the line must be able to receive, interpret, and respond to messages by executing appropriate routines at appro-priate times.
A key concept underlying the idea that routines are the skills of an organization is that organizations remember by doing. Thus, firms remember produc-tion line skills through executing them. The execu-tion of a producexecu-tion line routine involves the effec-tive integration of a number of component subrou-tines often accomplished without conscious overview, that is, without requiring the explicit attention of management. Since the purpose of focus is to excel in a skill, and since skills are combinations of rou-tines that production lines remember by doing, achieving focus in the task of a production line requires that the line execute the task repetitively. Major tasks for management in focusing a produc-tion line include designing a set of routines that are coherent components of a specific targeted skill set and establishing a process in which employees, ma-chines, and systems can repeat the routines without a
need for explicit reconsideration each time the line executes a step. Hence, a focused manufacturing facility will limit the number of manufacturing rou-tines the facility requires of its operators. In general, the fewer the routines, the more focused a facility. In turn, the performance that the factory achieves is an outcome of the strength of its routines, in the context of its relevant competitive environment. As we dis-cussed earlier, there is at least partial empirical evidence that firms that adopt more focused ap-proaches often achieve superior performance.
A firm can limit the number and variety of rou-tines at a factory’s production lines by limiting the demands on the factory itself. In the late 1970s to mid 1980s, various opinions emerged about how to limit the demands on a factory. Table 1 illustrates several options, drawing from published empirical
Ž
and conceptual work Hayes and Schmenner, 1979; Schmenner, 1982, Hayes and Wheelwright, 1984,
.
pp. 90–108, Hill, 1989, p. 102 . The table’s classifi-cation system for focusing factories examines the firm’s portfolio along one of a set of alternative dimensions and then assigns sections of the portfolio to separate factories. We note six focusing dimen-sions, including product, process, marketrcustomer segment, geographic market region, volumes, and suppliers. However, factories with limited portfolios along a particular dimension may contain conflicts within other dimensions. For example, along the market segment dimension, a product-focused fac-tory may serve several markets that have different price expectations, regulatory standards, and delivery requirements. Consequently, potentially conflicting routines may exist even within a seemingly well-focused facility.
We can analyze the conflicts that arise along focusing dimensions by treating the dimensions of focus as complementary at the level of the individual
Ž .
factory. We draw from Wheelwright 1979 and a
Ž .
Delphi survey of an expert panel by Pesch 1996 to suggest that, at the factory level, focus involves limiting the operating routines of the factory on a continuum along each of a set of complementary dimensions. For the sake of brevity, we illustrate this concept later using our empirical site as an example
Ž .
dimen-Table 1
Dimensions of factory focus
Focusing dimensions Description Examples
Product Products assigned to plants using product based criteria, Appliances
including product life cycle Consumer electricals
Canned food Medical instrument Process Segments of the production process assigned to different Automobiles
plants based on process based criteria Consumer electronics Heavy chemicals Rubber products Apparel
Ž . Ž .
MarketrCustomer Segments Plants dedicated to specific market s or customer s Beverage bottling Industrial equipment Industrial gas Geographic Market Region Each plant produces for a specified geographic region Energy generation
Printing Glass
Asphaltrconcrete Volume High, low and medium volume products assigned to different plants Industrial equipment
Consumer durable Suppliers Each plant procures from a specified geographic region Paper and pulp
Lumber Meat processing Agricultural products Mineral processing
sion. We call these levers the ‘controlling determi-nants’ of focus. As we have noted in our review of the literature, controlling determinants are likely to be case-specific.
The factory-level decisions firms make along the focusing dimensions affect the demands placed on the routines of production lines and may determine the scope of the task of these lines. For instance, a decision to offer three rather than two types of engine for an automobile may increase the demand on the drive-train lines of an assembly plant by requiring additional material, information, and coor-dination. The manner in which dimensional varia-tions at the higher levels affect the demands on a production line remains an open research issue. We attempt to gain insight into this issue by examining the case of a focused factory.
The discussion of routines highlights the role of self-sustaining manufacturing routines in achieving the production line skill of a focused factory. We stress the need to limit variation along multiple focusing dimensions. We now look at the second major element of the model of manufacturing
activi-ties, which is routine-specific absorptive capacity for adaptation.
3.2. Routine-specific absorptiÕe capacity
diffi-Fig. 2. Evolution of focus at Copeland Hartselle.
culty often depends on how related the new require-ments are to the old requirerequire-ments of the unit. The ability to meet a new requirement may require un-learning, learning and responding in a new knowl-edge domain. This requires an ability to evaluate and utilize new knowledge, which Cohen and Levinthal
Ž1990 call absorptive capacity. Fig. 1 uses the term.
routine-specific absorptive capacity to refer to the limits that a particular set of prior routines places on the ability of a production line to learn new skills.
While prior research has not used the concept of absorptive capacity at the level of the production line, studies at levels of analysis both below and above the production line level use the concept.
Ž .
Cohen and Levinthal 1990 base their argument on the literature in individual learning, and establish absorptive capacity largely as a function of prior related knowledge. Specific to manufacturing firms,
Ž . Ž .
Abernathy 1978 and Rosenberg 1982 have noted that direct manufacturing experience helps a firm to recognize and utilize new information relevant to a specific product-market. We believe that the
argu-ment concerning individual-level and firm-level ab-sorptive capacity also applies at the production line level. For our purpose, new knowledge refers to a shared understanding of the change in manufacturing requirements and the consequent responses that a production line will need to undertake in order to create routines that meet the new requirements. Thus, a production line needs to recognize the new require-ments in terms of the routines that they will need, evaluate the line’s own repertoire of routines in order to identify potential recombination elements, identify external resources that the new routines will require, and then utilize appropriate existing elements to-gether with external resources to form a response.
func-tions within the factory, as well as external agents such as parts suppliers. However, there may be a trade-off between the efficiency of internal commu-nication within the line and the ability of the line to assimilate and exploit information from outward sources. Focusing a production line will often stress the inward component at the expense of the outward
Ž .
one, consistent with the argument of Arrow 1974 that the efficiency of an internal communication process is one of the reasons firms are economically attractive forms of organization.
A line’s manufacturing routines will tend to shape the line’s adaptability. As a by-product of routine activity, a production line will tend to develop ab-sorptive capacity for new knowledge that relates closely to the current set of skills. For new knowl-edge that differs markedly from current skills, on the other hand, production lines must develop new ab-sorptive capacity to be successful. Because absorp-tive capacity builds on past activities, however, de-veloping new absorptive capacity will often be slow and difficult. Therefore, pursuit of a narrow focus in one period may constrain the ability to create absorp-tive capacity unrelated to the initial focus, so that the existing limited-variation routines of a focused pro-duction line constrain the line’s ability to meet new manufacturing requirements.
3.3. Propositions
The conceptual model of factory focus suggests core propositions concerning production line perfor-mance following the introduction of new manufac-turing requirements. We have defined production line focus as repeated executions of a limited number of routines that the production line remembers by doing. Highly focused factories will tend to have production line routines that are consistent with the specific skills that the factory requires in its competi-tive environment. Management can limit the set of skills that a factory requires and the set of routines that a production line executes by limiting the oper-ating range of the relevant controlling determinants along the complementary focusing dimensions. In turn, the limited set of routines will limit the capacity that the line develops to absorb new knowledge. The introduction of new manufacturing requirements may necessitate that production lines learn new routines, while the existing absorptive capacity will shape the
effectiveness of the new routines. Thus, the strategic action of focusing production lines may limit the ability of the lines to respond effectively to new manufacturing requirements, because the lines’ lim-ited-variation manufacturing routines will shape the development of absorptive capacity for new knowl-edge. Correspondingly, the performance of the pro-duction lines following the adoption of new require-ments will tend to vary, depending on the fit between a line’s absorptive capacity and the demands of the new requirements. At this point, we will refer to production line performance as a general concept. In the empirical section, we will study both line effi-ciency and line quality.
Proposition 1: The performance of focused produc-tion lines will decline when the lines adopt new routines that are outside the scope of the absorptive capacity the lines developed in order to meet their prior manufacturing requirements.
Proposition 2: The performance of focused produc-tion lines will not decline when the lines adopt new routines that are within the scope of the absorptive capacity the lines developed in order to meet their prior manufacturing requirements.
These general propositions are the basis of the specific hypotheses that we test using data from the Hartselle focused factory. The next section describes the methodology and the empirical context of our study. The following section develops the hypothe-ses.
4. Research methodology and empirical site
This section first discusses our adoption of a single-site field-study as the appropriate methodol-ogy for our research objectives. We then discuss the evolution of focus at the site where we conducted the study.
4.1. Single-site field study
Empirical research on focused manufacturing faces problems with the basic tenets of definition as
Ž
prescribed for socio-technical research
Lachen-.
meyer, 1971 . These difficulties mirror those faced in similar efforts in other fields, as discussed by
Ž .
Ž .
Campbell 1975 . Such difficulties have led re-searchers in several fields to recognize the impor-tance of single cases as a desirable research method
Ž
in such situations Naroll, 1962; Lasswell, 1968;
.
Becker, 1970; Russet, 1970 .
Given the lack of a universally understood defini-tion and measurement of factory focus, an interpre-tive case perspecinterpre-tive is appropriate for our study. First, large sample research based on perception of object reality assumes uniformity and reliability of secondary source knowledge. The practitioner litera-ture demonstrates the potential fallacy of that
as-Ž
sumption regarding focused manufacturing e.g.,
.
Harmon, 1992; Rommel et al., 1995 . Consequently, primary source methods are appropriate in the study of factory focus, consistent with long-standing views concerning the relevance of single-site field studies
ŽDonham, 1922; Lijphart, 1971, 1975 . Second, con-.
text dependence of an object or behavior in large sample studies may result in inferences that are
Ž
either simplistic or tautological Campbell, 1975;
.
Cronbach, 1975 . For Operations Management
re-Ž .
search, Hill et al. 1987 note such limitations of the large sample perspective. Finally, large sample re-search tends to increase reliability but may reduce
Ž .
the validity of the results Emory, 1985, pp. 94–98 , an unavoidable roadblock in studying this topic. Interpretive research, on the other hand, can success-fully investigate specific phenomenon through in-de-pth studies.
We view this case study as a theory testing case
Ž .
study, following the typology of Yin 1984 , since this research generates its propositions from theory and then empirically tests them. We fulfil the critical requirement for a single-site study, because we for-mulate the explanations for the case in terms of
Ž
general rather than idiographic variables Eckstein,
.
1975; George, 1979 . Further, because our units of analysis are production lines within a factory, the availability of several units within one case serves the research objective by allowing us to study sev-eral outcomes within a constrained case. We fol-lowed guidelines for theoretical site-selection by
Ž . Ž .
George 1979 and Eisenhardt 1989 . Through a survey of the literature and subsequent dialogue with company management through meetings and unstruc-tured interviews, we selected the flagship factory of the Copeland Corporation at Hartselle, AL as the
study site. We selected the site due to its experience with a successful focus and because it underwent a subsequent defocusing.1
4.2. EÕolution of focus at Copeland Hartselle
In 1979, Copeland established its 256,000 square feet flagship factory at Hartselle, AL at a cost of US$30 million to manufacture one million units annually of a new, high-efficiency, ‘CR’ model re-frigerant compressor. The company decided to serve the market with a few compressor models, assembled from multiple combinations of a few parts, produced in large batch sizes, using a minimum of factory complexity.
4.2.1. Initial focus: 1979–1985
Copeland divided the facility into two areas, ma-chining and assembly. Mama-chining carried out metal removal processes such as milling, turning, drilling, and grinding. The machine shop was the center of focus in its consumption of planning efforts and investment. The shop had seven machining lines,
Ž .
which we designate as ML1 Machining Line 1 through ML7, with one line, ML3, having two sub-ordinate lines designated ML3a and ML3b. The manufacturing task of this shop was to excel in high volume, high precision machining of a narrow mix of components, with the goal of attaining the world’s best cost position. The plant implemented this focus successfully and the machine shop became a show-piece for the company in the early 1980s.
The assembly lines assembled machined and pur-chased parts to form a complete compressor. The operations comprise several fastening, fitting, weld-ing, and brazing processes. Out of a total of eight assembly lines, four lines built sub-assemblies, which
Ž .
we designate as AL1 Assembly Line 1 , AL2, AL3, and AL4. The other four lines are main assembly lines, which we designate as AL5, AL6, AL7 and AL8. The manufacturing task of the assembly shop
1
was to build end-product variety through multiple combinations of the relatively few basic components. Accordingly, the assembly lines had much lower set-up times and many more manual operations com-pared to the machine shop lines.
Consistent with the dimensions of focus that we summarized in Table 1, we depict the complemen-tary nature of the choices through the multidimen-sional focus map of Fig. 2. Along each dimension of Fig. 2, a point closer to the center represents greater uniformity of demands. The chosen response vectors of a factory describe the extent of focus at the factory. Hartselle, in its initial years, was a tightly focused factory, as shown in the interior line of Fig. 2. The factory and, in particular, the machine shop as the center of focus, had positions close to the center of the figure along all dimensions. The plant pro-duced a narrow part mix. On the process dimension, Hartselle chose not to manufacture several parts that required a manufacturing technology other than high precision machining. The factory produced its ma-chined components only in high volumes. The fac-tory also had tight focus along the customer and geographic dimensions. The factory served only a few market niches for compressors, namely, domes-tic air-conditioning and commercial refrigeration, mostly within the continental United States. The factory also developed a limited set of suppliers for its stable set of parts and material requirements. In turn, Copeland management tailored the infrastruc-tural system of the factory to carry out the focused
Ž
task Hayes and Wheelwright, 1984, discuss
struc-.
tural and infrastructural systems . Product design modifications made parts amenable to high volume production. The focus on long production runs of high volume, high precision components on dedi-cated machines also gave rise to specific batching and scheduling guidelines, accompanying off-line quality assurance systems, and specific procedures of other infrastructural elements like maintenance and material handling.
The advantages of Hartselle’s initial focus stem from pursuing scale and scope of production, as well as reducing complexity. Relevant benefits due to the scale of production include achieving cost reduction, taking advantage of declining average costs on the high-volume end of a volume-split, and reducing average costs by tailoring the infrastructure to
con-centrate on the machining processes. Next, focusing on limited operating ranges including a limited num-ber of products reduced the chances of diseconomies of scope and scale. Finally, lower environmental, technological, and organizational complexity led to reduced coordination costs. With the focused factory fully operating, Copeland transformed itself from an industry follower to the undisputed industry leader.
At the same time, the initial focus at Hartselle created several risks. These risks include avoiding tasks other than cost reduction through the pursuit of scale; experiencing diseconomies of scale due to continued focus on high-volume beyond a certain limit; potential diseconomies of scope if the plant was required to proliferate its product portfolio; cur-tailing the ability to manage complexity due to the insistence on reducing it; and, a potential lapse of managerial discipline to avoid profitable markets, customers, or geographic regions in order to retain the focus of the factory. These risks created potential performance problems as the manufacturing require-ments changed during the second half of the 1980s.
4.2.2. Change in manufacturing requirements:
1985–1990
Market pressure for broader product lines and customized modifications coupled with Copeland’s aggressive marketing strategy gradually necessitated that the company defocus the Hartselle product line. This study covers a period between 1985 and 1990, when end products proliferated considerably, al-though the machined components proliferated little. Minor model changes also occurred through the in-troduction of a new compressor, the CR4. Within the Copeland system, the number of bills of material
ŽBOM measures product variety. Bills of material.
Fig. 3. Product proliferation of end product, the 17-Digit CR, 1985–1990.
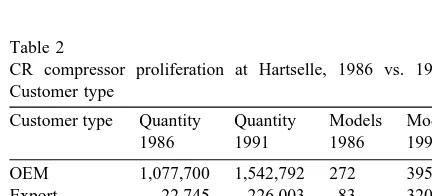
In addition to the change in the number of prod-ucts shown in Fig. 3, changes also occurred along other determinants of focus. For example, Table 2 compares the quantities and the number of final product models sold along the ‘‘customer type’’ focusing dimension in 1986 vs. 1991. While detailed data similar to those pertaining to number of prod-ucts and customer type are not available for each focusing dimension, discussions with management suggest the a focus map as shown in Fig. 2 depicts the evolution of focus at Hartselle over a ten year period, reporting focus positions for 1987 and 1991. Defocusing activities along the dimensions include product proliferation, modification in process tech-nology, expansion of customer base and geographi-cal reach, heterogeneity of production volume, and broadening of the supplier base. This multidimen-sional perspective on factory focus is important
be-Table 2
CR compressor proliferation at Hartselle, 1986 vs. 1991, by Customer type
Customer type Quantity Quantity Models Models
1986 1991 1986 1991
OEM 1,077,700 1,542,792 272 395
Export 22,745 226,003 83 320
Wholesaler 68,400 96,439 46 51
Subsidiary 6459 16,449 40 65
Total domestic 1,146,100 1,639,231 318 446
Total export 29,204 242,452 123 385
Total 1,175,304 1,881,683 441 831
cause we found that management’s initial perception of focus tended to concentrate on the product dimen-sion, consistent with much of the writing in the literature about focus. This emphasis on a single dimension increased the chance that unexpected problems would arise during the defocusing period.
To summarize, the initial meetings with the cor-porate and plant management showed that the site suited the study, due to its experience with an initial focus and a subsequent defocus. The presence of 16 production lines in two different areas, machining and assembly, provide an opportunity to look for robust inferences.
5. Research hypotheses
In this section, we define operational criteria for production line focus and propose empirical hy-potheses concerning changes that occur at the pro-duction lines of a factory.
5.1. Production line focus criteria
deter-minant at the factory level for every firm in every industry. We use an approach based on the literature and site-relevant criteria that we believe is applicable to many discrete manufacturing environments.
Ž .
First, we draw upon Pesch and Schroeder 1996 to determine our production line focus criteria. Pesch and Schroeder use five criteria to measure factory
Ž .
focus. The criteria include 1 a clearly defined plant
Ž .
priority; 2 congruence between plant priority and
Ž .
business strategy; 3 consistency of internal decision
Ž .
making within a plant; 4 compatible volume levels
Ž .
among products; and 5 compatible manufacturing requirements among products, where requirements include tolerance, yields, cleanliness, labor skill, and custom specials.
We examine the implications of these criteria of factory focus at the production line level, emphasiz-ing criteria 4 and 5. We believe that the first two criteria, concerning plant priority and congruence with strategy, are plant-level criteria that do not change cross-sectionally or temporally at production lines of a single plant. We expect that the variation in the third criterion, concerning internal decision making consistency across production lines of the same plant, will be much smaller than the variation in this criterion across plants of different companies, since in the former case, lines will be making deci-sions within identical boundaries set at the plant level. Further, any change in decision making will likely be unidirectional towards a gradual defocusing
ŽHayes and Clark, 1985; Hill, 1989, p. 110 , and can.
be represented by the inclusion of a time variable in an empirical model.
We concentrate on the last two criteria that Pesch
Ž .
and Schroeder 1996 use. Corresponding to the fourth criterion, which is compatible volume levels among products of a factory, we use the heterogene-ity of part volumes at a production line. Limiting the heterogeneity of volumes is one way to limit the demands placed on a production line. A production line can produce the same number of parts in large, medium, or small volumes. Uniformity of batch sizes may help a production line adopt the economically and technologically appropriate elements such as tooling, jigs and fixtures, material handling systems, production planning and quality control systems, and work routines. Heterogeneity of volumes stretches the designed capabilities of these elements. Two
compressor manufacturing plants of Copeland at Al-abama and North Carolina exemplify successful fo-cusing of these elements on large only and small
Ž .
only batches respectively March and Garvin, 1986 . To adopt the fifth dimension of Pesch and
Ž .
Schroeder 1996 , we use part mix to measure com-patibility in manufacturing requirements among products. This usage is consistent with Pesch and Schroeder’s subsequent finding that the ‘number of product lines’ has a strong, positive and significant correlation with their degree-of-focus score. Further, while the number of products at the factory level provides only limited information about the extent to which these products place different demands on the system, the number of parts on a production line may capture much more adequately the variations placed on the line. A new part on a given line often indicates change of a rather limited nature, mostly on values of design dimensions and processing parame-ters. For example, on a gear-shaping line producing two gears, the addition of a third part-number will typically indicate another gear that goes through the same shaping operations in the same sequence as the other two, with changes only in process parameter values. Thus, our operationalization of production line focus is consistent with Pesch and Schroeder’s characterization of factory focus.
Next, we position our two focus criteria of pro-duction volume heterogeneity and number of part numbers by examining the related series of articles
Ž . Ž .
by Bozarth 1993 , Bozarth and Edwards 1997 , and
Ž .
Berry and Bozarth 1997 . The series provides three
Ž .
dimensions of focus, including 1 market require-ments focus arising out of business strategy or
prod-Ž .
uct requirement; 2 manufacturing characteristics
Ž
focus comprising manufacturing similarity similar-ity in production volumes, equipment, labor skills,
. Ž .
prod-Ž .
uct mix, which Bozarth and Edwards 1997 use as one measure of their market requirements dimension. Our other criterion, volume heterogeneity, reflects a change that occurs at the line level along their manufacturing characteristic dimension. Of the di-mensions of manufacturing similarity that this series of articles use, the major changes that arise between different parts that are manufactured on a production
Ž
line in our study for example, between three
differ-.
ent bearings are production volumes, rather than equipment, labor skills, or set up.
Table 3 summarizes this discussion. The second column of the table lists several controlling determi-nants for each focusing dimension that we listed in Table 1. These are similar to what the above-men-tioned researchers refer to as ‘market requirements’ at the factory level. The third column of Table 3 then lists, for each controlling determinant, production line level implications for the two measures of pro-duction line focus.
Our intent here is to demonstrate that volume heterogeneity and part mix at the production line
Table 3
Controlling determinants and production line implications of focus at Hartselle
Focusing dimension Controlling determinant Production line implications for part mix and volume heterogeneity
Ž .
Product Product-mix width Kotler, 1994, pp. 434–435 aof parts on most lines
Ž .
Product line depth Kotler, 1994, pp. 434–435 aof parts on most lines
Ž .
Product feature variety McDuffie et al., 1996 aof parts on some lines
Ž .
Product attribute variety Anderson, 1995 aof parts on some lines
Product customization aof parts on some lines
Packaging variety aof parts on packaging lines
Product-life cycle stages aof parts on most lines
Process Process life cycle stages Part numbers, Volume heterogeneity
Number of different technologies New parts Nature of difference in technology –
Materials processed Parts on some lines
MarketrCustomer Segments Number of customers Likely volume heterogeneity Relative size of customers Likely volume heterogeneity
Product application New part numbers
Delivery requirements Volume heterogeneity
a
Inspection requirements Part numbers with specific instructions
a
Conformance specifications Part numbers with specific instructions
Market segments New part numbers
Geographic Market Region Distribution area Volume heterogeneity downstream
a
Technological standards Additional partsrinstructions on some lines
a
Regulatory differences Additional partsrinstructions on some lines
Delivery requirements Volume heterogeneity downstream
a
Shipping requirements Partsrinstructions on downstream lines
a
Packaging requirements Partsrinstructions on downstream lines
Lead time Volume heterogeneity downstream
Volume Range of order sizes Volume heterogeneity on most lines
Delivery lot sizes for blanket orders Volume heterogeneity on some lines Allowable disruptions of production runs Volume heterogeneity on all lines
b
Suppliers Procurement area, number of suppliers Volume heterogeneity upstream
Supplier size range Volume heterogeneity upstream
Incoming inspection requirements and
Ž .
relationship mode Shapiro, 1985 –
a Ž
Typically, a factory has its own system to record the instructions in the form of a traceable document for example, a route sheet, or a
.
standard operating procedure . This document, sometimes based on an alphanumeric extension of the relevant part number, can be counted as a separate part number for our purpose.
b
level associate with variations of many controlling determinants of focus at the factory level. Clearly, there may be other variables to control in limiting the demands at the production line level. Nonethe-less, although our list is not exhaustive, the measures apply to many manufacturing situations. We believe that the measures are appropriate for this study and many others. Overall, the references cited and the literature in general suggest that part mix and vol-ume heterogeneity are two important dimensions of tracking manufacturing requirements at the produc-tion line level.
5.2. Hypotheses
We propose two sets of hypotheses that link change of manufacturing requirements with perfor-mance of the production lines. We concentrate on the change in requirements from the prior focused period to the new period of defocused requirements, be-cause absorptive capacity is also a function of the prior requirement. To the extent that absorptive ca-pacity is also a function of the recipient, that is, the production line, we include this aspect in our later empirical model building. However, this latter aspect is not what we are examining, and hence, is not a part of the hypotheses.
Copeland designed the machining lines with a focus on excelling in producing a narrow part mix in large volumes. The company designed the assembly and sub-assembly lines with the intent of producing multiple products through multiple combinations of a few components.
In terms of the volumes in which they processed the parts, the machining lines experienced a gradu-ally increasing mix of large and small batch sizes over the period of the study, thereby increasing the heterogeneity of part volumes. At the same time, in assembly, product-variety increased and the volumes in which some of the products were assembled de-creased, increasing volume heterogeneity. Given that heterogeneity was a new task for the lines in both shops, we expect that the performance of the lines declines when its focus weakens due to increased the heterogeneity of monthly part-volumes. We propose the following hypotheses for each production line.
H1A: The greater the part volume heterogeneity processed by a machining line or assembly line, the lower the line’s performance.
The next hypothesis addresses linkages between production lines. Following the prescription of
Skin-Ž .
ner 1974 , in a focused factory such as Hartselle, the thrust in tailoring is on the configuration of the infrastructural elements to make them consistent with each other and with a system-level deliverable. The span of these elements remains system-wide, across the factory. The production lines of the factory, subject to a common material and information flow and joined by the same infrastructure, may constitute
Ž
subsystems of a richly joined system Ashby and
.
Ross, 1960; Simon, 1969; Perrow, 1984 . The inter-esting property of such systems is that interaction between subsystems is stronger than interactions within each subsystem. Consequently, the change of requirement at a line may be either an explicit change at the line or an indirect result of an change at an interrelated line. An explicit change at an assembly line may lead to an indirect change in the demands on a connected upstream machining line, due to greater complexity and variation in compo-nent demand. Such an effect is of great interest, because management may mistakenly act as if the task of the machining lines has not changed, since their sets of components remain unchanged. We propose the following hypothesis.2
H1B: The greater the part mix breadth processed by an assembly line, the lower the performance of a corresponding upstream machining line.
In terms of part-mix on a given line in the ma-chine shop, while the part mix produced usually changed from month-to-month, it did so within a
2
()
A.
Mukherjee
et
al.
r
Journal
of
Operations
Management
18
2000
139
–
168
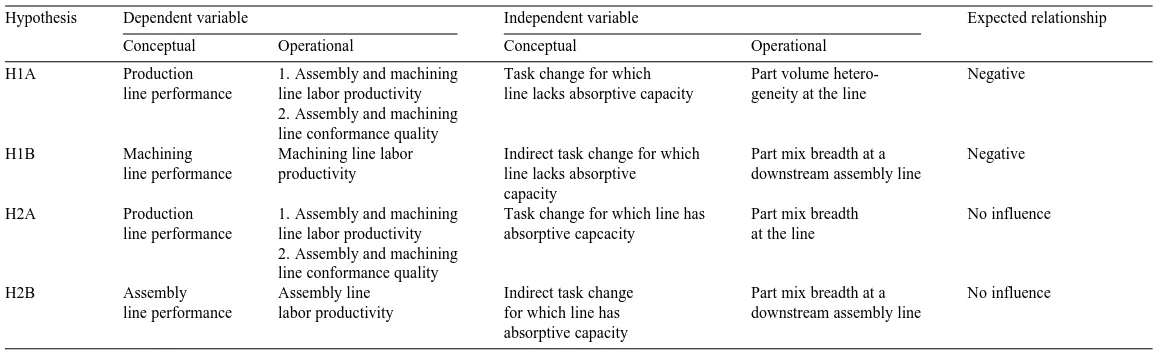
Table 4
Conceptual and operational variables
Hypothesis Dependent variable Independent variable Expected relationship
Conceptual Operational Conceptual Operational
H1A Production 1. Assembly and machining Task change for which Part volume hetero- Negative
line performance line labor productivity line lacks absorptive capacity geneity at the line 2. Assembly and machining
line conformance quality
H1B Machining Machining line labor Indirect task change for which Part mix breadth at a Negative line performance productivity line lacks absorptive downstream assembly line
capacity
H2A Production 1. Assembly and machining Task change for which line has Part mix breadth No influence line performance line labor productivity absorptive capcacity at the line
2. Assembly and machining line conformance quality
H2B Assembly Assembly line Indirect task change Part mix breadth at a No influence
given narrow superset of parts. Thus, the focused set of parts that a production line started with did not change. This is a type of temporal change in require-ments for which machining lines possessed the ab-sorptive capacity as a function of their requirements in the prior period, and should adapt to easily. Next, in the assembly shop, the focus of the lines was on producing a high variety of products. Over time, while product-variety increased, this high product variety was not a new task for the assembly lines. Accordingly, we expect that the performance of the assembly lines does not change with a change in the part mix. Further, given the initial task of meeting the requirement of high end-product variety, assem-bly lines can adapt well to the proliferation of the end product, which is their downstream product. Formally, we propose the following hypotheses for each line.
H2A: Greater part-mix breadth processed by a machining line or assembly line has no influence on the line’s performance.
H2B: Greater part-mix breadth processed by an assembly line has no influence on the performance of a corresponding upstream assembly line.
Table 4 summarizes the conceptual and opera-tional dependent and independent variables for the propositions and hypotheses. Because of the formula-tion of the hypotheses, the rejecformula-tion criterion for hypotheses H1A and H1B is the lack of statistically significant support. Conversely, the rejection crite-rion for hypothesis H2A and H2B is the presence of sufficient statistically significant contradictory evi-dence.
In conclusion, this section presents two sets of hypotheses. The predictions correspond to the two propositions and suggest that the performance of focused production lines will decline only when the lines adopt new manufacturing requirements that are outside the scope of the absorptive capacity devel-oped through the execution of their prior manufactur-ing requirements. The hypotheses address direct changes occurring at the machining lines and the assembly lines, as well as indirect changes occurring at interrelated downstream production lines. For hy-pothesis testing, the generalizable variables are spe-cific to the case in their operationalization. In the next section, we describe the empirical methods and results.
6. Empirical methods and results
This section first describes the models we used to test the hypotheses. We then discuss the statistical estimation procedures and the data used for testing. Finally, we present the empirical results and discuss their implications.
6.1. Model and estimation procedure
Empirically testing the hypotheses involves exam-ining relationships across several production lines between the variables over time. We expect that the relationships will vary across the production lines, but not over time at a given line. The conditions of time-invariance and unit-variance make the test equivalent to postulating a separate regression for
Ž .
each unit Hsaio, 1985, pp. 128–153 . Accordingly, at each line, we first propose the following general model for production line performance.
PerformancetsB0qB1logTqB2MixtqB3Hett
qB4NextMixtq1qet
Ž
for thetyth observation of time
.
Ž .
1where e is the residual term of the regression, B0 ist
the intercept, and B1, B2, B3, and B4 are multiple time-series regression coefficients. The independent variables have the following definitions.
Ž .
LogT : The base-10 logarithm of time T . We expect that, in addition to the focus variables of our interest, the learning that takes place at a line over time will influence absorptive capacity and perfor-mance. Consistent with the logarithmic nature of the learning curve, we represent the time variable in logarithmic form.
Mix : The part mix processed at a line at time t,t
as we discussed in Section 5.
Het : The heterogeneity of volumes of productst
processed at a line at time t, as we discussed in Section 5.
NextMixtq1 : The part mix processed at the downstream line at time tq1. We use a lead-time variable to represent the production lead-times within the facility.
()
A.
Mukherjee
et
al.
r
Journal
of
Operations
Management
18
2000
139
–
168
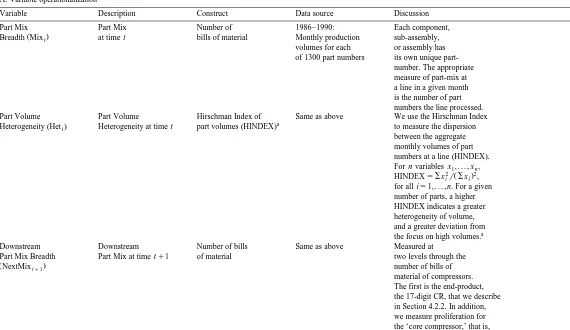
Table 5
A. Variable operationalization
Variable Description Construct Data source Discussion
Part Mix Part Mix Number of 1986–1990: Each component,
Ž .
Breadth Mixt at time t bills of material Monthly production sub-assembly,
volumes for each or assembly has of 1300 part numbers its own unique
part-number. The appropriate measure of part-mix at a line in a given month is the number of part numbers the line processed.
Part Volume Part Volume Hirschman Index of Same as above We use the Hirschman Index
a
Ž . Ž .
Heterogeneity Hett Heterogeneity at time t part volumes HINDEX to measure the dispersion
between the aggregate monthly volumes of part
Ž .
numbers at a line HINDEX . For n variables x , . . . , x ,1 n
2 Ž .2
HINDEXsSxirSxi , for all is1, . . . , n. For a given number of parts, a higher HINDEX indicates a greater heterogeneity of volume, and a greater deviation from
a
the focus on high volumes.
Downstream Downstream Number of bills Same as above Measured at
Part Mix Breadth Part Mix at time tq1 of material two levels through the
ŽNextMixtq1. number of bills of
()
A.
Mukherjee
et
al.
r
Journal
of
Operations
Management
18
2000
139
–
168
155
and electrical components. The core compressor is tracked as the ‘13-digit CR’ within the Copeland system. The core compressor is the downstream product for all machining lines and three sub-assembly lines, while the end-product is the downstream product for one sub-assembly line and all but one assembly line. The exception is the one assembly line that packages the final product.
Labor Productivity Labor Productivity Direct labor 1986–1990: Measured through labor
ŽLaborProductivityt. at time t hours per unit Actual direct hours per unit produced.
labor hours by month Labor-hour data is available by cost center, and by production line since work standards production line is a cost center. Labor hour per unit is the ratio of monthly labor hours to monthly aggregate volume for each production line. Higher labor-hours per unit indicate a lower productivity.
Conformance Conformance Quality Scrap treatment 1986–1988: Scrap treatment labor
Ž
Quality Internal Failure hours per Actual hours hours per unit of good
b
ŽConformancet. Cost. unit output by month product provide an indirect
Ž
measure data on actual quality performance are
b .
limited . This is consistent with Juran’s discussion of internal failure as a component of the cost of quality
ŽJuran, 1979 . A higher.
()
A.
Mukherjee
et
al.
r
Journal
of
Operations
Management
18
2000
139
–
168
Ž .
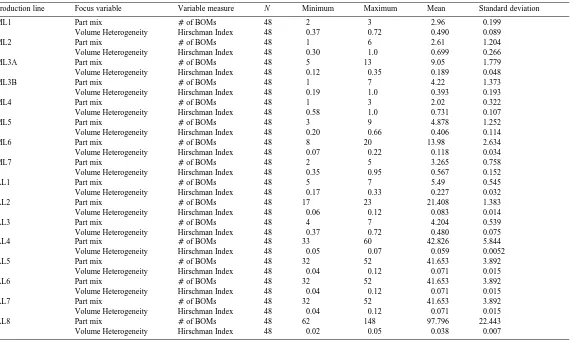
Table 5 continued B. Descriptive statistics
Production line Focus variable Variable measure N Minimum Maximum Mean Standard deviation
ML1 Part mix aof BOMs 48 2 3 2.96 0.199
Volume Heterogeneity Hirschman Index 48 0.37 0.72 0.490 0.089
ML2 Part mix aof BOMs 48 1 6 2.61 1.204
Volume Heterogeneity Hirschman Index 48 0.30 1.0 0.699 0.266
ML3A Part mix aof BOMs 48 5 13 9.05 1.779
Volume Heterogeneity Hirschman Index 48 0.12 0.35 0.189 0.048
ML3B Part mix aof BOMs 48 1 7 4.22 1.373
Volume Heterogeneity Hirschman Index 48 0.19 1.0 0.393 0.193
ML4 Part mix aof BOMs 48 1 3 2.02 0.322
Volume Heterogeneity Hirschman Index 48 0.58 1.0 0.731 0.107
ML5 Part mix aof BOMs 48 3 9 4.878 1.252
Volume Heterogeneity Hirschman Index 48 0.20 0.66 0.406 0.114
ML6 Part mix aof BOMs 48 8 20 13.98 2.634
Volume Heterogeneity Hirschman Index 48 0.07 0.22 0.118 0.034
ML7 Part mix aof BOMs 48 2 5 3.265 0.758
Volume Heterogeneity Hirschman Index 48 0.35 0.95 0.567 0.152
AL1 Part mix aof BOMs 48 5 7 5.49 0.545
Volume Heterogeneity Hirschman Index 48 0.17 0.33 0.227 0.032
AL2 Part mix aof BOMs 48 17 23 21.408 1.383
Volume Heterogeneity Hirschman Index 48 0.06 0.12 0.083 0.014
AL3 Part mix aof BOMs 48 4 7 4.204 0.539
Volume Heterogeneity Hirschman Index 48 0.37 0.72 0.480 0.075
AL4 Part mix aof BOMs 48 33 60 42.826 5.844
Volume Heterogeneity Hirschman Index 48 0.05 0.07 0.059 0.0052
AL5 Part mix aof BOMs 48 32 52 41.653 3.892
Volume Heterogeneity Hirschman Index 48 0.04 0.12 0.071 0.015
AL6 Part mix aof BOMs 48 32 52 41.653 3.892
Volume Heterogeneity Hirschman Index 48 0.04 0.12 0.071 0.015
AL7 Part mix aof BOMs 48 32 52 41.653 3.892
Volume Heterogeneity Hirschman Index 48 0.04 0.12 0.071 0.015
AL8 Part mix aof BOMs 48 62 148 97.796 22.443
Volume Heterogeneity Hirschman Index 48 0.02 0.05 0.038 0.007
a
We find volume heterogeneity being measured only indirectly using perceptual Likert-Type scales in the Operations Management literature. Our search for a direct
Ž .
measurement leads us to other literature where we find the Hirschman Index to be a popular measure of this construct Scherer and Ross, 1990 . The symbolic expression is
Ž .
adapted from Tirole 1989 , pp. 221–222.
b
static and dynamic. The static recipient component represents time-invariant properties of a production line that affect the line’s ability to adapt to a change in requirement. The intercept term B0 will capture the static component. The B1 term captures the dynamic recipient, as we explained above in connec-tion with the logT variable. We expect that includ-ing these aspects of absorptive capacity in the model will generate better estimates of the effects we are interested in.
We estimate the two equations separately for each production line. We then use the consistency of patterns of a regression coefficient across production lines as the basis for inferences about hypotheses.
We undertake the following three steps for each
Ž .
equation. First, we estimate Eq. 1 using time-series production data for machining line ML1. We esti-mate the full model rather than making any auto-matic selection. Since we are testing with time-series data, we test for auto-correlation during each esti-mate using the Durbin–Watson d-statistic and resid-ual plots. Where auto-correlation is present, we use time-series transformation of the data using first differences, re-estimate the equation, and again test for auto-correlation as above. Consistent with many time-series analyses, first differencing removes auto-correlation in our testing. Second, we repeat the
Ž .
above procedure 16 times to estimate Eq. 1 sepa-rately for all 16 production lines.
Third, we examine the cross-sectional consistency of sign and significance of each regression coeffi-cient to draw inferences. This approach to testing with longitudinal data borrows strengths across units of analysis and, consequently, can make inferences more robust than those from single time series data
ŽDiggle et al., 1994, pp. 2–22 . The magnitude of the.
coefficients at the site can vary widely across pro-duction lines since different lines make different products using different nominal unit labor hours. Therefore, we use the standardized rather than non-standardized regression coefficients for better com-parability across production lines.
6.2. Data and measurement ofÕariables
This case study is consistent with several others
ŽMintzberg and McHugh, 1985; Sutton and Callahan, .
1987; Eisenhardt and Bourgeois, 1988 in its seeking
both quantitative and qualitative evidence. We re-trieved the quantitative data from company records. Table 5A and B summarize the measurement and data sources of the variables that we used to test hypothesis sets H1 and H2.
We first address the production line focus vari-ables. Consistent with our discussion of the variables in Section 5, we measure the part-mix at a produc-tion line through the number of parts. We capture volume heterogeneity through the dispersion be-tween the several aggregate monthly volumes of the several part numbers at a line using the Hirschman
Ž .
Index HINDEX as a measure. Testing hypotheses H1B and H2B requires measuring focus variables at two levels. Table 5A contains the details of measure-ments and data sources.
We operationalize production line performance in terms of labor productivity and conformance quality. The traditional measurement of labor productivity reflects the efficiency of the transformation process occurring at a production line. Changes in the execu-tion of the transformaexecu-tion process may result in new or modified routines that are outside the repertoire of routines that a production line can execute without conscious overview. Change can, therefore, slow the pace of execution of routines at a production line. Further, change can also lead to a mismatch between the task information needs and the information pro-cessing abilities of the line. A production line may absorb the additional task information needs by un-der-utilizing its resources, including labor resources
ŽGalbraith, 1977 . Therefore, labor productivity re-.
flects the efficiency with which members of a line execute their routines. This is also consistent with the use in the literature of non-deterioration in per-formance in the face of change as a measure of
Ž .
adaptability Upton, 1995 . We measure labor pro-ductivity using the units produced per direct labor hour.
Note that the dependent variable of our interest is the productivity of direct labor only. While we ex-pect that increasing part mix or volume heterogene-ity will have a detrimental effect on indirect labor performance as well, one can easily explain this an effect by factors such as increased set-ups and mate-rial handling. Such a finding would be obvious rather
Ž .
vari-able as sensitivity analysis, obtaining the expected results, but we do not report the results here.
Our second measure of production line perfor-mance is conforperfor-mance quality. When a change in task stretches the production routines, the executed routines may not conform to the designed ones. The effect of non-conforming routines of the transforma-tion process may be a less than desired quality of the process itself. A production line may also absorb a mismatch between task information needs and infor-mation processing capabilities by not meeting the additional task need fully, and thereby, by not con-forming to the design of the task. An indicator of the quality of the process is the conformance quality of the parts produced by the process. We use a surro-gate measure of conformance quality, measuring the cost of rework and rejects within the facility.
Ž .
We estimate full model 1 when productivity is the dependent variable. However, the data limitations we noted in Table 5A lead us to estimate a simpli-fied model of the following form when conformance quality is the dependent variable.
Conformancet
sB5qB6MixtqB7Hettqe , . . .t
=
Ž
for the tyth observation of time.
Ž .
2Ž .
The Mix and Het terms in Eq. 2 are equivalentt t Ž .
to those that we explained for Eq. 1 . Among the coefficients, B5 is the intercept, while B6 and B7 are
Ž .
regression coefficients. A comparison of Eq. 1 with
Ž .
Eq. 2 indicates that we can test hypotheses 1A and 1B with both the dependent variables, but hypotheses 2A and 2B with productivity variables only.
Table 5B presents the descriptive statistics. All of the variables exhibit variation, while the degree of variation changing from line to line. To reflect the
operational realities of the site, we use two simple data transformations. First, given that our data is on a monthly basis, we account for production lead-times of about two to three weeks by assuming that of the products that a line finished in a given month, pro-duction of half of them started in the previous month and the production of the other half started in the current month. Second, to mitigate the effects of end-of-the-month pushes to meet production targets, we use a moving average of labor productivity.
We estimate 16 time-series equations for labor productivity and 14 equations for conformance qual-ity. Separately for the two dependent variables, we then seek robustness by comparing regression coeffi-cients for each independent variable across produc-tion lines. Subsequently, we conducted unstructured interviews with managers, supervisors, and manufac-turing support staff in order to verify our model and to learn more about the implications of the empirical results. In the next section, we present and discuss the results of testing the hypotheses in the order proposed.
6.3. Hypotheses testing: results and discussion
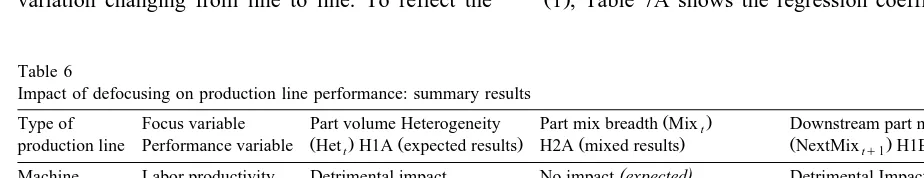
Table 6 summarizes the results of estimating a total of 30 time-series equations. The results provide reasonable support for H1A and H1B, with mixed support for H2A and H2B.
6.3.1. Results
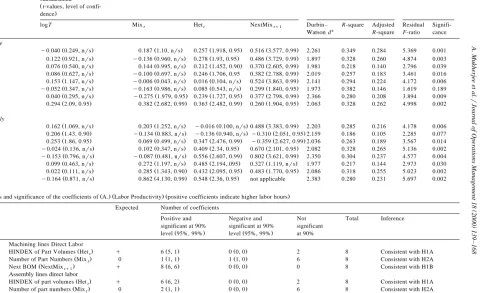
Two tables report the detailed results of
estimat-Ž . Ž .
ing Eqs. 1 and 2 . Table 7A presents results of the labor productivity analysis. We summarize the re-sults of Table 7A in B. For each estimation of Eq.
Ž .1 , Table 7A shows the regression coefficients and
Table 6
Impact of defocusing on production line performance: summary results
Ž .
Type of Focus variable Part volume Heterogeneity Part mix breadth Mixt Downstream part mix breadth
Ž . Ž . Ž . Ž .
production line Performance variable Hett H1A expected results H2A mixed results NextMixtq1 H1B, H2B
( )
Machine Labor productivity Detrimental impact No impact expected Detrimental Impact (H1B, expected)
( )
Conformance quality Detrimental impact Detrimental impact unexpected Not tested
( )
Assembly Labor productivity Detrimental impact No impact expected Mixed Impact (H2B, mixed)
( )
()
A.
Mukherjee
et
al.
r
Journal
of
Operations
Management
18
2000
139
–
168
159
Labor hours per unit Regression coefficients, Model summary Analysis of variance standardized
Žt-values, level of
confi-. dence
logT Mixt Hett NextMixtq1 Durbin – R-square Adjusted Residual Signifi-a
Watson d R-square F-ratio cance
Machine
Ž . Ž . Ž . Ž .
ML1 y0.040 0.249, nrs 0.187 1.10, nrs 0.257 1.918, 0.95 0.516 3.577, 0.99 2.261 0.349 0.284 5.369 0.001
Ž . Ž . Ž . Ž .
ML2 0.122 0.921, nrs y0.136 0.960, nrs 0.278 1.93, 0.95 0.486 3.729, 0.99 1.897 0.328 0.260 4.874 0.003
Ž . Ž . Ž . Ž .
ML3a 0.076 0.540, nrs 0.144 0.995, nrs 0.212 1.452, 0.90 0.370 2.605, 0.99 1.981 0.218 0.140 2.796 0.039
Ž . Ž . Ž Ž .
ML3b 0.086 0.627, nrs y0.100 0.697, nrs 0.246 1.706, 0.95 0.382 2.788, 0.99 2.019 0.257 0.183 3.461 0.016
Ž . Ž . Ž . Ž .
ML4 0.153 1.147, nrs y0.006 0.043, nrs 0.016 0.104, nrs 0.524 3.863, 0.99 2.141 0.294 0.224 4.172 0.006
Ž . Ž . Ž . Ž .
ML5 y0.052 0.347, nrs y0.163 0.986, nrs 0.085 0.543, nrs 0.299 1.840, 0.95 1.973 0.382 0.146 1.619 0.189
Ž . Ž . Ž . Ž .
ML6 0.040 0.295, nrs y0.275 1.979, 0.95 0.239 1.727, 0.95 0.377 2.798, 0.99 2.366 0.280 0.208 3.894 0.009
Ž . Ž . Ž . Ž .
ML7 0.294 2.09, 0.95 0.382 2.682, 0.99 0.363 2.482, 0.99 0.260 1.904, 0.95 2.063 0.328 0.262 4.998 0.002
Assembly
Ž . Ž . Ž . Ž .
AL1 0.162 1.069, nrs 0.203 1.252, nrs y0.016 0.100, nrs 0.488 3.383, 0.99 2.203 0.285 0.216 4.178 0.006
Ž . Ž . Ž . Ž .
AL2 0.206 1.43, 0.90 y0.134 0.883, nrs y0.136 0.940, nrs y0.310 2.051, 0.95 2.159 0.186 0.105 2.285 0.077
Ž . Ž . Ž . Ž .
AL3 0.253 1.86, 0.95 0.069 0.499, nrs 0.347 2.476, 0.99 y0.359 2.627, 0.99 2.036 0.263 0.189 3.567 0.014
Ž . Ž . Ž . Ž .
AL4 y0.024 0.136, nrs 0.102 0.347, nrs 0.409 2.34, 0.95 0.670 2.101, 0.95 2.082 0.328 0.265 5.136 0.002
Ž . Ž . Ž . Ž .
AL5 y0.153 0.796, nrs y0.087 0.481, nrs 0.556 2.607, 0.99 0.802 3.621, 0.99 2.350 0.304 0.237 4.577 0.004
Ž . Ž . Ž . Ž .
AL6 0.099 0.463, nrs 0.272 1.197, nrs 0.485 2.194,.095 0.327 1.119, nrs 1.977 0.217 0.144 2.973 0.030
Ž . Ž . Ž . Ž .
AL7 0.022 0.111, nrs 0.285 1.343, 0.90 0.432 2.095, 0.95 0.483 1.770, 0.95 2.086 0.318 0.255 5.023 0.002
Ž . Ž . Ž .
AL8 y0.164 0.871, nrs 0.862 4.130, 0.99 0.548 2.36, 0.95 not applicable 2.383 0.280 0.231 5.697 0.002
Ž . Ž . Ž .
B. Signs and significance of the coefficients of A. Labor Productivity positive coefficients indicate higher labor hours
Expected Number of coefficients
Positive and Negative and Not Total Inference significant at 90% significant at 90% significant
Ž . Ž .
level 95%, 99% level 95%, 99% at 90%
1 Machining lines Direct Labor
Ž . Ž . Ž .
1a HINDEX of Part Volumes Hett q 6 5, 1 0 0, 0 2 8 Consistent with H1A
Ž . Ž . Ž .
1b Number of Part Numbers Mixt 0 1 1, 1 1 1, 0 6 8 Consistent with H2A
Ž . Ž . Ž .
1c Next BOM NextMixtq1 q 8 6, 6 0 0, 0 0 8 Consistent with H1B 2 Assembly lines direct labor
Ž . Ž . Ž .
2a HINDEX of part volumes Hett q 6 6, 2 0 0, 0 2 8 Consistent with H1A
Ž . Ž . Ž .
2b Number of part numbers Mixt 0 2 1, 1 0 0, 0 6 8 Consistent with H2A
Ž . Ž . Ž .
2c Next BOM NextMixtq1 0 4 4, 2 2 2, 1 2 8 Inconsistent with H2B
Number of observationss45. nrs: not significant.
a Ž .