Summary The atmospheric hydrocarbon budget is impor-tant for predicting ozone episodes and the effects of pollution mitigation strategies. Isoprene emission from plants is an im-portant part of the atmospheric hydrocarbon budget. We meas-ured isoprene emission capacity at the bottom, middle, and top of the canopies of a white oak (Quercus alba L.) tree and a red oak (Quercus rubra L.) tree growing adjacent to a tower in the Duke University Forest. Leaves at the top of the white oak tree canopy had a three- to fivefold greater capacity for emitting isoprene than leaves at the bottom of the tree canopy. Isoprene emission rate increased with increasing temperature up to about 42 °C. We conclude that leaves at the top of the white oak tree canopy had higher isoprene emission rates because they were exposed to more sunlight, reduced water availability, and higher temperature than leaves at the bottom of the canopy. Between 35 and 40 °C, white oak photosynthesis and stomatal conductance declined, whereas red oak (Quercus rubra) pho-tosynthesis and stomatal conductance increased over this range. Red oak had lower rates of isoprene emission than white oak, perhaps reflecting the higher stomatal conductance that would keep leaves cool. The concentration of isoprene inside the leaf was estimated with a simplified form of the equation used to estimate CO2 inside leaves.
Keywords: isoprene, Quercus alba, Quercus rubra, red oak, temperature, white oak.
Introduction
Isoprene is the dominant hydrocarbon released by vegetation in most ecosystems (Guenther et al. 1994, Geron et al. 1994). Isoprene release by vegetation, particularly trees (Rasmussen 1970), exceeds anthropogenic hydrocarbon release to the at-mosphere (Lamb et al. 1987, 1993). Isoprene and other hydro-carbons can react to form ozone in sunlight when NOx is present (Trainer et al. 1987, Chameides et al. 1988, Thompson, 1992). Ozone causes respiratory distress and reduces crop and forest yields (Reich and Amundson 1985, Runeckles and Chevone 1992).
Isoprene emission rate is strongly affected by light and temperature (Sanadze and Kursanov 1966, Rasmussen and Jones 1973, Tingey et al. 1979, Monson and Fall 1989, Loreto and Sharkey 1990). In addition to short-term (up to 20 min) effects of light intensity on isoprene emission rates, leaves that develop in full sun emit isoprene at a higher rate than leaves that develop in shade (Sharkey et al. 1991, Harley et al. 1994). Carbon assimilated in photosynthesis rapidly appears in emit-ted isoprene (Delwiche and Sharkey 1993). Isoprene emission typically accounts for 2% of the carbon fixed in photosynthesis (Monson and Fall 1989, Loreto and Sharkey 1990) but in kudzu (Pueraria lobata (Willd.) Ohwi) it can account for over 50% of the carbon fixed in high light following water stress (Sharkey and Loreto 1993). Sharkey and Singsaas (1995) hy-pothesized that isoprene synthesis protects leaves against ther-mal stress that can occur when leaves are exposed to the radiant heat load of full sunlight, especially in fluctuating light envi-ronments.
Current methods for scaling from leaf-level measurements to canopy-scale fluxes of isoprene model the light and tem-perature dependence of isoprene emission (Geron et al., 1996). However, these models, particularly BEIS2 (revision of the Biogenic Emission Inventory System, see Pierce and Waldruff 1991), require many assumptions about how isoprene emission rate is affected by micrometeorological variables such as light, both instantaneous irradiance and irradiance during leaf devel-opment, and leaf temperature. Furthermore, it is not known whether a big leaf model (as opposed to a layered-canopy model) can give acceptably good fit to canopy flux measure-ments made by micrometeorological measuremeasure-ments, or how sophisticated leaf energy balance calculations must be to ob-tain reliable estimates of canopy isoprene flux from leaf-level measurements.
We have measured isoprene emission, photosynthesis, and stomatal conductance at three canopy levels in a white oak (Quercus alba L.) tree and a red oak (Quercus rubra L.) tree, including the topmost canopy leaves at a height of 30 m. Measurements were made in half and full sunlight at 30, 35 and, in some cases, 40 °C.
Field measurements of isoprene emission from trees in response to
temperature and light
THOMAS D. SHARKEY,
1ERIC L. SINGSAAS,
1PETER J. VANDERVEER
1and
CHRIS GERON
21
Department of Botany, 430 Lincoln Drive, University of Wisconsin, Madison, WI 53706, USA
2
National Risk Management Research Laboratory, U.S. Environmental Protection Agency, Research Triangle Park, NC 27711, USA
Received July 10, 1995
Materials and methods
Site description
The study was conducted at the Duke University Research Forest (35°58′25″ N and 79°06′05″ W) near Chapel Hill, North Carolina. The forest is a mature, second-growth uneven-aged stand with the oldest trees exceeding the age of 180 years. A 40-m walkup tower facilitated measurements within, and at the top of, the forest canopy (Geron et al. 1996).
Most measurements were made during June 23--25 and August 20--22, 1994. June was warm and dry, whereas August was relatively wet. In both months, there were substantial rains within 3 days of making the measurements and so the trees were not under water stress during the measurements, although the trees may have experienced water stress in the weeks leading up to the June measurements.
During both periods, measurements were made at three canopy levels. The leaf area index (LAI) measured with an LAI 2000 (Li-Cor, Inc., Lincoln, NE) was 4.1 at the bottom of the canopy and 3.0, 1.1 and 0.3 at canopy heights of 6, 20 and 30 m, respectively. The leaves sampled at a height of 30 m were not quite the highest in the canopy. The tower was not excluded from the field of view of the LAI 2000. Although the LAI determined by the LAI-2000 differs from the true LAI, it provides a measure of the relative shadiness of each location. Gas exchange measurements
Photosynthesis and stomatal conductance were measured with a prototype of the Li-Cor 6400 gas exchange measuring sys-tem. The light source was a light emitting diode with peak irradiance at 670 nm as recommended by Tennessen et al. (1995), who showed that red light has a negligible effect on measurements of photosynthesis and no effect on isoprene emission relative to xenon-arc lamp light (Tennessen et al. 1994). The air supply for the gas exchange system was drawn through a tube held about 3 m from the tower to avoid CO2 from investigator breath. Leaf temperature was controlled by thermoelectric modules that are part of the Li-Cor 6400 sys-tem. In addition, we used a heat gun to obtain the high tem-peratures required and to overcome the low power supply to the thermoelectric modules on the Li-Cor 6400. By directing the heat gun onto the gas exchange cuvette, we could change the leaf temperature by 5 °C in less than 2 min.
Isoprene measurements
Isoprene emission was measured by fitting a three-way valve to the output port of the Li-Cor 6400 cuvette. Gas flow leaving the cuvette was directed past a portable Scentoscreen gas chromatograph (Sentex, Ridgefield, NJ) except when required for matching the reference and measuring gas analyzers. The gas chromatograph had a small pump that pumped 20 ml of air leaving the leaf chamber through a small adsorbent tube con-taining Carbosieve B. To inject, the argon carrier gas flow was directed through the preconcentrator while it was heated with nichrome wire.
An argon ionization detector was used for detection. Tritium decay excites the argon carrier gas causing ionization of
hydro-carbons coming from the column. In the field, single point calibrations were made by mixing liquid isoprene in a 1-dm3 flask of N2 and mixing a small amount of that gas mixture in another 1-dm3 flask of N2 to give a 256 ppb standard. The accuracy of this method is limited by the accuracy of the gas-tight syringes. Over one month, the standard deviation was less than 5% of the mean calibration factor. When the standard was made up seven times in a row the standard deviation of the calibration factors was 4% of the mean. Most measurements were in the range of 50 to 300 ppb and the ambient isoprene concentration was 1--3 ppb. We have since discovered that making the standards in air gives a 5% lower detector response. We assume that standards in air are a better measure and so the values reported here have been corrected for this effect. After these measurements were completed we discovered that the Sentex gas chromatograph output was nonlinear. The non-linearity was extensively characterized by preparing and meas-uring several dilution series in the laboratory and comparing results with a Shimadzu gas chromatograph with photoioniza-tion detecphotoioniza-tion. The Shimadzu was linear across all diluphotoioniza-tions from 32 to 512 ppb isoprene giving us confidence that the dilution series were correctly prepared.
The rate of isoprene emission was calculated as the concen-tration of isoprene in the airstream multiplied by the flow rate, normally 250 µmol s−1. The Li-Cor 6400 cuvette encloses 6 cm2 of leaf.
Estimating isoprene concentration inside the leaf
We estimated the concentration of isoprene in the air phase in the leaf by equations originally developed for estimating the CO2 concentration inside leaves.
Ii= Ia+ 1.94(JI/g),
where Ii is the isoprene concentration inside the leaf, Ia is the isoprene concentration in the air outside the leaf, 1.94 is the square root of the ratio of molecular weights of isoprene to water, since diffusivity is related to the kinetic energy of a molecule, JI is the flux of isoprene from the leaf, and g is the conductance for water vapor. To estimate CO2 concentration inside leaves it is common practice to use the ratio of the mutual diffusion coefficients of CO2 in air and water in air which fortuitously is close to the square root of the ratio of molecular weights (von Caemmerer and Farquhar 1981). Be-cause the mutual diffusion coefficient of isoprene in air is not known, we resorted to the simpler formulation but recognize it may need correction in the future. Other effects that caused errors of 1 to 3% are not accounted for in our estimation of leaf isoprene concentration.
Dry weights
Leaf punches of approximately 1 cm2 were taken from the leaves used for isoprene emission rate measurements in June, dried at 60 °C for two days, and then weighed.
Xanthophyll and chlorophyll measurements
xantho-phylls were taken from leaves adjacent to the leaves used to measure isoprene emission rates. Adjacent leaves were used because we increased leaf temperature to the damage threshold for many leaves during the August measurements of isoprene emission rates. Leaf samples were extracted by grinding in acetone. The acetone extract from three grindings was com-bined for each sample. The extraction technique gave repro-ducible results despite the toughness of the oak leaves. Xanthophyll cycle intermediates, lutein, chlorophylls, and ca-rotenoids were quantified by HPLC on a special column (Zor-bax ODS non-endcapped 4.6 × 250 mm made by Dupont and supplied by MACMOD Analytical, Inc., Chadds Ford, PA) as described by Tennessen et al. (1995).
Results
In June, isoprene emission rates were high (Table 1) and increased with increasing temperature from 30 to 35 °C at irradiances of both 1000 and 2000 µmol m−2 s−1. The energies of activation determined over this temperature range by the Arrhenius equation were 68 and 55 kJ mol−1 at 1000 and 2000 µmol m−2 s−1, respectively. Although isoprene emission rates increased with increasing temperature from 30 to 35 °C, as-similation rates decreased. As a result, the proportion of pho-tosynthate being converted to isoprene almost doubled to nearly 8%. The decline in photosynthetic rate with increasing temperature was correlated with reduced stomatal conduc-tance and could be a consequence of stomatal closure. How-ever, stomatal closure does not affect isoprene emission rate because isoprene accumulates in the leaf until the flux is the same before and after stomatal closure (Fall and Monson 1992). The calculated isoprene concentration inside the leaf doubled between 30 and 35 °C. At both 30 and 35 °C, doubling the irradiance from 1000 to 2000 µmol m−2 s−1 increased rates of isoprene emission and photosynthesis by about 10%.
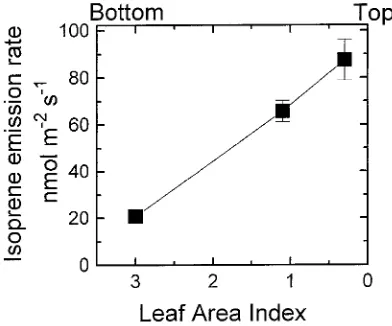
Under standard conditions of 1000 µmol m−2 s−1 and 30 °C, isoprene emission rates were over 4 times greater at the top of the canopy (LAI = 0.3) than near the bottom of the canopy
(LAI = 3.0) (Figure 1). Photosynthetic rates were 1.8 times greater at the top of the canopy than at the bottom of the canopy (data not shown). Leaf weight per leaf area was 52 and 133 g m−2 at the bottom and top of the canopy, respectively. Conse-quently, when isoprene emission rates were expressed on a leaf mass basis, differences between the top and the bottom of the canopy were reduced but not eliminated.
The rate of isoprene emission in August was less than that observed in June (Table 2), although the activation energies at 2000 and 1000 µmol m−2 s−1 were similar to those determined in June at 55 and 80 kJ mol−1, respectively. In August, isoprene emission rate increased with increasing temperature until the temperature was above 40 °C. As in June, photosynthetic rate and stomatal conductance fell with increasing temperature so that, at 40 °C and in full sunlight, isoprene accounted for 13.7% of the carbon fixed in photosynthesis and the isoprene concentration was 2.6 ppm inside the leaf. Biosynthesis of isoprene from photosynthetic precursors likely results in four carbons being lost as CO2, and so in addition to the 13.7% of photosynthesis lost as isoprene, another 11% of potential pho-tosynthate is lost as a by-product of isoprene synthesis giving a total carbon cost of about 25% of photosynthesis.
The gradient in leaf-area based isoprene emission capacity from the top to the bottom of the canopy was about 3-fold at 30 °C and 5-fold at 35 °C (Table 2). Both assimilation capacity and leaf chlorophyll concentration were highest in the middle of the canopy (Table 3), whereas the chlorophyll a/b ratio was highest at the top of the canopy and declined with depth in the canopy paralleling the decrease in irradiance from the top to the bottom of the canopy.
Contents of the xanthophyll cycle intermediates, violaxan-thin (V), antheraxanviolaxan-thin (A), and zeaxanviolaxan-thin (Z), were high in leaves at the top of the canopy and declined with depth in the canopy. In addition, the epoxidation state ((A+0.5V)/(Z + V + A)) (Demmig-Adams and Adams 1992) was lowest at the top of the canopy and increased down the canopy. Lutein, which does not participate in the light-protecting xanthophyll cycle,
Table 1. Isoprene emission rate and other gas exchange parameters measured in white oak (Quercus alba)leaves at the top of the canopy in June 1994. Values are given as means ± SE (n = 3 measurements on each of three leaves). Units are: isoprene emission rate, nmol m−2 s−1; photosynthetic CO2 assimilation rate, µmol m−2 s−1; I/A is the ratio of carbon atoms emitted as isoprene to carbon atoms assimilated in photosynthesis expressed as %; conductance to water vapor exchange, mol m−2 s−1, and isoprene concentration, nmol mol−1 air inside the leaf. Measurements were made at either 1000 or 2000 µmol m−2 s−1 and at 30 or 35 °C.
Light/temp 1000/30 1000/35 2000/30 2000/35
Isoprene 87 ± 9 135 ± 8 108 ± 8.3 155 ± 12 Assimilation 11.2 ± 0.4 9.1 ± 0.3 12.9 ± 0.7 10.0 ± 0.2 I/A 3.9 ± 0.4 7.4 ± 0.2 4.2 ± 0.1 7.8 ± 0.5 Conductance 0.23 ± 0.01 0.19 ± 0.00 0.28 ± 0.02 0.21 ± 0.01 Isoprene conc. 759 ± 80 1363 ± 56 746 ± 17 1471 ± 69
and β-carotene contents did not vary through the canopy, indicating that the differences in chl a/b ratio, contents of xanthophyll cycle intermediates, and epoxidation state were specific responses, presumably to light environment, and not simply a reflection of the general health or specific leaf area of the leaves.
In August, we measured isoprene emission and gas ex-change on leaves of several branches of red oak (Quercus rubra) that were cut from the top of a tree near the tower. The rates of isoprene emission were less than for white oak when measured at a PPFD of 1000 µmol m−2 s−1 but the difference was less obvious at a PPFD of 2000 µmol m−2 s−1. Assimila-tion rate of red oak was also less than that of white oak at a PPFD of 1000 mol µmol m−2 s−1 but not at a PPFD of 2000 µmol m−2 s−1, an effect that could be explained by lower stomatal conductance at low irradiances in red oak compared with white oak. Because stomata were more closed at low irradiances in red oak than in white oak, the concentration of
isoprene was nearly constant across treatments despite the large change in isoprene emission rate. In red oak, both sto-matal conductance and photosynthetic rate increased when the temperature was increased from 35 to 40 °C, whereas in white oak both stomatal conductance and photosynthetic rate de-clined over this temperature range (Table 4).
We tested whether isoprene emission rate increased when the temperature was above 40 °C in one white oak leaf and three red oak leaves. In all cases, isoprene emission rate in-creased as temperature inin-creased to 42 °C. In one red oak leaf, isoprene emission rate increased up to 44 °C. For two red oak leaves and the white oak leaf the temperature was held at 42 °C for 5 to 20 min and isoprene emission rate fell over this time.
Discussion
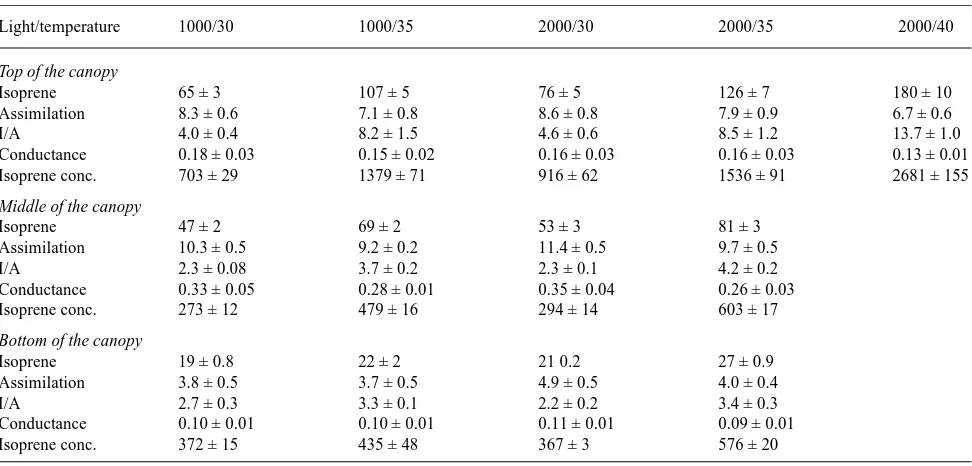
Isoprene emission rates were much higher from leaves at the top of the canopy of a white oak tree than from leaves lower in Table 2. Isoprene emission rate and other gas exchange parameters measured in white oak (Quercus alba)leaves in August 1994. Values given are means ± SE (n = 1 measurement on each of five leaves). Units are given in Table 1. Measurements were made at the top (LAI = 0.3), middle (LAI = 1) and near the bottom (LAI = 3) of the tree canopy. Measurements were made at either 1000 or 2000 µmol m−2 s−1 and at 30 or 35 °C.
Light/temperature 1000/30 1000/35 2000/30 2000/35 2000/40
Top of the canopy
Isoprene 65 ± 3 107 ± 5 76 ± 5 126 ± 7 180 ± 10
Assimilation 8.3 ± 0.6 7.1 ± 0.8 8.6 ± 0.8 7.9 ± 0.9 6.7 ± 0.6
I/A 4.0 ± 0.4 8.2 ± 1.5 4.6 ± 0.6 8.5 ± 1.2 13.7 ± 1.0
Conductance 0.18 ± 0.03 0.15 ± 0.02 0.16 ± 0.03 0.16 ± 0.03 0.13 ± 0.01
Isoprene conc. 703 ± 29 1379 ± 71 916 ± 62 1536 ± 91 2681 ± 155
Middle of the canopy
Isoprene 47 ± 2 69 ± 2 53 ± 3 81 ± 3
Assimilation 10.3 ± 0.5 9.2 ± 0.2 11.4 ± 0.5 9.7 ± 0.5
I/A 2.3 ± 0.08 3.7 ± 0.2 2.3 ± 0.1 4.2 ± 0.2
Conductance 0.33 ± 0.05 0.28 ± 0.01 0.35 ± 0.04 0.26 ± 0.03
Isoprene conc. 273 ± 12 479 ± 16 294 ± 14 603 ± 17
Bottom of the canopy
Isoprene 19 ± 0.8 22 ± 2 21 0.2 27 ± 0.9
Assimilation 3.8 ± 0.5 3.7 ± 0.5 4.9 ± 0.5 4.0 ± 0.4
I/A 2.7 ± 0.3 3.3 ± 0.1 2.2 ± 0.2 3.4 ± 0.3
Conductance 0.10 ± 0.01 0.10 ± 0.01 0.11 ± 0.01 0.09 ± 0.01
Isoprene conc. 372 ± 15 435 ± 48 367 ± 3 576 ± 20
Table 3. Light environment and chlorophyll and xanthophyll contents of Q. alba leaves at three heights in the canopy of a single tree. Values are means and standard errors, n = 3.
Top Middle Bottom
LAI 0.3 1.0 3.0
Total chlorophyll, µmol m−2 454 ± 18 477 ± 16 383 ± 6
Chl a/b 3.15 ± 0.05 3.04 ± 0.01 2.63 ± 0.03
Xanthophyll cycle intermediates, µmol m−2 16.8 ± 0.8 4.8 ± 0.5 1.02 ± 0.3
Epoxidation, % 31 ± 1 62 ± 10 100 ± 0
Lutein, µmol m−2 33 ± 2 32 ± 1 30 ± 1
the canopy. Sun leaves are known to have a greater capacity for isoprene emission than shade leaves (here capacity means the rate of emission under standard conditions, most often at a PPFD of 1000 µmol m−2 s−1 and 30 °C) (Sharkey et al. 1991, Harley et al. 1994). Leaves at the tops of trees will also have the lowest water potential. The white oak tree was about 30 m tall and so the gravity component of the water potential is about 0.3 MPa; however, resistance to water flow would re-duce the water potential below −0.3 MPa in the top of the tree. Water stress is known to increase the capacity for isoprene emission in kudzu (Sharkey and Loreto 1993). Finally, high temperature can increase the capacity for isoprene emission (Sharkey and Loreto 1993) and high leaf temperature is more likely at the top of the tree than elsewhere because of both the higher radiation load and the reduced water supply relative to other parts of the tree. All of these factors may have contributed to the high isoprene emission capacity at the top of the white oak tree.
Our results support the thermal protection hypothesis put forward by Sharkey and Singsaas (1995) to account for plant isoprene emission. The estimates of isoprene concentration inside the leaves confirmed that the concentration of isoprene required to provide thermal protection occurs in natural condi-tions. Leaves subjected to the highest temperatures had the greatest capacity for isoprene emission. The distribution of isoprene emission capacity through the canopy was similar to the distribution of xanthophyll cycle intermediates. Xantho-phylls are believed to protect leaves against excess radiation damage (Demmig-Adams and Adams 1992), whereas isoprene is believed to protect leaves against excess heat damage (Sharkey and Singsaas 1995). The contents of lutein, a phyll that does not participate in the light-protecting xantho-phyll cycle, and β-carotene were constant throughout the canopy.
The increase in isoprene emission rate with increasing tem-perature continued to higher temtem-peratures in the field than had been assumed based on laboratory studies (Guenther et al. 1993). For example, Guenther et al. (1991) concluded that 39 °C was the peak temperature for isoprene emission. How-ever, although isoprene emission becomes unstable above 40 °C, we observed very high rates for short periods at above 40 °C. Such high temperatures are likely on hot days with little wind, the same conditions that lead to ozone pollution epi-sodes. Because leaf temperature tends to be variable, even on still days, it is possible that the transient very high rate of
isoprene emission seen immediately after raising the tempera-ture above 40 °C is relevant to modeling isoprene emission for isoprene emission inventories. If so, it may be useful to use the Arrhenius equation to describe the temperature response of isoprene emission because only two parameters would be required, the basal emission rate and the physiologically rele-vant activation energy. The current temperature response mod-els require basal emission rate plus three empirical coefficients (Guenther et al. 1991).
Red oak leaves exhibited a higher temperature optimum for photosynthesis than white oak leaves. Unfortunately we were restricted to using cut branches of red oak because the tree was between 5 and 10 m from the tower. Cutting branches may affect isoprene emission (Loreto and Sharkey 1993) and the degree to which it did so in this study is unknown. In white oak, the stomata closed at high temperatures, whereas in red oak photosynthetic rate and stomatal conductance increased with increasing temperatures between 35 and 40 °C. This difference in stomatal behavior would keep red oak leaves cooler than white oak leaves under natural conditions and could explain why the red oak leaves had a slightly lower capacity for isoprene emission than the white oak leaves.
We made measurements in June and August expecting to find a developmental increase in isoprene emission (Grinspoon et al. 1991, Kuzma and Fall 1993, F. Loreto and T.D. Sharkey unpublished data with red oak); however, isoprene emission rates were higher in June than in August, indicating that oak leaves are fully competent for isoprene emission early in the season.
We conclude that most isoprene will be lost from directly sunlit leaves. Isoprene emission is temperature and light de-pendent and not completely saturated even at a PPFD of 1000 µmol m−2 s−1. Sunlit leaves are likely to be warmer than shaded leaves. In addition, leaves that are often in the sun have as much as a 5-fold greater capacity for isoprene emission than leaves lower in the canopy that are only rarely sunlit.
Note added in proof
We now estimate the ratio of diffusivities of water to isoprene to be 2.83 based on an analysis given by Lyman, W.J., W.F. Reehl and D.H. Rosenblatt (1990) In Estimation Methods. Amer. Chem. Soc. Wash-ington, DC, pp 17-9--17-17.
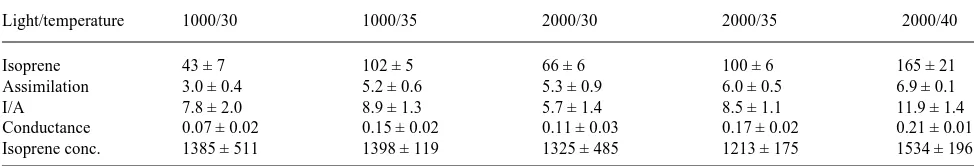
Table 4. Isoprene emission rate and other gas exchange parameters measured in red oak (Quercus rubra)leaves in August 1994. Values given are means ± SE (n = 3). Units are given in Table 1. Measurements were made on leaves attached to a branch cut from the top of a 30-m tree and placed in water. Measurements were made at either 1000 or 2000 µmol m−2 s−1 and at 30 or 35 °C.
Light/temperature 1000/30 1000/35 2000/30 2000/35 2000/40
Isoprene 43 ± 7 102 ± 5 66 ± 6 100 ± 6 165 ± 21
Assimilation 3.0 ± 0.4 5.2 ± 0.6 5.3 ± 0.9 6.0 ± 0.5 6.9 ± 0.1
I/A 7.8 ± 2.0 8.9 ± 1.3 5.7 ± 1.4 8.5 ± 1.1 11.9 ± 1.4
Conductance 0.07 ± 0.02 0.15 ± 0.02 0.11 ± 0.03 0.17 ± 0.02 0.21 ± 0.01
Acknowledgments
We thank Professor John Norman for discussions on leaf microme-tereology and on the use of the LAI 2000. Research supported by U.S. Environmental Protection Agency cooperative research agreement CR 823791-01-1 and U.S. National Science Foundation grant IBN-9317900.
References
Chameides, W.L., R.W. Lindsay, J. Richardson and C.S. Kiang. 1988. The role of biogenic hydrocarbons in urban photochemical smog: Atlanta as a case study. Science 241:1473--1475.
Delwiche, C.F. and T.D. Sharkey. 1993. Rapid appearance of 13C in biogenic isoprene when 13CO2 is fed to intact leaves. Plant Cell Environ. 16:587--591.
Demmig-Adams, B. and W.W. Adams, III. 1992. Photoprotection and other responses of plants to high light stress. Annu. Rev. Plant Physiol. Plant Mol. Biol. 43:599--626.
Fall, R. and R.K. Monson. 1992. Isoprene emission rate and intercel-lular isoprene concentration as influenced by stomatal distribution and conductance. Plant Physiol. 100:987--992.
Geron, C.D., A.B. Guenther and T.E. Pierce. 1994. An improved model for estimating emissions of volatile organic compounds from forests in the eastern United States. J. Geophys. Res. 99:12,773--12,791.
Geron, C.D., D. Nie, T.E. Kleindienst, R.R. Arnts, R.R. Sickles, II, T.D. Sharkey, E.L. Singsaas and P.J. Vanderveer. Biogenic isoprene emission: Model evaluation in a southeastern U.S. Bottomland deciduous forest. J. Geophys. Res. In press.
Grinspoon, J., W.D. Bowman and R. Fall. 1991. Delayed onset of isoprene emission in developing velvet bean (Mucuna sp.) leaves. Plant Physiol. 97:170--174.
Guenther, A.B., R.K. Monson and R. Fall. 1991. Isoprene and monoterpene emission rate variability: Observations with Eucalyp-tus and emission rate algorithm development. J. Geophys. Res. 96:10,799--10,808.
Guenther, A.B., P.R. Zimmerman and P.C. Harley. 1993. Isoprene and monoterpene emission rate variability: Model evaluations and sen-sitivity analysis. J. Geophys. Res. 98:12,609--12,617.
Guenther, A.B., P.R. Zimmerman and M. Wildermuth. 1994. Biogenic volatile organic compound emission rate estimates for U.S. wood-land wood-landscapes. Atmos. Environ. 28:1197--1210.
Harley, P.C., M.E. Litvak, T.D. Sharkey and R.K. Monson. 1994. Isoprene emission from velvet bean leaves. Interactions among nitrogen availability, growth photon flux density, and leaf develop-ment. Plant Physiol. 105:279--285.
Kuzma, J. and R. Fall. 1993. Leaf isoprene emission rate is dependent on leaf development and the level of isoprene synthase. Plant Physiol. 101:435--440.
Lamb, B., D. Gay, H. Westberg and T.E. Pierce. 1993. A biogenic hydrocarbon emission inventory for the U.S. using a simple forest canopy model. Atmos. Environ. 27A:1673--1690.
Lamb, B., A. Guenther, D. Gay and H. Westberg. 1987. A national inventory of biogenic hydrocarbon emissions. Atmos. Environ. 21:1695--1705.
Loreto, F. and T.D. Sharkey. 1990. A gas-exchange study of photosyn-thesis and isoprene emission in Quercus rubra L. Planta 182:523--531.
Monson, R.K. and R. Fall. 1989. Isoprene emission from Aspen leaves. The influence of environment and relation to photosynthesis and photorespiration. Plant Physiol. 90:267--274.
Pierce, T. and P. Waldruff. 1991. PC BEIS: A personal computer version of the biogenic emissions inventory system. J. Air Waste Manage. Assoc. 41:937--941.
Rasmussen, R.A. 1970. Isoprene: identified as a forest-type emission to the atmosphere. Environ. Sci. Technol. 4:667--671.
Rasmussen, R.A. and C.A. Jones. 1973. Emission isoprene from leaf discs of Hamamelis. Phytochemistry 12:15--19.
Reich, P.B. and R.G. Amundson. 1985. Ambient levels of ozone reduce net photosynthesis in tree and crop species. Science 230:566--570.
Runeckles, V.C. and B.I. Chevone. 1992. Surface level ozone expo-sures and their effects on vegetation. In Crop Responses to Ozone. Ed. A.S. Lefohn. Chelsea, Mich: Lewis Publishers, Inc., pp 189--270.
Sanadze, G.A. and A.L. Kursanov. 1966. On certain conditions of the evolution of the diene C5H8 from poplar leaves. Sov. Plant Physiol. 13:184--189.
Sharkey, T.D. and F. Loreto. 1993. Water stress, temperature, and on the capacity for isoprene emission and photosynthesis of kudzu leaves. Oecologia 95:328--333.
Sharkey, T.D. and E.L. Singsaas. 1995. Why plants emit isoprene. Nature 374:769.
Sharkey, T.D., F. Loreto and C.F. Delwiche. 1991. High carbon dioxide and sun/shade effects on isoprene emission from oak and aspen tree leaves. Plant Cell Environ. 14:333--338.
Tennessen, D.J., E.L. Singsaas and T.D. Sharkey. 1994. Light emitting diodes as a light source for photosynthesis research. Photosynth. Res. 39:85--92.
Tennessen, D.J., R.J. Bula and T.D. Sharkey. 1995. Efficiency of photosynthesis in continuous and pulsed light emitting diode irra-diation. Photosynth. Res. 44:261--269
Thompson, A.M. 1992. The oxidizing capacity of the Earth’s atmos-phere: probable past and future changes. Science 256:1157--1165. Tingey, D.T., M. Manning, L.C. Grothaus and W.F. Burns. 1979. The
influence of light and temperature on isoprene emission rates from live oak. Physiol. Plant. 47:112--118.
Trainer, M., E.J. Williams, D.D. Parrish, M.P. Buhr, E.J. Allwine, H.H. Westberg, F.C. Fehsenfeld and S.C. Liu. 1987. Models and obser-vations of the impact of natural hydrocarbons on rural ozone. Nature 329:705--707.