David R. Just is associate professor of applied economics and management at Cornell University. Joseph Price is associate professor of economics at Brigham Young University. The data used in this article can be obtained beginning May 2014 through April 2017 from Joseph Price. Address: Brigham Young University, Department of Economics, 162 FOB Provo, UT 8460. E- mail: joe_price@byu.edu.
[Submitted April 2012; accepted October 2012]
ISSN 0022- 166X E- ISSN 1548- 8004 © 2013 by the Board of Regents of the University of Wisconsin System
T H E J O U R N A L O F H U M A N R E S O U R C E S • 48 • 4
Healthy Eating in Children
David R. Just
Joseph Price
A B S T R A C T
There is growing interest in the situations in which incentives have a signifi cant effect on positive behaviors, particularly in children. Using a randomized fi eld experiment, we fi nd that incentives increase the fraction of children eating a serving of fruits or vegetables during lunch by 80 percent and reduce the amount of waste by 33 percent. At schools with a larger fraction of low- income children, the increase in the fraction of children who eat a serving of fruits or vegetables is even larger, indicating that incentives successfully target the children who are likely to benefi t the most from the increased consumption.
I. Introduction
Schools provide a large fraction of the meals that children eat. This fraction has increased with expansions in school breakfast programs, summer meal programs, and the addition of dinner programs in some districts. These programs pro-vide a unique opportunity to encourage fruit and vegetable consumption in children, particularly among children from low- income families who consume fewer fruits and vegetables at home (Krebs- Smith et al. 1996; Muñoz et al. 1997). However, the poten-tial benefi ts of these opportunities will only be realized if these children actually eat the fruits and vegetables being offered.
(Cuffe et al. 2011), with incentivized health behaviors including exercise, weight loss, smoking cessation, health screenings, and immunizations (Charness and Gneezy 2009; Cawley and Price 2011; Volpp et al. 2008; Volpp et al. 2006; Malotte, Rhodes, and Mais 1998; Moran et al. 1996).1
Research on other interventions designed to encourage fruit and vegetable con-sumption indicates that children may be particularly sensitive to even small changes when making food decisions. In one intervention, the fraction of children eating fruit increased by simply having the cafeteria workers provide a verbal prompt (Perry et al. 2004; Schwartz 2007). Other programs that include educational materials, food ser-vice changes, and parental involvement show modest but consistent improvements in fruit and vegetable consumption, though the effects of these programs are sometimes limited only to fruit or fruit juice consumption (Gortmaker et al. 1999; Perry et al. 1998; Cassady et al. 2006). We fi nd that providing a reward increases the fraction of children eating a serving of fruits or vegetables by 28 percentage points (an 80 percent increase), and this increase occurs even on those days in which only vegetables are being offered.
We test the degree to which the response to incentives depends on the nature of the reward being offered. Past research suggests that physical prizes and cash rewards may have different effects, and that the timing of the reward matters as well (Kivetz and Simonson 2002; Laibson 1997; Bettinger and Slonim 2007). We randomly assign each school to one of fi ve different incentives that vary in size (quarter or nickel), type (cash or prize), and timing (now or in a few weeks). Among the cash prizes we fi nd that children discount the future (as expected) and are more responsive to larger prizes (with an implied elasticity of 0.57).
We also test whether the introduction of rewards produces a larger effect at schools with a larger fraction of children who receive free and reduced- price lunch (a proxy for the income level of the school). The schools in our sample come from a disparate range of income levels, with the fraction of children receiving a free lunch ranging from 17 percent to 77 percent. We fi nd that the effect of the incentive program at the lowest- income schools was more than twice as large as the effect at the highest- income schools. Because consumption rates of fruits and vegetables are much lower among children from low- income households (Krebs- Smith et al. 1996; Muñoz et al. 1997), these children are likely to benefi t the most from the additional fruits and vegetables. This suggests that this type of rewards program successfully targets the children who will benefi t the most from the increased consumption of fruits and vegetables.
Finally, we examine some of the potential negative effects of providing incentives. Because we only provided an incentive to children for eating at least one serving of fruits and vegetables (with no additional rewards for eating two or more), we docu-ment that our incentives did not cause individuals who were already above the thresh-old to reduce their behavior back to the threshthresh-old. We also show that our incentives did not produce a negative rebound effect. Others have found that removing an incentive can lead to behavior returning to levels that are lower than the preincentive baseline
rate (Lepper, Greene, and Nisbett 1973). We fi nd no evidence of such an effect in the context of fruit and vegetable consumption.
II. Experimental Design
We conducted a fi eld experiment at 15 elementary schools in two school districts in Utah. We randomly assigned each of the participating schools to one of six groups: (1) receive a lottery ticket for a prize immediately, (2) receive a quarter immediately, (3) receive a lottery ticket for a prize in two weeks, (4) receive a quarter in two weeks, (5) receive a nickel immediately, (6) no incentive (control). Our original randomization only included the fi rst four groups and the control group (with three schools in each group). After preliminary results from a school in which students were rewarded with a quarter immediately, we added the nickel treatment to provide insight about whether children understand the value of money and, if so, how responsive they are to increases in the incentive.2 The fi nal assignment includes three
schools to each of the fi rst three treatments, two schools to each of Treatments 4 and 5, and two schools as controls.
We decided to use a lottery for the prizes rather than awarding individual prizes because it was diffi cult to fi nd a set of prizes that cost a quarter that would appeal to a broad set of ages and that we could easily hand out during lunch. By using a lottery we were able to award prizes related to some form of active recreation such as rip- sticks, tennis rackets, soccer balls, and swim goggles. The total cost of these prizes was equal to the number of kids who ate a serving of fruits or vegetables multiplied by 25 cents (so that the prizes would have the same expected cost as the quarter treatments). Since the prizes varied in value, we allowed the children to pick prizes in descending order based on the order in which their raffl e tickets were drawn.
The treatment days occurred over fi ve lunch periods spanning two to three weeks. On each treatment day there was a message in the morning announcements, read over the school’s public address system, about the reward students could receive by eating a serving of fruits or vegetables that day. For those schools where we provided prizes instead of cash, we displayed prizes on a table near where we were collecting data, visible to all students. For schools where students would receive prizes that same day we displayed the number of prizes we anticipated giving out that day. For the schools where students would receive the prizes in two weeks, we displayed the full set of prizes that we anticipated giving out at the end of the treatment (which included fi ve days’ worth of prizes).
The children were informed that they would receive a reward if they ate at least one serving of fruits or vegetables as part of their school- provided lunch (with no additional rewards for eating more than one serving). Each of the schools in our study provide a main entrée and students are allowed to choose as many items as they want from a selection of fruits, vegetables, and other side dishes. Our experiment occurred prior to the current guidelines that require that every child have at least one serving of
fruits or vegetables on their tray. However, during our experiment, many of the schools had a similar requirement in place.
Prior to the start of any treatments, we collected baseline data at each school for
fi ve days spread out over a two- week period. Our research assistants stood by the trash cans in each cafeteria and recorded the number and type of fruits and vegetables taken and the number and type consumed by each child (potatoes, corn, and fruit juices were not included as fruits or vegetables). During the treatment days, data was collected in the same way as during the baseline period with an additional research assistant present to distribute the prizes. The fruits and vegetables came in special cups or left behind a peel or core, allowing us to record the number of servings taken and consumed based on the number of full or empty servings left on the tray, reported in half serving increments. The gender and grade of each child were also noted as the child dispensed of their tray.3 The same data collection procedure was used during
both the baseline and treatment periods as well as in both the control and treatment schools.
This data approach allowed us to quickly record information for a large number of children during a relatively short period of time without having any verbal interaction with the children. One disadvantage of this approach is that it does not allow us to record any identifying information about the child (aside from their grade and gender). Our approach also does not allow us to directly measure health outcomes. However, increasing consumption of fruits and vegetables should indicate that children are closer to meeting recommended dietary guidelines.
We combine our consumption data with descriptive statistics from the Common Core of Data. This dataset provides sociodemographic and performance information on all schools in the United States, allowing us to determine whether schools we included in our sample are similar to national averages. The schools in our study are very similar to the national average for the fraction of students who are eligible for a free lunch (42 percent compared to the national average of 39 percent), the pupil / teacher ratio (16.35 vs. 16.17), and the fraction of students who are Hispanic (23 percent vs. 24 percent) or Asian (4 percent vs. 6 percent). One characteristic that differs greatly for these schools is the fraction of students who are African- American (one percent vs. 13 percent). In addition, the schools in our sample are entirely from suburban neighborhoods and may not refl ect the types of patterns that might occur at urban elementary schools.
III. Impact of Incentives
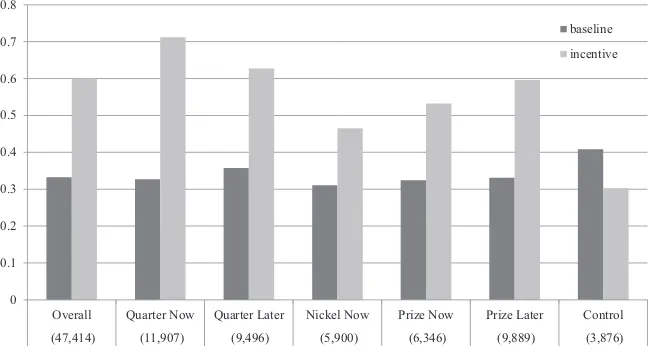
In Figure 1, we provide pre- and posttreatment information about the fruit and vegetable consumption patterns for each of our treatment groups. During our baseline data collection period, 33.2 percent ate at least one serving of fruits and this baseline rate was similar across all of our treatment groups. Among schools that provided an immediate reward, the change in the fraction of children eating at least one serving
of fruits or vegetables was lowest when the reward was a nickel (a 15.4 percentage point increase) and highest when the reward was a quarter (a 38.5 percentage point increase).
The regression results that follow test more precisely the overall effect of providing incentives and how this effect differs based on the nature and timing of the reward. When interpreting these regressions, it is important to note that the effect of providing incentives is the combination of responding to the reward and possibly responding to having to interact with an adult about their eating habits. Since the effect of interacting with an adult should be the same for the different treatment groups, differences in the rewards will drive the variation between the different treatment groups.
All of the regressions include school fi xed effects, day of the week fi xed effects, controls for the child’s grade and gender, and an indicator for whether only vegetables were offered that day (instead of vegetables and fruit). Since the treatment was ran-domized at the school level, we cluster all of the standard errors at the school level. In each regression, we examine the effect of the incentives on the fraction of kids that ate a serving of fruits or vegetables, the number of servings eaten, and the number of servings thrown away. It should be noted that the number of items that are placed on the student’s tray, consumed, and thrown away are jointly determined (in fact the three form an accounting relationship).
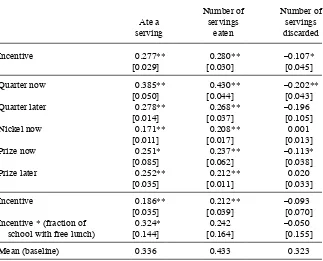
In the fi rst panel of Table 1, we combine the different incentive types into a single indicator variable that provides the average effect of providing any incentive. We fi nd that providing an incentive raised the fraction of children eating at least one serving of fruits and vegetables by 27.7 percentage points, which represents an 82 percent
0 0.1 0.2 0.3 0.4 0.5 0.6 0.7 0.8
Overall Quarter Now Quarter Later Nickel Now Prize Now Prize Later Control
(47,414) (11,907) (9,496) (5,900) (6,346) (9,889) (3,876) baseline
incentive
Figure 1
Effect of incentives on the fraction of children eating at least one serving of fruits or vegetables.
increase relative to the consumption rate in the baseline period of 33.6 percent.4 The
number of servings being thrown away was also reduced by 0.11 servings per child (a 33 percent decrease).We have employed a linear probability model given the ease with which marginal effects may be reported and interpreted. Results do not change substan-tively when estimated using the appropriate discrete, count, or proportional methods.5
4. All interactions between incentive and gender or grade were statistically insignifi cant, though the coeffi cients suggest that girls and older children are slightly more responsive to rewards, which is consistent with groups that had higher levels of consumption to begin with being more responsive to the rewards.
5. To check the robustness of our estimates we estimated a probit regression for the “ate a serv-ing” column and a poisson regression for the other two columns. In each case the average mar-ginal effect of the incentive was about 10 percent smaller in magnitude, though all coeffi cients are still statistically signifi cant at the 1 percent level.
Table 1
Effect of incentives on children’s fruit and vegetable consumption.
Ate a serving
Number of servings
eaten
Number of servings discarded
Incentive 0.277** 0.280** –0.107*
[0.029] [0.030] [0.045]
Quarter now 0.385** 0.430** –0.202**
[0.050] [0.044] [0.043]
Quarter later 0.278** 0.268** –0.196
[0.014] [0.037] [0.105]
Nickel now 0.171** 0.208** 0.001
[0.011] [0.017] [0.013]
Prize now 0.251* 0.237** –0.113*
[0.085] [0.062] [0.038]
Prize later 0.252** 0.212** 0.020
[0.035] [0.011] [0.033]
Incentive 0.186** 0.212** –0.093
[0.035] [0.039] [0.070]
Incentive * (fraction of 0.324* 0.242 –0.050
school with free lunch) [0.144] [0.164] [0.155]
Mean (baseline) 0.336 0.433 0.323
The second panel of Table 1 displays the results by the type of incentive, providing three basic insights into designing a rewards program for children. First, larger prizes produce a larger response (with an implied elasticity of 0.57).6 Second, immediate
rewards produce a larger effect than delayed rewards. Third, cash prizes tend to pro-duce a larger effect than a cash- equivalent lottery for prizes (though not statistically signifi cant). The p- values for each of these differences using “ate a serving” as the outcome are 0.001 (quarter now vs. nickel now), 0.065 (quarter now vs. quarter later), and 0.191 (quarter now vs. prize now).7 Since we only had two to three schools in each
of the treatment arms we mention these differences by incentive type only as being suggestive of how schools might structure the parameters of a rewards program.
While, from a statistical perspective, it is generally ideal to assign the treatment at the individual level, there are many situations in which randomization should oc-cur at the school level. This is particularly true in cases where there are likely to be contamination effects, a potential resentment effect on the part of the control group, or a need to advertise the intervention through school- wide announcements or posters. The primary challenge of school- level randomization is that the cost of providing a treatment to an entire school can limit the number of schools that can be included in a single study.
Since our experiment was randomized at the school level we need to correct for general autocorrelations among the errors of students attending the same school (Ber-trand, Dufl o, and Mullainathan 2004). In the results presented in Table 1, we cluster all of the standard errors at the school- level. Since there are only 15 schools in our sample, the asymptotic properties of clustering may not be appropriate for our setting. As a result, we also provide two alternative tests of whether the incentives produced a statistically signifi cant change in consumption behavior.
First, we collapse all of our data so that there are just two observations for each treatment school (one for the baseline and one for the treatment period) and one for each control school. We reestimate the results from panel A of Table 1, but now the only controls are a set of school fi xed effects. Using this collapsed data approach with only 28 observations, we fi nd very similar results and all of our main treatment effects continue to be statistically signifi cant at the 1 percent level (we provide these results in Table A1 in the appendix).
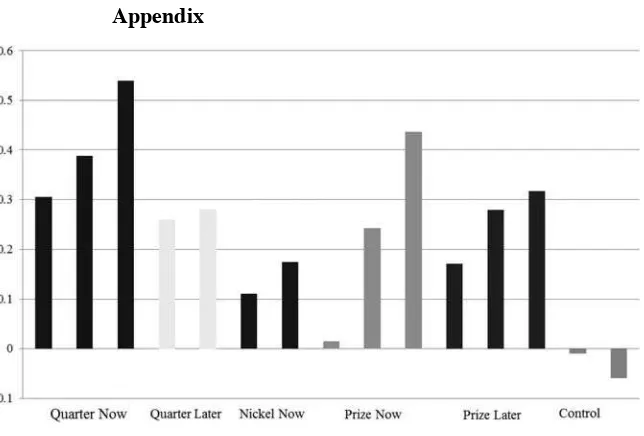
Second, we test for a statistically signifi cant effect of providing incentives using a Fisher Exact test. In Figure A1 (in the appendix) we plot the percentage change in the fraction of children who ate a serving of fruits and vegetables at each of the schools in our sample. Under the null hypothesis that there was no treatment effect we would expect about half of the schools to experience an increase in consumption rates and half the schools to experience a decrease in consumption rates. In fact, at every treated
6. Elasticity is the percent change in the consumption rate divided by the percent change in value of the reward (using an arc- elasticity formula).
school we observe an increase in consumption rates. In contrast, both of the control schools had a lower fraction of children eating a serving of fruits and vegetables dur-ing the last fi ve days of the observation period than they did during the fi rst fi ve days (one school had a decrease of one percentage point and the other school a decrease of six percentage points). The p- value for the Fisher Exact Test of whether the program had a positive effect is 0.0095.
IV. Additional Effects
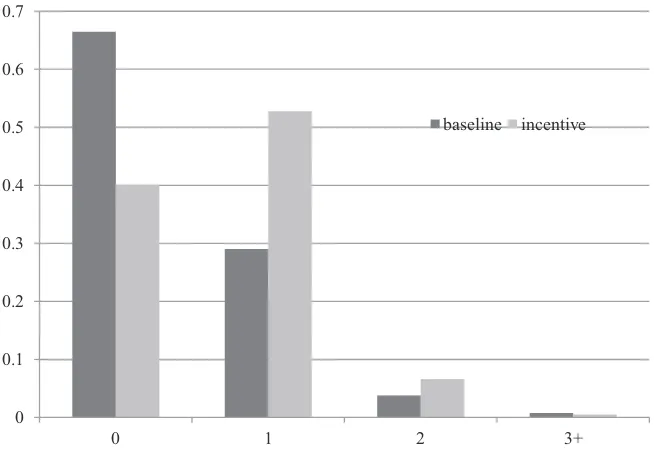
One potential concern with our intervention design concerns the es-tablishment of social norms. In our experiment, we only provided a reward to children for the fi rst serving of fruits and vegetables that they ate each day. This aspect of our rewards program might have communicated a social norm that could cause those individuals already consuming multiple servings to decrease their consumption to just one serving. However, the data suggest that such is not the case. Figure 2 displays the distribution of the number of servings of fruits and vegetables that children consumed. There was a big drop in the fraction consuming zero and a large increase in the fraction consuming one serving. At the higher levels of consumption, the fraction of children eating two servings increases from 3.8 percent to 6.6 percent and the fraction of chil-dren eating three or more drops from 0.8 percent to 0.5 percent.
In addition to the direct cost of the rewards, the incentive program has an additional cost to schools in terms of the additional items of fruits and vegetables that they would have to serve. We fi nd an increase in the number of items being served by the schools (about 0.17 servings per child) and a decrease in the amount of fruits and vegetables being thrown away (about 0.11 serving per child). Using administrative records from the school district, we fi nd that the average cost of a serving of fruits and vegetables is about 20 cents. Thus the incentive program created an additional cost to the schools of about three cents per child because of the extra items that were served. This additional cost may be of less importance under the new School Lunch guidelines, which require each school lunch to contain a serving of fruit or vegetables to qualify for reimburse-ment.
When considering costs, it is helpful to compare the cost of the incentive program with the overall cost of lunch and the cost of other programs with a similar goal. The incentive program would cost an average of 24 cents per child per day, including 18 cents expended on incentives and six cents expended on the labor costs of administer-ing the incentives. This constitutes roughly 8 percent of the cost of a school meal in this context.8 The federal fruit and vegetable program costs between $50 and $75 per
year per student, providing each child with a serving of fruits or vegetables as a snack each day. By comparison, the incentive program we implemented would result in $42
of additional cost per year per student, and operates largely by reducing the amount of fruits and vegetables wasted.
Another concern is that the incentives may have affected the underlying sample of participants by encouraging students to purchase a school lunch. We fi nd that the incentives increased the number of children consuming a school lunch each day by 11 lunches on average (a 4 percent increase) but increased the average number of children eating at least one serving each day by 80 (an 87 percent increase). If we made the extreme assumption that all of the children who switched to school lunches on the incentive days were already eating fruits and vegetables as part of their sack lunch, then we would need to scale our effect sizes by one eighth.9
We also examine whether the incentives had a larger impact on the schools with a larger fraction of low- income children (as measured by the fraction of children receiv-ing a free or reduced- price lunch). The schools in our sample range from 17 percent
9. Unfortunately our data collection approach does not work well for children with sack lunches. There is some evidence from past studies that sack lunches provide fewer fruits and vegetables than school lunches and often fail to include even one serving of fruits and vegetables (Rainville 2001; Gordon and McKinney 1995; Sweitzer, Riley, and Robert- Gray 2009), suggesting that the actual degree to which we would need to scale back our estimates is probably much less than one eighth.
0 0.1 0.2 0.3 0.4 0.5 0.6 0.7
0 1 2 3+
baseline incentive
Figure 2
Changes in the number of servings of fruits and vegetables consumed.
of the students receiving a free lunch up to 77 percent. For the purposes of examining the interaction between incentives and socioeconomic status, we recentered the mea-sure of those receiving free and reduced- price lunch by subtracting 0.17 (the lowest percentage observed) from each data point. Thus, the interaction can be interpreted as the marginal impact of increasing the percentage of students receiving free or reduced price lunch, and the coeffi cient on incentive can be interpreted as the impact at the schools in our sample with the lowest level of free and reduced- price lunch participa-tion.
The coeffi cient on the incentive variable in panel C in Table 1 indicates that at the richest schools the fraction of children eating a serving of fruits and vegetables increased by 18 percentage points (33 percent smaller than the overall effect across all schools). The coeffi cient on the interaction term between the incentive variable and the free lunch rate indicates that an increase from a 0 to 100 percent free lunch rate would increase the effect of the incentive by 32 percentage points. After scaling this differen-tial effect by the observed range of variation in the free lunch rate in our data (0.6), we
fi nd that the effect of the incentive on consumption rates at the lowest- income schools was more than twice as large as the effect at the highest- income schools.10
Part of the differential response could be due to the fact that poorer schools had slightly lower rates of fruit and vegetable consumption during the baseline period. When we fi t a linear regression between the school’s free lunch rate and fruit and vegetable consumption during the baseline period, we fi nd that a 10 percent increase in the fraction of children receiving a free lunch is associated with a one percentage point decrease in the fraction of children eating a serving of fruits or vegetables. Another potential reason for the differential response is that lower- income children may place a higher value on receiving the incentive.
There might be some concerns about an experimental design with only two control schools. The primary need for control schools in this setting is to measure the degree to which the treatment schools would have changed during the post period in the ab-sence of the treatment. We address concerns about a small number of control schools in two ways. First, we varied the start date for the intervention from school to school, with start dates ranging over the entire course of the school year. Thus, there is less concern in this setting about the results being driven by time- varying factors such as seasonal variation or the timing of other programs that would have affected the schools in our sample. Second, we provide some evidence about the degree to which there was a Hawthorne Effect in which children alter their behavior in response to our research assistants being present in the cafeterias.
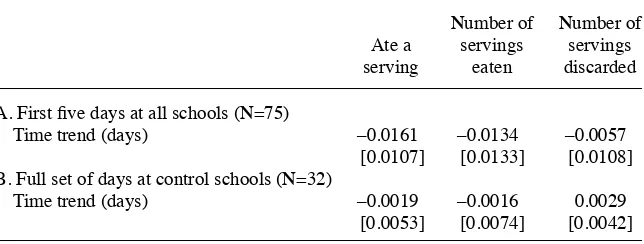
In Appendix Table A2, we provide results from a regression in which we examine the change in eating behaviors over the course of the fi ve days of baseline observa-tion that we conducted at all 15 schools. The results indicate that there was almost no change in eating behaviors during those fi rst fi ve days of observation and, if anything, there was a slight decrease in the fraction of children eating a serving of fruits or vegetables during lunch. We also estimate a similar time trend for the full set of days
at our two control schools. Again, we fi nd that there was no change in eating behaviors over the course of the observation period.11
Another concern with our data collection is that, as with any incentive program, there may be some fruit- and vegetable- averse children who will attempt to fi nd ways to cheat. Possible opportunities to cheat include outsourcing (getting friends to eat fruits or vegetables), smuggling (hiding uneaten portions in milk boxes or under other uneaten food items), and premature disposal (dumping uneaten portions under the table). The diffi culty of observing individual children in a full cafeteria during lunch makes monitoring of outsourcing very challenging, but we were able to collect some information about the latter two channels by measuring the amount of waste on the
fl oor after lunch and doing a random check whether students were placing items in milk cartons. We found only minor levels of cheating relative to the overall increase in the consumption of fruits and vegetables.
Finally, there is often a focus in public health and nutrition about whether the effect of an intervention operates differently for fruits and vegetables. Many past interven-tions that have been successful in raising fruit or fruit juice consumption have had no effect on vegetable consumption (Krebs- Smith et al. 1996, Gortmaker et al. 1999; Perry et al. 1998; Cassady et al. 2006). We did not collect data on which item each child ate but rather simply recorded whether they had eaten at least one serving of fruits or vegetables. However, when we restrict our analysis to just the 20 days in which a vegetable was the only option available, we fi nd that providing incentives increased the fraction of children eating at least one serving of vegetables from 16.4 percent to 45.4 percent (almost a threefold increase) with a p- value for this difference of 0.003.
V. Additional Experiment
Underlying much of the debate about the use of incentives is the ques-tion of whether removing the incentives might cause the child to return to a lower consumption level than prevailed prior to the start of the intervention (Lepper, Greene, and Nisbett 1973). This effect, called crowding out, can occur if the individual’s prior intrinsic motivation to complete the task is reduced when they begin to receive the incentive. For example, the incentive may communicate that the task is more onerous than previously thought, or the individual may believe that the incentive is likely to be provided at a future time if the task is not completed (see Gneezy, Meier, and Rey- Biel 2011 for a full discussion).
Crowding out has been found in many contexts. For example, donations decrease below original levels following a period of matching incentives (Meier 2007). How-ever, Gneezy, Meier and Rey- Biel (2011) review many instances in which incentives do not crowdout intrinsic motivation. Notably, many of these examples are incentives given for educational performance or attendance. In these cases, individuals displayed superior academic performance, as compared to control groups, long after the suspen-sion of incentives. This is attributed to the duration and the size of the incentives
leading to the development of meaningful habits as the individual begins to value the action intrinsically. Crowding out tends to occur if the program is not in place long enough to create any meaningful amount of habit formation, or if the rewards are too small to be salient in encouraging the behavior in the fi rst place.
Our original fi eld experiment was focused only on the immediate effect of the in-centives and we did not collect any consumption data after the removal of the incen-tives. To address this issue, we ran a second experiment in which we provided an immediate quarter reward at eight schools from the original sample. The second ex-periment occurred during the following school year using the protocols of the original
fi eld experiment (fi ve days of baseline data and fi ve days of incentives). This second experiment also provides an “out- of- sample” test of the main effects of the quarter now treatment documented in our original fi eld experiment. In the second experiment we also collected data for the four weeks after the end of the incentive (with data col-lected two days each week for those four weeks).
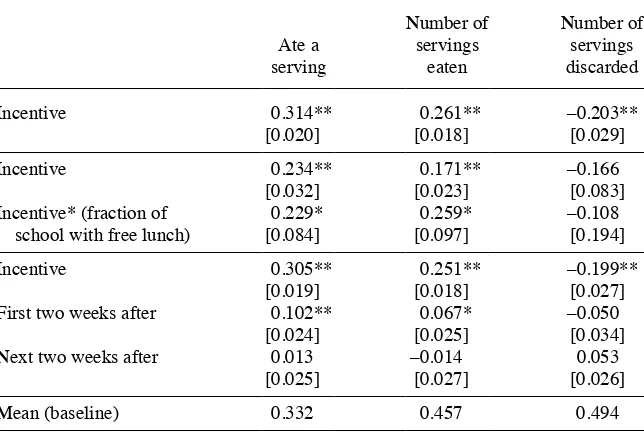
In Table 2, we present the results of this second fi eld experiment. The regressions in the fi rst two panels mirror those presented in Table 1, except that now the only treatment that we examine is the quarter now treatment. For these fi rst two panels we restrict the sample to just those observations that occurred during the baseline and incentive period (to provide the same test as in Table 1). We fi nd that the incentive increased the fraction of children eating at least one serving of fruits and vegetables by 31.4 percentage points (a 95 percent increase). As before, the effects on the frac-tion of children that ate a serving were larger at the schools with a higher fracfrac-tion of students who receive a free or reduced price lunch. The effect sizes for the quarter now treatment were smaller than in the fi rst experiment but still represent a dramatic increase in the fraction of children eating fruits and vegetables.12 If we pool together
the schools in the quarter now group from the fi rst experiment with all of the schools from the second experiment we fi nd a combined effect of 33.3 percentage points (with a standard error of 0.027) which represents a doubling in the fraction of children eating at least one serving of fruits and vegetables during lunch.
In the fi nal panel of Table 2, we include the full sample of observations from the second experiment (including the post- incentive observations). We divide the four- week post- incentive observation period into the fi rst two weeks and the next two weeks. We fi nd that the program produced a small effect on consumption during the two weeks after the incentive program (relative to the baseline rates for each school) but that these differences disappear within four weeks of the end of the incentive pro-gram. As with other studies in economics, though, we fi nd no evidence of a boomerang or crowdout effect. In this case, the short- term use of incentives did not cause behavior after the removal of the incentives to revert to a level below that of the baseline period. The rewards program that we implemented was not designed to be in place long enough for a meaningful habit formation process to take place. This analysis of the
post- intervention period simply provides evidence that fruit and vegetable consump-tion was not any lower after the removal of the rewards than prior to the intervenconsump-tion. The ideal intervention would combine the large immediate effects that we document in this paper with an intervention that produces a slower initial effect, but is more likely to produce a lasting change in eating habits. The Food Dudes program is one such intervention that has been successfully implemented in the United Kingdom and combines a rewards program with a set of videos that depict a set of superheroes who enjoy eating fruits and vegetables with short video clips of pop stars who reinforce this message (Lowe et al 2004).
VI. Conclusion
We implemented a randomly assigned rewards program at 15 elemen-tary schools that include over 47,000 student- day observations with information on the number of servings of fruits and vegetables that each child both took and ate. We fi nd that providing rewards can lead to large increases in the fraction of children who eat fruits and
Table 2
Impact of incentives on behavior after incentives are removed
Ate a serving
Number of servings
eaten
Number of servings discarded
Incentive 0.314** 0.261** –0.203**
[0.020] [0.018] [0.029]
Incentive 0.234** 0.171** –0.166
[0.032] [0.023] [0.083]
Incentive* (fraction of 0.229* 0.259* –0.108
school with free lunch) [0.084] [0.097] [0.194]
Incentive 0.305** 0.251** –0.199**
[0.019] [0.018] [0.027]
First two weeks after 0.102** 0.067* –0.050
[0.024] [0.025] [0.034]
Next two weeks after 0.013 –0.014 0.053
[0.025] [0.027] [0.026]
Mean (baseline) 0.332 0.457 0.494
vegetables as part of their school lunch. Providing rewards has an even larger effect at schools with a larger fraction of low- income children. We also fi nd a signifi cant increase in fruit and vegetable consumption when providing a reward as small as a nickel. This suggests that some of the concerns about providing rewards that are too small might not apply to young children (Gneezy and Rustichini 2000).
We allay some of the common concerns about the use of incentives. When we examine the distribution of the number of items that each child ate, we fi nd little evi-dence that setting a benchmark of one serving reduced the consumption of fruits and vegetables for children who were already consuming above the benchmark. When we examine the change in fruit and vegetable consumption after we remove the rewards, we fi nd that the positive change in behavior fades away quickly. However, children do not end up eating fewer fruits and vegetables than they did prior to the introduction of rewards—ruling out the rebound effects that have been a major concern documented in experimental psychology (Lepper, Greene, and Nisbett 1973).
Our incentive program produced only a small increase to the amount of fruits and vegetables that needed to be served but reduced the amount of fruits and vegetable items that were being thrown away by 33 percent. This suggests that schools can increase the cost- effectiveness of money they are already spending on fruits and vegetables by increasing the fraction of those items that are actually consumed. This reduction in waste might prompt schools to spend money on higher- quality fruits and vegetables, potentially producing an even larger increase in the consumption rates of these items.
Appendix
Figure A1
Percentage point change in the fraction of children eating a serving of fruits or vegetables at each school.
Notes: Each bar is a separate school and the schools are grouped based on the treatment they received.
Table A1
Effect of incentives on children’s fruit and vegetable consumption
Ate a serving
Number of servings
eaten
Number of servings discarded
Incentive 0.271** 0.276** –0.094*
[0.038] [0.038] [0.031]
Incentive 0.156* 0.197* –0.075
[0.057] [0.065] [0.057]
Incentive * (fraction of
school with free lunch) 0.387* 0.266 –0.065
[0.160] [0.180] [0.160]
Mean (baseline) 0.329 0.425 0.339
References
Angrist, Joshua, and Victor Lavy. 2009. “The Effects of High School Achievement Awards: Evidence from a Randomized Trial.” American Economic Review 99(4):1384–414. Bettinger, Eric, and Robert Slonim. 2007. “Patience Among Children.” Journal of Public
Economics 91(1–2):343–63.
Bettinger, Eric. 2012. “Paying to Learn: The Effect of Financial Incentives on Elementary School Test Scores.” Review of Economics and Statistics 94(3):686–98.
Bertrand, Marianne, Esther Dufl o, and Sendhil Mullainathan. 2004. “How Much Should We Trust Difference- in- Differences Estimates?” Quarterly Journal of Economics
119(1):249–75.
Cassady, Diana, Rainbow Vogt, Debbie Oto- Kent, Ramona Mosley, and Richard Lincoln. 2006. “The Power of Policy: A Case Study of Healthy Eating Among Children.” American Journal of Public Health 96(9):1570–71.
Cawley, John, and Joshua Price. 2011. “Outcomes in a Program that Offers Financial Rewards for Weight Loss.” Chapter 4 in Economic Aspects of Obesity, ed. Michael Grossman and Naci Mocan, 91–126. Chicago Ill.: NBER and University of Chicago Press.
Charness, Gary, and Uri Gneezy. 2009. “Incentives to Exercise.” Econometrica 77(3):909–31. Cuffe, Harold E., William T. Harbaugh, Jason M. Lindo, Giancarlo Musto, and Glen R.
Waddell. 2011. “Evidence on the Effi cacy of School- Based Incentives for Healthy Living.”
NBER Working Paper No. 17478, Cambridge, Mass.: NBER.
Fryer, Roland. 2011. “Teacher Incentives and Student Achievement: Evidence from New York City Public Schools.” NBER Working Paper No. 16850, Cambridge, Mass.: NBER. Gneezy, Uri, and Aldo Rustichini. 2000. “Pay Enough or Don’t Pay at All.” Quarterly Journal
of Economics 115(3):791–810.
Gneezy, Uri, Stephan Meier, and Pedro Rey- Biel. 2011. “When and Why Incentives (Don’t) Work to Modify Behavior.” Journal of Economic Perspectives 25(4):1–21.
Gordon, Anne, and Patricia McKinney. 1995. “Sources of Nutrients in Students’ Diets.” Ameri-can Journal of Clinical Nutrition 61(1):232S- 40S.
Table A2
Change in behavior during the non- treatment period
Ate a
Time trend (days) –0.0161 –0.0134 –0.0057
[0.0107] [0.0133] [0.0108]
B. Full set of days at control schools (N=32)
Time trend (days) –0.0019 –0.0016 0.0029
[0.0053] [0.0074] [0.0042]
Gortmaker, Steven, Lilian Cheung, Karen Peterson, Ginny Chomitz, Jay Hammond Cradle, Hank Dart, Mary Kay Fox, Reba Bullock, Arthur Sobol, Graham Colditz, Alison Field, and Nan Laird. 1999. “Impact of a School- Based Interdisciplinary Intervention on Diet and Physical Activity Among Urban Primary School Children: Eat Well and Keep Moving.”
Archives of Pediatrics and Adolescent Medicine 153(9):975–83.
Kivetz, Ran, and Itamar Simonson. 2002. “Earning the Right To Indulge: Effort as a Determi-nant of Customer Preference Toward Frequency Program Rewards.” Journal of Marketing Research 39(2):155–70.
Krebs- Smith, Susan, Annetta Cook, Amy Subar, Linda Cleveland, James Friday, and Lisa Kahle. 1996. “Fruit and Vegetable Intakes of Children and Adolescents in the United States.” Archives of Pediatrics and Adolescent Medicine 150(1):81–86.
Kremer, Michael, Edward Miguel, and Rebecca Thornton. 2009. “Incentives to Learn” Review of Economics and Statistics 91(3):437–56.
Laibson, David. 1997. “Golden Eggs and Hyperbolic Discounting.” Quarterly Journal of Economics 112(2):443–77.
Lepper, Mark, David Greene, and Richard Nisbett. 1973. “Undermining Children’s Intrinsic Interest with Extrinsic Reward: A Test of the ‘Overjustifi cation’ Hypothesis.” Journal of Personality and SocialPsychology 28(1):129–37.
Lowe, C., P. Horne, K. Tapper, M. Bowdery, and C. Egerton. 2004. “Effects of a Peer Model-ling and Rewards- Based Intervention to Increase Fruit and Vegetable Consumption in Children.” European Journal of Clinical Nutrition 58(3):510–22.
Malotte, C. Kevin, Fen Rhodes, and Kathleen Mais. 1998. “Tuberculosis Screening and Com-pliance with Return for Skin Test Reading Among Active Drug Users.” American Journal of Public Health 88(5):792–96.
Meier, Stephan. 2007. “Do Subsidies Increase Charitable Giving in the Long Run? Match-ing Donations in a Field Experiment.” Journal of the European Economic Association
5(6):1203–22.
Moran, William, Karen Nelson, James Wofford, Ramon Velez, and Douglas Case. 1996. “Increasing Infl uenza Immunization Among High- Risk Patients: Education or Financial Incentive?” American Journal of Medicine 101(6):612–20.
Muñoz, Kathryn, Susan Krebs- Smith, Rachel Ballard- Barbash, and Linda Cleveland. 1997. “Food Intakes of U.S. Children and Adolescents Compared With Recommendations.”
Pediatrics 100(3):323–29.
Perry, Cheryl, Donald Bishop, Gretchen Taylor, David Murray, Rita Mays, Bonnie Dudovitz, Mary Smyth, and Mary Story. 1998. “Changing Fruit and Vegetable Consumption Among Children: The 5- a- Day Power Plus Program in St. Paul, Minnesota.” American Journal of Public Health 88(4):603–609.
Perry, Cheryl, Donald Bishop, Gretchen Taylor, Marsha Davis, Mary Story, Clifton Gray, Susan Bishop, Rita Mays, Leslie Lytle, and Lisa Harnack. 2004. “A Randomized School Trial of Environmental Strategies to Encourage Fruit and Vegetable Consumption Among Children.” Health Education and Behavior 31(1):65–76.
Rainville, Alice. 2001. “Nutritional Quality of Reimbursable School Lunches Compared to Lunches Brought From Home in Elementary Schools in Two Southeastern Michigan Districts.” Journal of Child Nutrition and Management 25(1):13–18.
Schwartz, Marlene. 2007. “The Infl uence of a Verbal Prompt on School Lunch Fruit Con-sumption: a Pilot Study.” International Journal of Behavioral Nutrition and Physical Activity 4:6.
Sweitzer, Sara, Margaret Briley, and Cindy Robert- Gray. 2009. “Do Sack Lunches Provided by Parents Meet the Nutritional Needs of Young Children who Attend Child Care?” Journal of the American Dietetic Association 109(1):141–44.
Lowenstein. 2008. “Financial Incentive–Based Approaches for Weight Loss: A Randomized Trial.” Journal of the American Medical Association 300(22):2631–37.
Volpp, Kevin, Andrea Levy, David Asch, Jesse Berlin, John Murphy, Angela Gomez, Harold Sox, Jingsan Zhu, and Caryn Lerman. 2006. “A Randomized Controlled Trial of Financial Incentives for Smoking Cessation.” Cancer Epidemiology, Biomarkers and Prevention