T H E J O U R N A L O F H U M A N R E S O U R C E S • 47 • 1
Upper Secondary School
Evidence from a Large-Scale Pilot Scheme
Caroline Hall
A B S T R A C T
By exploiting an extensive pilot scheme that preceded an educational re-form, this paper evaluates the effects of introducing a more comprehensive upper secondary school system in Sweden. The reform reduced the differ-ences between academic and vocational tracks through prolonging and in-creasing the academic content of the latter. As a result, all vocational stu-dents became eligible for university studies. The results suggest that the policy change increased the amount of upper secondary schooling obtained among vocational students, but did not affect enrollment in university stud-ies or students’ earnings later in life.
I. Introduction
A much debated issue within education policy is whether, and at what age, students should be separated into academic and more vocationally oriented educational tracks. Across OECD countries, there is great diversity regarding the age at which this type of tracking1is done. Some countries, for example the United States and Spain, do not track students across schools, while others, for example Austria and Germany, separate students into different types of schools already at the
1. The meaning of the term ‘tracking’ differs between Europe and the US. While in Europe tracking generally refers to the streaming of students into academic and vocational educational tracks, in the US it rather signifies ability grouping within schools. In this paper, I use the term to refer to the former type of selection.
Caroline Hall is a researcher at the Institute for Labor Market Policy Evaluation (IFAU) and a research fellow at Uppsala Center for Labor Studies (UCLS). She thanks Richard Blundell, Peter Fredriksson, Erik Gro¨nqvist, Per Johansson, Oskar Nordstro¨m Skans, Tuomas Pekkarinen, Jeff Smith, Bjo¨rn O¨ ckert, and two anonymous referees for valuable comments. The paper has also benefitted from comments by participants at the RTN meeting in Microdata: Methods and Practices at Central European University and by seminar participants at Ragnar Frisch Centre for Economic Research, IFAU and Department of Economics, Uppsala University. Data are available from IFAU, Box 513, 751 20 Uppsala, Sweden, ifau@ifau.uu.se,Ⳮ46 18 471 7070.
[Submitted Unknown ; accepted Unknown ]
age of 10. Countries also differ in terms of the number of educational tracks available as well as regarding the extent of curricular differences among the available tracks.2 Since the Second World War, there has been a tendency in many OECD countries towards adopting more comprehensive school systems (see, for example, Leschinsky and Mayer 1990). The effects of such policy changes have generally been difficult to evaluate as the reforms have often coincided with other major changes of the education systems3 or been implemented at the same time across a whole nation. Such implementation schemes naturally make it difficult to separate the effects of reduced tracking per se from those of other concurrent changes or cohort effects. The consequences of many of these reforms therefore remain disputed.
This paper evaluates the effects of introducing a more comprehensive upper sec-ondary school system in Sweden by using a pilot scheme, which preceded a major educational reform. In 1991, the Swedish Parliament decided on a reform which substantially reduced the differences in curricula between the academic and voca-tional tracks in upper secondary school. This was done by considerably increasing the academic content of all vocational tracks. The length of these tracks was at the same time extended from two to three years, giving them the same length as the academic tracks. As a result of these changes, students graduating from vocational tracks attained basic eligibility for university studies. The reform was preceded by a six-year pilot-period in which the new vocational tracks were evaluated in some municipalities. As the pilot did not coincide with any other changes of the upper secondary school system, it can be used to identify the effects of introducing more academic vocational tracks on students’ educational and labor market outcomes.
In theory there are compelling arguments both in favor of and against this type of shift towards a more comprehensive school system. Opponents of the 1991 reform argue that not all students may benefit from an upper secondary education with a substantial academic content. To make everyone pursue such a track may be a waste of resources, since it retains into academic education individuals who may lack the ability to benefit from it or who have already made up their mind to pursue a non-academic career (Brunello and Checchi 2007). This could potentially even cause some students to drop out of upper secondary school and consequently have a neg-ative impact on their educational attainment.
Proponents of the reform instead argue that it is advantageous that students no longer have to choose a definitive educational direction, which may restrict them in the future, at an early age. Educational systems with early tracking are exposed to the risk of students ending up in the wrong track as it may be difficult to anticipate future educational performance at an early point in the educational career (see, for example, Brunello, Ariga, and Giannini 2004). Also, the willingness to proceed up the educational ladder may not yet be well formed. The consequences of choosing
2. See OECD (2004, p. 262) for a comparison of structural features of school systems across the OECD countries.
the wrong track should be mitigated when all tracks enable students to continue to higher education. This argument is frequently brought up with regard to students whose parents have low education, as they are thought to often end up in vocational tracks for reasons unrelated to their ability.4,5
There are some previous studies which also investigate the effects of adopting a more comprehensive school system using within-country variation in tracking re-gimes. The abolition of tracking in British secondary schools during the 1960s and 1970s is a particularly well-studied case; see, for example, Galindo-Rueda and Vig-noles (2005) and Kerkhoff et al. (1996). As this reform took place gradually, it produces a setup with regional variation in students’ exposure to the comprehensive system. Manning and Pischke (2006) however show that the regions that chose to implement the reform early were systematically different from the late adopters, and argue that studies exploiting this variation are unlikely to remove the selection bias between pupils attending different types of schools. There is also a recent study by Malamud and Pop-Eleches (2010) which evaluates a Romanian reform which post-poned tracking of students into vocational and academic schools. Using a regression discontinuity design they find no effects of this reform on university completion, labor market participation or earnings.
Other researchers have tried to estimate the effects of different tracking regimes by utilizing cross-country variation in these policies; see, for example, Hanushek and Wo¨ssman (2006). Such studies face the difficulty of accounting for all unob-served country-specific factors which are correlated with the choice of tracking re-gime, and which also affect students’ performance. Failure to do this will lead to biased estimates. Waldinger (2007) finds that the results of this literature are very sensitive to model specification as well as to which countries are included in the analysis.
The identification strategy used in this paper takes advantage of variation across regions and over time in the implementation of the pilot which preceded the reform.6 The institutional setup creates a source of potentially exogenous variation in expo-sure to the new tracks which I use to account for non-random selection into different educational tracks. To ensure that the results are not driven by selective migration of students across municipalities, I define exposure based on the students’ residence before they complete compulsory school. I also present results which indicate that the location of pilot slots was exogenous to student characteristics.
The empirical analysis is based on data from administrative registers which cover the entire Swedish working-age population annually during 1985–2008. The records
4. A country’s choice of tracking policy may also affect students’ performance through the quality of their peers; see, for example, Jackson (2010) and Pop-Eleches and Urquiola (2008). Moreover, a selective school system is generally favored by the view that it is easier to teach homogenous classes; see, for example, Duflo, Dupas, and Kremer (2008). The 1991 reform did not necessarily alter the composition of students in academic versus vocational tracks. Thus, we should not expect any major effects of the reform operating through these channels.
5. See, for example, Brunello and Checchi (2007) for a more extensive discussion of the relative merits of a comprehensive versus a selective school system.
include a large number of standard individual characteristics (age, place of residence, country of birth, income etc.) as well as detailed information on the individuals’ educational history. The data also links individuals to their biological parents.
The results show that the introduction of more comprehensive upper secondary schooling—through prolonging and adding more academic content to the vocational tracks—increased educational attainment among vocational students. The probability of having obtained at least three years of upper secondary education by age 31 is estimated to have increased by around 40 percentage points, as a consequence of enrolling in a three- rather than a two-year vocational track. But enrolling in a longer and more academic vocational track does not seem to have had an effect on edu-cational attainment beyond the upper secondary level. Neither does it seem to have affected earnings later in life. The results further indicate that the effect on educa-tional attainment may have been negative for some students: To enroll in a longer vocational track increased the probability of dropping out among students with a low compulsory school GPA and with non-academic parents.
II. The 1991 Reform of Upper Secondary School and
the Pilot
All individuals who have completed nine years of compulsory schooling are entitled to upper secondary education. Schooling at the upper secon-dary level is voluntary although the vast majority of students choose to attend. Among those who finished compulsory schooling in 1988, almost 90 percent con-tinued directly to upper secondary education (Palme 1992, p. 207). Upper secondary school comprises several different educational tracks to which individuals apply based on their grades from compulsory school. Students generally attend a school in their municipality of residence, but if the desired track is not offered they can instead choose to attend it in a nearby municipality.
Individuals who are older than 20 when they begin upper secondary education are not entitled to attend a general upper secondary school, but instead enter the adult education system. Within this system, both those who lack any upper secondary education and those who dropped out before graduating can finalize a degree. It is also possible to supplement a two-year upper secondary degree in order to obtain a three-year degree.
In 1991 the Swedish Parliament decided on a major reform of upper secondary education.7The reform can be categorized as a step from a selective towards a more comprehensive upper secondary school system. Before the reform, upper secondary education consisted of a few academic and several vocational tracks. The vocational tracks were two years long and consisted mainly of vocational training. The aca-demic tracks typically lasted three years and prepared the students for higher edu-cation.
The general aim of the 1991 reform was to bring about a higher quality of edu-cation as well as to increase the flexibility of the upper secondary school system.
The largest changes concerned the vocational tracks, which through the inclusion of several general theoretical subjects in the curriculum received a considerably higher academic content. The length of the vocational tracks was also extended from two to three years, giving them the same length as the academic tracks. These changes were motivated by the view that there was an increasing need for a broader education in working life as well as by the desire to enable everyone to continue to university studies. As a result of the reform, all students graduating from a vocational track attained basic eligibility for university studies.8
A. The Pilot with Prolonged Vocational Tracks
Concerns about the vocational upper secondary education had been raised all through the 1980s (see, for example, Prop. 1983/84:116). In 1984 the government appointed a committee with the task of reviewing the vocational education system and putting forward suggestions for improvements. The proposals led to a nationwide pilot pe-riod starting in 1988, in which new three-year vocational tracks were tried out in some municipalities.9
The three-year vocational tracks in the pilot had increased academic content com-pared to the ordinary two-year tracks. While Swedish was the only general theo-retical subject included in all two-year tracks, the pilot tracks also contained English, social studies and an elective course. Math appears to be by far the most common choice of elective.10As a result of these additions, students graduating from the pilot tracks attained basic eligibility for university studies. Another difference between the two- and three-year tracks is that the latter located a larger share of the vocational training in workplaces rather than in schools.11
1. The Implementation of the Pilot12
The pilot contained about 6,000 available places in 1988, 10,000 in 1989, and 11,200 in 1990. This represented approximately 11–20 percent of the total number of avail-able places in vocational tracks (NBE 1989a; NBE 1989b; NBE 1990b). A class in the pilot would always replace a class in a corresponding two-year track, implying that the total number of available places in vocational tracks was not expanded. On top of this, in 1987 there was a very limited pre-pilot scheme only including 500 places. The tracks in the pre-pilot differed somewhat from those in the pilot as they did not contain more extensive workplace training.
The National Board of Education (NBE) was responsible for allocating the pilot among the different vocational tracks, as well as for deciding in which municipalities
8. Note that ‘basic eligibility’ does not mean eligibility to all university programs as some have special requirements.
9. See Prop. 1987/88:102 for a description of the pilot.
10. NBE (1990a) reports that 86 percent of the students in 1988 chose to study math.
11. Compared to the pilot tracks, the three-year tracks that were implemented after the 1991 reform contained even more academic subjects and somewhat less training in workplaces.
it should be located. The allocation of places among the different tracks was done on the basis of proportionality; the goal was that each track should receive the same share of available three-year places as they received of two-year places. There were however some deviations from this principle. For example, tracks with a small num-ber of places were somewhat overrepresented. The allocation decision was further restricted by the fact that in the beginning of the pilot period no curricula had yet been prepared for some of the three-year tracks. This meant that all vocational tracks could not be included in the pilot the first years. Table 1 shows which tracks were included each year as well as each track’s number of available and share of vacant places.13
Regarding the geographical location of the pilot, the Government stipulated that it should be distributed among regions with different industry and population struc-tures. There should also be variation regarding the extent to which different regions participated. In some participating regions, all or a large share of the vocational tracks should be converted to three-year tracks, while in other regions only a few of the tracks should be prolonged. The motive behind these requirements was to get an idea of how the more extensive workplace training worked in different types of labor markets, as well as of the strain on the local labor market if it was implemented on a large scale. On top of these criteria, the NBE tried to assess whether the local labor market would be able to arrange the extended workplace training in a relatively short time. To judge this they relied upon recommendations from employer and union representatives in different sectors. This concern seems to have meant that some priority was given to municipalities which had a tradition of using workplace training in the vocational education. The initiative to participate always came from the municipalities themselves as they had to apply in order to be considered. The interest to participate was large; each year there were applications for far more places than what was available.
Sweden had 284 municipalities during this time period. Only about 68 percent of them offered vocational tracks. Students residing in the other municipalities hence had to attend a school in a nearby municipality if they wanted to obtain a vocational degree. Figure 1 illustrates the share of (all) municipalities that participated in the pilot each year, as well as how the extent of their participation varied over time. The prepilot in 1987 only involved 22 municipalities, all of which participated to a quite small extent. When the actual pilot was introduced in 1988, about 40 percent of the municipalities were granted participation. In 1990, this share had increased to about 52 percent. The extent to which the municipalities participated also in-creased each year. Thus, throughout the pilot period the pilot was extended both to new municipalities as well as often to more tracks within already participating mu-nicipalities.
All through the pilot period most participating municipalities came to offer both two- and three-year vocational tracks. Sometimes the exact same track was offered in both lengths within the same municipality. Even in municipalities only offering either two- or three-year tracks, students could in some cases have a choice of
Hall
243
1987 1988 1989 1990
Number of places
Share vacant
Number of places
Share vacant
Number of places
Share vacant
Number of places
Share vacant
Electrical engineering 48 0.00 528 0.02 656 0.03 776 0.02 Health care 46 0.02 2,182 0.03 2,918 0.03 3,072 0.10 Heating, ventilation and sanitation 64 0.11 64 0.00 72 0.00 104 0.00 Industry 352 0.01 1,608 0.09 1,952 0.13 1,968 0.12 Business and services 210 0.01 660 0.03 990 0.05 Caring services: children, youth 256 0.01 420 0.01 420 0.08 Construction 296 0.08 408 0.02 432 0.01 Textile and clothing manufacturing 136 0.11 208 0.22 224 0.17 Transport and vehicle engineering 752 0.04 992 0.03 1,056 0.02 Use of natural resources 352 0.12 640 0.09 720 0.04 Constructional metalwork 56 0.14 56 0.05 Food manufacturing 224 0.08 256 0.11
Handicraft 32 0.03 64 0.05
Painting 56 0.04 88 0.05
Process technology 176 0.17 208 0.23
Restaurant 336 0.00 416 0.00
Wood technology 144 0.10 168 0.09
Graphic 112 0.00
Total 510 0.03 6,384 0.05 9,950 0.06 11,130 0.07
Figure 1
Share of Municipalities That Participated in the Pilot Each Year, and the Extent of Their Participation
Notes: ‘% 3-year tracks’ is the percent of all vocational tracks available in a municipality which were part of the pilot.
program length if a nearby municipality offered tracks of a different length. The design of the pilot thus generates a setting where some students were given the choiceof attending a three-year rather than an ordinary two-year vocational track. The degree to which a student had this choice depended on where he or she lived as well as on which year he or she began upper secondary school.
III. Estimating the Impact of the Prolongation of
Vocational Upper Secondary Education
A. Data
The data used in the paper come from different administrative records maintained by Statistics Sweden. The records cover the entire Swedish population during 1985– 2008. One of the central registers for this study is the Upper secondary school application record, which contains information on when and where an individual began upper secondary school as well as what track (type and length) he or she enrolled in.
In the main analysis I focus on those who began vocational tracks. An additional restriction imposed is that only pilot tracks which corresponded to regular two-year tracks are included, and vice versa.14This population consists of 202,072 individuals. Almost 9 percent, however, are excluded due to missing information on some of the variables, giving me a final sample of 184,101 persons.
To these data I have linked information on the individuals’ later educational at-tainment and earnings, as well as some background variables. Educational atat-tainment is measured 15 years after enrollment in upper secondary school, which means that it is generally measured at age 31. I have information on whether the person’s highest education level is at least three years of upper secondary education; whether he/she has enrolled in university studies; and on whether he/she has completed a university degree. The earnings measure is defined as the annual sum of the individuals’ gross wage earnings (in SEK 2008). I consider earnings for 18 years after the person began upper secondary school; that is, up until age 34 for most individuals.
The individual background variables include: sex; immigrant background (defined as born in a non-Nordic country); GPA the last year of compulsory school; and municipality of residence the year before applying to upper secondary school. The students have also been linked to their biological parents in order to obtain infor-mation on the parents’ highest education level and their immigrant background.
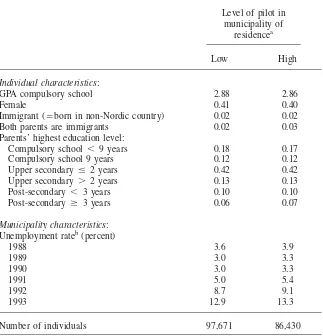
Table 2 presents descriptive statistics for the background variables. (Descriptive statistics for the outcomes are presented in the next section.) The individuals are separated into two groups based on the degree to which their municipality of resi-dence participated in the pilot. Municipalities with an above-average share of three-year tracks in 1990 are considered ‘high level’ regions, while those with a below-average share are referred to as ‘low level’ regions.15The average share of three-year tracks in 1990 was 0.18. The table shows that the two groups are very similar in terms of all observed characteristics.
The table also shows the local unemployment rate during the relevant time period. We can see that the unemployment rate in general was somewhat higher in munic-ipalities that participated to a high degree in the pilot. This indicates that the pilot does not seem to have been systematically located in regions with better labor market prospects. It is also important to note the dramatic increase in the unemployment rate in the beginning of the 1990s. This was a turbulent period on the Swedish labor market.
B. Identification Strategy
The purpose of this paper is to evaluate the effects of the prolongation of vocational upper secondary education on individuals’ educational attainment and earnings. The following econometric model characterizes the effect of attending a three- rather than a two-year vocational track on an individual’s educational or labor market outcome:
Y ⳱␥Ⳮ ⳭD Ⳮ␦XⳭε
(1) ijk j k ijk i ijk
14. This restriction excludes students in the three-year Graphic and Handicraft tracks.
Table 2
Summary Statistics for the Sample of Vocational Students
Level of pilot in municipality of
residencea
Low High
Individual characteristics:
GPA compulsory school 2.88 2.86
Female 0.41 0.40
Immigrant (⳱born in non-Nordic country) 0.02 0.02
Both parents are immigrants 0.02 0.03
Parents’ highest education level:
Compulsory school ⬍ 9 years 0.18 0.17
Compulsory school 9 years 0.12 0.12
Upper secondary ⱕ 2 years 0.42 0.42
Upper secondary ⬎ 2 years 0.13 0.13
Post-secondary ⬍ 3 years 0.10 0.10
Post-secondary ⱖ 3 years 0.06 0.07
Municipality characteristics: Unemployment rateb(percent)
1988 3.6 3.9
1989 3.0 3.3
1990 3.0 3.3
1991 5.0 5.4
1992 8.7 9.1
1993 12.9 13.3
Number of individuals 97,671 86,430
Note: “High level” are municipalities where the share of three-year tracks was above the average (⳱0.18) in 1990.
a. Municipality of residence the year before enrollment in upper secondary school.
b. Unemployment is measured at the county level and includes participants in labor market programs.
Estimating Model 1 with Ordinary Least Squares (OLS) may lead to biased es-timates as ε
ijkandDijkare likely to be correlated. Even if we have a rich data set of individual characteristics, it seems unlikely that we would be able to control for all factors which are correlated with the individual’s choice of track length and which also affect his or her later educational or labor market outcomes.
The pilot however provides us with a potential source of exogenous variation in track length, which can be exploited in order to estimate the causal effect of attending a three-year vocational track. As we have seen, the pilot gave some students the choice of attending a three- rather than a regular two-year vocational track. The extent to which a person had this choice depended on which year he or she finished compulsory school—as the pilot was introduced gradually over time—as well as on where he or she lived—as the degree to which municipalities participated in the pilot greatly varied. After controlling for cohort and municipality of residence (dur-ing compulsory school), individuals’ exposure to the pilot is potentially exogenous to the unobserved component of the outcomes of interest and can consequently be used as an instrument for the length of the chosen track (Dijk).16
I will estimate the model using Two Stage Least Squares (2SLS). The first stage can be written as:
D ⳱␥Ⳮ Ⳮ␣P ⳭXⳭv
(2) ijk j k jk i ijk
The instrument, denoted byPjk, is the extent to which the individual’s municipality of residence participated in the pilot by the time he or she began upper secondary school, measured as the share of the available vocational tracks which constituted three-year tracks.17Ideally,Pjkwould be measured as the share of the available slots in vocational tracks which represented three-year tracks, but such data are not avail-able at a disaggregated level. I measure municipality of residence during the fall semester of the individual’s last year of compulsory school. This means that, unlike municipality of upper secondary school attendance, it is likely to be exogenous with respect to the location of the pilot. In general it seems implausible that students would move during compulsory school as a consequence of the introduction of three-year vocational tracks, especially as it was already possible to apply to upper sec-ondary schools in municipalities other than one’s own. This assertion is also sup-ported by the fact that the decision of where to locate the new available pilot places each year was not taken until during the following spring; that is, after the point in time when I measure municipality of residence.18
Pjkis a valid instrument for the length of the vocational track under the assumption that it is not correlated with any unobserved variables affecting the outcomes of interest, and that it had no impact on the outcomes other than through influencing whether the person enrolled in a two- or a three-year track. This entails assuming that the availability of pilot tracks did not affect the individual’s choice of whether
16. Similar identification strategies have been used in earlier studies; see, for example, Duflo (2001). 17. Pjkis zero for municipalities not offering any vocational tracks.
to begin a vocational track at all. If the pilot tracks attracted students from academic tracks or students who would otherwise have chosen not to attend upper secondary school, the individual’s untreated state is not clear and the results will consequently be hard to interpret. This assumption is tested below. Of course, for the method to workPjkmust also have explanatory power in the first stage.
If the effect of attending a three-year track varies across individuals, the instru-mental variables (IV) estimate should be interpreted as the effect for individuals who, due to the availability of pilot tracks in their home municipality, chose to begin a three-year rather than a two-year track (see Imbens and Angrist 1994). For this interpretation to be correct, the following monotonicity assumption must hold: In-creased availability of pilot tracks in a municipality must never have deIn-creased participation in three-year tracks among those living in that municipality.
The vector of individual characteristics (Xi) in the model includes final GPA from compulsory school, sex, immigrant background, the parents’ highest education level and whether both of the parents have immigrant background. An additional factor which is potentially important to account for is the local unemployment rate when the individual finished upper secondary school. As was shown in Table 2, the un-employment rate rose steeply in the beginning of the 1990s. This means that students following a three-year track systematically graduated under worse labor market con-ditions than those attending a regular two-year track. Not accounting for this implies that the estimated effect of attending a three-year track will include the effect of graduating in a worse labor market situation. I will return to this issue when I present the results; see Section IV.
1. Descriptive Analysis
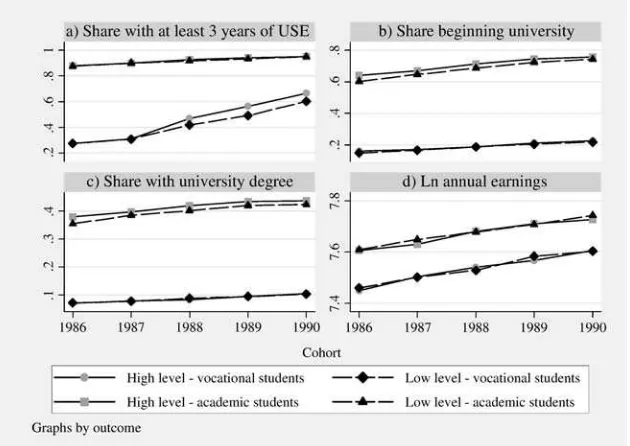
Figure 2 illustrates the basic idea behind the identification strategy. It shows means of the outcome variables for the different cohorts included in the study, starting with those who enrolled in upper secondary school the year before the pilot was launched (that is, in 1986). The individuals are additionally separated into ‘high’ and ‘low level of pilot’ regions based on where they lived the year before they began upper secondary school. As before, municipalities with an above average share of three-year tracks in 1990 are considered “high-level” regions, and those with a below-average share are referred to as “low-level” regions. In addition to the vocational students, the table includes academic students whose outcomes should be unaffected by the prolongation of the vocational tracks.
Figure 2
Means of Outcome Variables by Cohort and Level of Pilot
Notes: ‘High level’ are municipalities where the share of three-year tracks was above the average (⳱0.18) in 1990. USE⳱Upper secondary education. Earnings are measured 18 years after enrollment in USE.
However, it increases more in the high level regions (the difference between students from the two types of regions is statistically significant for the last three cohorts), suggesting that the pilot led to an increased education level among vocational stu-dents.
For academic students on the other hand, there is no detectable difference in trends between the high and low level regions. This should give some reassurance to the identification strategy, as it indicates that trends in educational attainment might have been similar also for the vocational students in the absence of the pilot.
For the other variables capturing educational attainment—the share beginning uni-versity studies and the share obtaining a uniuni-versity degree—there appears to be no difference between vocational students from the two types of municipalities. This is the case for all cohorts. The figure thereby indicates that the prolongation of the vocational tracks had no effect on these outcomes. Nor does it seem to have had an impact on the vocational students’ earnings 18 years later. As for the first outcome, there is no evidence of divergent trends for academic students.
2. Evaluating the Identifying Assumptions
As discussed earlier, it is possible that the prolongation of the vocational tracks influenced an individual’s choice of whether to obtain an academic or a vocational degree, and whether to enroll in upper secondary school at all. If this is the case, restricting the sample to vocational students may introduce some sample selection issues that could lead to bias in the results. Below I present some results indicating that selection into vocational tracks was not affected by the pilot. I also show some results suggesting that the location of pilot slots was exogenous to the individuals.
Table 3A shows the share of upper secondary school students that enrolled in vocational tracks before and after the full implementation of the pilot (that is, in 1986 and 1990). The shares are calculated separately for municipalities that partici-pated in the pilot to different extents. We can see that the share beginning vocational tracks decreases slightly over time. There are, however, no significant differences in this pattern between municipalities that participated in the pilot to a higher or a lower degree. It is of course possible that the composition of students who enrolled in vocational tracks still changed, although the actual number of students did not. To provide some evidence on whether this seems to be the case, I have percentile ranked all upper secondary school students (within cohort) according to their com-pulsory school GPA.19Part B shows how the average rank of the vocational students changed during the pilot period in the two types of municipalities. There is a sig-nificant reduction in the average academic quality of these students over time, but the pattern does not seem to differ depending on the municipalities’ participation in the pilot.
Parts C and D show similar exercises, but is instead comparing those who enrolled in upper secondary school a certain year to all those who finished compulsory school the same year. Since the first year for which there are data on compulsory school graduation is 1988, I here compare changes between 1988 and 1990. The number of pilot slots in 1990 was almost double that of 1988. Thus, any divergent trends in upper secondary school enrollment arising as a consequence of the pilot are likely to be visible also by comparing these years. In Part C we can see that there is no significant change in the share continuing to upper secondary school in either group of municipalities. The results in Part D show that, while the average rank of those continuing to upper secondary school increases somewhat over time, this pattern does not seem to be affected by the municipalities’ participation in the pilot.
Based on these findings, it seems unproblematic to restrict the sample to vocational students. It is reassuring, nevertheless, to note that all results presented in the paper also hold in the full sample of upper secondary school students; see Table A1 in the appendix.
Because the model I estimate controls for municipality fixed effects, it is not necessary for the localization of pilot slots to be unrelated to municipality charac-teristics. What is of concern is whether there are different trends in unobserved characteristics across municipalities that participated to different extents. The avail-able documentation (see Section II) suggests that the selection of pilot municipalities
Hall
251
A. Share of Those Enrolling in USE Who Began Vocational Tracks
B. Average Percentile Rank of Those Who Began Vocational Tracks
Level of Pilot in Municipality of Residence Level of Pilot in Municipality of Residence
High Low Difference High Low Difference
Enrolling in 1990 0.411 0.427 ⳮ0.015 29.73 29.78 ⳮ0.05
(0.015) (0.008) (0.017) (0.280) (0.291) (0.403)
Enrolling in 1986 0.430 0.442 ⳮ0.012 30.96 31.47 ⳮ0.51
(0.018) (0.009) (0.020) (0.367) (0.324) (0.488)
Difference ⳮ0.019** ⳮ0.015*** ⳮ0.004 ⳮ1.23*** ⳮ1.69*** 0.46
(0.008) (0.005) (0.009) (0.388) (0.354) (0.524)
C. Share of Those Finishing Compulsory School Who Continued Directly to USE
D. Average Percentile Rank of Those Who Continued to USE
Level of Pilot in Municipality of Residence Level of Pilot in Municipality of Residence
High Low Difference High Low Difference
Finishing in 1990 0.853 0.856 ⳮ0.003 53.99 53.72 0.264
(0.006) (0.004) (0.007) (0.500) (0.378) (0.625)
Finishing in 1988 0.856 0.857 ⳮ0.001 53.46 53.24 0.218
(0.005) (0.004) (0.006) (0.509) (0.390) (0.640)
Difference ⳮ0.002 ⳮ0.001 ⳮ0.001 0.531** 0.485** 0.046
(0.003) (0.004) (0.005) (0.205) (0.198) (0.285)
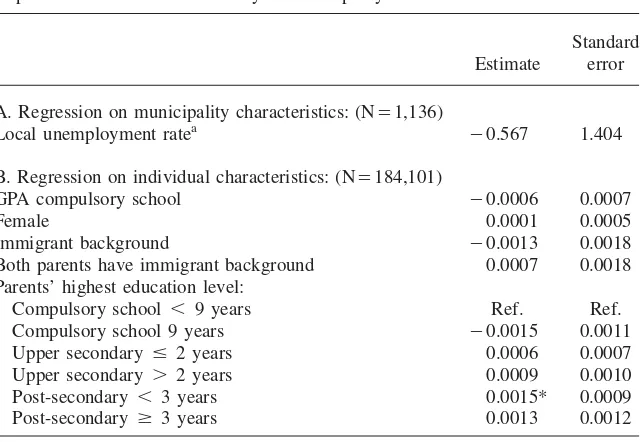
Table 4
Correlation between Pilot Intensity and Sample Characteristics
Dependent variable: Pilot intensity in municipality of residence
Estimate
Standard error
A. Regression on municipality characteristics: (N⳱1,136)
Local unemployment ratea ⳮ0.567 1.404
B. Regression on individual characteristics: (N⳱184,101)
GPA compulsory school ⳮ0.0006 0.0007
Female 0.0001 0.0005
Immigrant background ⳮ0.0013 0.0018
Both parents have immigrant background 0.0007 0.0018
Parents’ highest education level:
Compulsory school ⬍ 9 years Ref. Ref.
Compulsory school 9 years ⳮ0.0015 0.0011
Upper secondary ⱕ 2 years 0.0006 0.0007
Upper secondary ⬎ 2 years 0.0009 0.0010
Post-secondary ⬍ 3 years 0.0015* 0.0009
Post-secondary ⱖ 3 years 0.0013 0.0012
Notes: Both regressions include fixed effects for municipality of residence, and cohort (Regression B) or year (Regression A). Robust standard errors. Standard errors for Regression B allow for clustering by municipality of residence. * denotes significance at the 10 percent level. ** denotes significance at the 5 percent level. *** denotes significance at the 1 percent level.
a. Unemployment is measured at the county level and includes participants in labor market programs.
was based largely on variables that are likely to have remained relatively constant throughout the relevant time period, for instance industry and population structure. But it was also based on the ability of the local labor market to arrange extended workplace training. One potential concern is if the NBE systematically selected municipalities with favorable developments on the labor market. In order to check, this I have regressed the pilot intensity on the local unemployment rate, controlling for year and municipality fixed effects. The results, which are reported in Table 4(a), shows that the placement of the pilot is not correlated with changes in the unem-ployment rate.
IV. Results
A. The Effect of the Pilot on the Choice of Track Length
Before presenting the results from the instrumental variables estimation, I report estimates for the first stage relationship, showing that the intensity of the pilot in an individual’s municipality of residence is a good predictor of his or her choice of track length. This section also gives some additional evidence indicating that the pilot is a valid instrument.
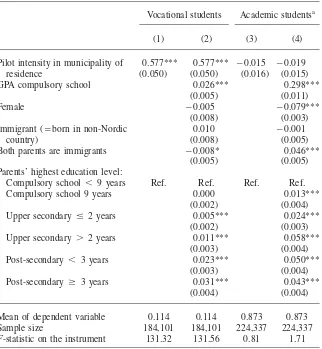
The first two columns of Table 5 present results for the first stage relationship. Column (1) reports estimates from a regression containing only the instrument and cohort and municipality-of-residence fixed effects. In Column (2) all individual char-acteristics are included. We can see that the coefficient for the instrument is very robust to the inclusion of additional covariates. The estimate reveals that the pilot intensity in a person’s home municipality has a clear impact on the probability that he/she begins a three- rather than a two-year vocational track. The coefficient is statistically significant at the 1 percent level and suggests that increasing the share of three-year tracks by, for instance, 50 percentage points in a person’s home mu-nicipality on average increases the probability that he/she begins a three-year track by nearly 30 percentage points.20The last row of the table reports the F-statistic for the null hypothesis that the coefficient for the instrument is zero. The F-statistic is about 131, which indicates that a weak instrument is not a concern.21
Some of the other variables also have a significant impact on the probability of enrolling in a three-year track. As can be expected, students with a high compulsory school GPA and students with highly educated parents are more likely to choose the longer and more academically oriented vocational track. Gender and immigrant background have no significant impact on the choice of track length, while having immigrant parents is associated with a significantly lower probability of choosing the three-year track.
I have also estimated the first stage regression for the sample of academic stu-dents.22The academic tracks typically lasted three years but there also existed a few two-year options. This can be seen as an additional test for endogeneity: Since the academic tracks were not part of the pilot, there should not be any effect of the pilot intensity on the choice of track length for these students. A significant ‘effect’ would instead suggest the presence of unobserved variables, which are correlated with the pilot intensity.23The results from this test are reported in Columns (3–4) of Table 5. The test gives no sign of an endogenous relationship as the estimate for the pilot is statistically insignificant.
20. The fact that there is not a one-to-one correspondence between the share of three-year tracks and the probability that a person begins such a track, is likely to be mainly explained by the possibility to attend schools outside one’s home municipality, as well as by pilot intensity being measured as the share of three-year tracks rather than share of slots.
21. Staiger and Stock (1997) suggest that an F-statistic⬍ 10 indicates weak instruments.
22. Since one of the academic tracks lasted four years I here estimate the effect on the probability of enrolling in a three-year or longer track.
Table 5
Effects on the Probability of Beginning a Three-year Track
Vocational students Academic studentsa
(1) (2) (3) (4)
Pilot intensity in municipality of residence
0.577*** 0.577*** ⳮ0.015 ⳮ0.019
(0.050) (0.050) (0.016) (0.015)
GPA compulsory school 0.026*** 0.298***
(0.005) (0.011)
Female ⳮ0.005 ⳮ0.079***
(0.008) (0.003)
Immigrant (⳱born in non-Nordic country)
0.010 ⳮ0.001
(0.008) (0.005)
Both parents are immigrants ⳮ0.008* 0.046***
(0.005) (0.005)
Parents’ highest education level:
Compulsory school ⬍ 9 years Ref. Ref. Ref. Ref.
Compulsory school 9 years 0.000 0.013***
(0.002) (0.004)
Upper secondary ⱕ 2 years 0.005*** 0.024***
(0.002) (0.003)
Upper secondary ⬎ 2 years 0.011*** 0.058***
(0.003) (0.004)
Post-secondary ⬍ 3 years 0.023*** 0.050***
(0.003) (0.004)
Post-secondary ⱖ 3 years 0.031*** 0.043***
(0.004) (0.004)
Mean of dependent variable 0.114 0.114 0.873 0.873
Sample size 184,101 184,101 224,337 224,337
F-statistic on the instrument 131.32 131.56 0.81 1.71 Notes: All regressions include cohort and municipality-of-residence fixed effects. Robust standard errors in parentheses allow for clustering by municipality of residence. * denotes significance at the 10 percent level. ** denotes significance at the 5 percent level. *** denotes significance at the 1 percent level. a. As one academic track lasted four years, these regressions estimate effects on the probability of beginning a three-year or longer track.
B. Effects on Educational Attainment
esti-Hall
255
(1) (2) (3) (4) (5) (6) OLS: OLS: OLS OLS 2SLS 2SLS Reduced form Reduced form
A. Dependent variable: At least three years of upper secondary education
Effect of beginning a three-year vocational track
0.411*** 0.388*** 0.403*** 0.403*** (0.006) (0.005) (0.026) (0.024) Effect of pilot intensity in municipality of
residence
0.233*** 0.233*** (0.024) (0.023)
Mean of dependent variable 0.435 0.435 0.435 0.435 0.435 0.435 Sample size 181,445 181,445 181,445 181,445 181,445 181,445
B. Dependent variable: University enrollment
Effect of beginning a three-year vocational track
0.056*** 0.033*** ⳮ0.005 ⳮ0.005 (0.009) (0.005) (0.018) (0.015) Effect of pilot intensity in municipality of
residence
ⳮ0.003 ⳮ0.003 (0.010) (0.009)
Mean of dependent variable 0.184 0.184 0.184 0.184 0.184 0.184 Sample size 184,101 184,101 184,101 184,101 184,101 184,101
The
Journal
of
Human
Resources
Table 6(continued)
(1) (2) (3) (4) (5) (6) OLS: OLS: OLS OLS 2SLS 2SLS Reduced form Reduced form
C. Dependent variable: University degree
Effect of beginning a three-year vocational track
0.039*** 0.026*** 0.003 0.004 (0.007) (0.004) (0.011) (0.010) Effect of pilot intensity in municipality of
residence
0.002 0.002 (0.006) (0.006)
Mean of dependent variable 0.083 0.083 0.083 0.083 0.083 0.083 Sample size 184,101 184,101 184,101 184,101 184,101 184,101
D. Dependent variable: Dropped out of upper secondary school
Effect of beginning a three-year vocational track
0.030*** 0.044*** 0.041** 0.038** (0.005) (0.004) (0.019) (0.019) Effect of pilot intensity in municipality of
residence
0.023** 0.022** (0.011) (0.011)
Mean of dependent variable 0.109 0.109 0.109 0.109 0.109 0.109 Sample size 184,101 184,101 184,101 184,101 184,101 184,101
All individual covariates No Yes No Yes No Yes
mates may be plagued by non-random selection into different educational tracks, and may therefore not be given a causal interpretation. Included in the table are also the reduced-form estimates; that is, the effect of the pilot intensity in a person’s home municipality on his/her educational attainment.
Let us start with Panel A, which shows effects on the probability that a person by age 31 has obtained at least three years of upper secondary education. The re-duced-form regressions show that the pilot had a clear impact on this outcome. The estimates suggest that increasing the share of three-year tracks in a person’s home municipality by, for instance, 10 percentage points on average increased the prob-ability that he/she obtained at least this level of education by 2.3 percentage points. The IV and OLS estimates of the effect of beginning a three-year track are very similar. The preferred model (Column 6) suggests that enrolling in a three-year track increased the probability of obtaining at least this level of education by 40 percentage points. All estimates are highly significant.
Panel B and C show estimated effects on university enrollment and graduation. For these outcomes, the OLS and IV estimates tell different stories: While the OLS estimates show a significant positive effect on both outcomes, the IV estimates sug-gest that enrolling in a three-year track affected neither the probability of starting nor of completing a university degree.24Also the reduced form estimates are close to zero and statistically insignificant. The OLS estimates may be biased upwards; this would be the case if, for instance, students choosing the longer tracks in general were more motivated to pursue higher education than those choosing the shorter options. The difference between the estimates could also be due to that the average effect on university studies for students that were induced to begin a longer track as a result of access to the pilot was lower than the average effect in the total population.
Regarding these outcomes it is important to highlight that students who completed three-year tracks systematically graduated during worse labor market conditions than those completing two-year tracks; see Section III. A higher unemployment rate is likely to increase transitions to higher education, which implies that the effect of attending a three-year track could be overestimated in these regressions (as could the reduced-form effect). However, we may still conclude that the IV results give no indication that beginning a three-year track increased the probability of enrolling in, or graduating from, university studies. Hence, the prolongation of the vocational tracks seems to have increased educational attainment through increasing the amount of upper secondary schooling obtained, but the additional year of schooling does not seem to have caused more students to pursue a university degree.
Also included in the table are some results which indicate that the effect on educational attainment might not have been positive for all students; see Panel D. Beginning a three-year vocational track is associated with a higher probability of not completing upper secondary school. The effect on the probability of dropping out is statistically significant in both the OLS and IV regressions. The preferred
specification (Column 6) suggests that enrolling in a three-year track increased the probability of dropping out by 3.8 percentage points.25It is important to point out, however, that if students dropped out during the third year they still received more schooling compared to if they would have completed a two-year track.26Still, failing to obtain a degree may signal low quality to employers, giving these individuals a more difficult situation on the labor market compared to if they would have com-pleted a two-year degree.
Table 7 shows results from separate regressions by compulsory school GPA and parents’ education (using the preferred model specification). A GPA below the mean compulsory school GPA is here considered ‘low’. ‘Academic parents’ is defined as having at least one parent with more than two years of upper secondary education. The effect on the probability of completing at least three years of upper secondary education is significant and substantial for all sub groups. The point estimate is somewhat higher for low performing than for high performing students, and higher for students with non-academic than with academic parents. This pattern seems rea-sonable since high performing students and students with academic parents are more likely to obtain this level of education even without access to the longer vocational tracks. For none of the groups are there any significant effects on the probability of beginning or completing a university degree.
Regarding the dropout rate, the results indicate that the increase in the probability of dropping out is entirely driven by students with low grades from compulsory school. The estimated effect is large in magnitude for this group; the point estimates suggest an 8.3 percentage point increase in the probability of dropping out due to enrolling in a three-year track. For students with a high GPA, attending the longer track does not seem to have affected the likelihood of dropping out. If the model is instead estimated separately for students with academic and non-academic parents, the results exhibit a similar pattern. Thus, it seems to be among students who, for study purposes, were relatively less advantaged that the probability of dropping out increased as a consequence of the prolongation of the vocational tracks.
C. Effects on Earnings
Let us now turn to the effect of attending a longer and more academic vocational track on annual wage earnings. As was shown in the previous section, the prolon-gation of the vocational tracks caused many individuals to acquire an extra year of upper secondary education. This naturally means that they would enter the labor market one year later than those from the same cohort who attended a two-year track, and consequently would have less work experience. I estimate the effect of enrolling in a three-year track on earnings without controlling for education or ex-perience. The estimated effect will thus depend on, among other things, how more schooling is valued relative to more experience on the Swedish labor market.
25. Students who are still not listed in the graduation record six years after admittance are considered to have dropped out. All students who have attended upper secondary school up until the graduation date are listed in this record.
Hall
259
High GPA compulsory
school
Low GPA compulsory
school
Academic parents
Non-academic parents
A. Dependent variable: At least three years of upper secondary education
Effect of beginning a three-year vocational track 0.357*** 0.445*** 0.330*** 0.433*** (0.033) (0.030) (0.037) (0.026) Mean of dependent variable 0.544 0.347 0.534 0.395 Sample size 81,318 100,127 52,748 128,697
B. Dependent variable: University enrollment
Effect of beginning a three-year vocational track ⳮ0.008 ⳮ0.002 0.028 ⳮ0.019 (0.030) (0.015) (0.030) (0.018) Mean of dependent variable 0.288 0.100 0.273 0.148 Sample size 82,558 101,543 53,697 130,404
C. Dependent variable: University degree
Effect of beginning a three-year vocational track 0.010 ⳮ0.002 0.007 0.004 (0.022) (0.009) (0.024) (0.012) Mean of dependent variable 0.149 0.028 0.127 0.064 Sample size 82,558 101,543 53,697 130,404
The
Journal
of
Human
Resources
Table 7(continued)
High GPA compulsory
school
Low GPA compulsory
school
Academic parents
Non-academic parents
D. Dependent variable: Dropped out of upper secondary school
Effect of beginning a three-year vocational track ⳮ0.017 0.083*** 0.006 0.052** (0.023) (0.023) (0.026) (0.021) Mean of dependent variable 0.049 0.158 0.086 0.118 Sample size 82,558 101,543 53,697 130,404
Method 2SLS 2SLS 2SLS 2SLS
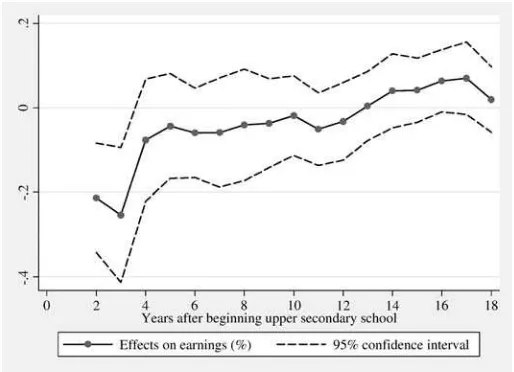
Figure 3
IV Estimates of the Effect of Beginning a Three-year Vocational Track on Log Earnings
Notes: Results for the full sample of vocational students (with positive earnings). The regressions control for cohort and municipality-of-residence fixed effects, compulsory school GPA, sex, immigrant background, the parents’ highest education level and their immigrant background. Robust standard errors, clustered by municipality of residence.
The effects on earnings are estimated in separate regressions for different years after enrollment in upper secondary school, starting with two years after admittance and including the subsequent 16 years. Figure 3 shows IV estimates for the natural logarithm of annual earnings for the full sample of vocational students (with positive earnings). These estimates are also reported in Table 8, which additionally shows OLS results as well as reduced form results; that is, the estimated effect of the pilot intensity in a person’s home municipality. The table also includes regressions for the probability of having positive earnings.
Figure 3 shows a significant negative effect of enrolling in a three- rather than a two-year vocational track on annual earnings the second and third year after admit-tance. This is expected as students from three-year tracks in general entered the labor market one year later. For none of the other years is the earnings effect sig-nificantly different from zero. The results thereby suggest that the return to an ad-ditional year of work experience was as large as the return to the adad-ditional year of education for these students.27
The
Effects on Annual Wage Earnings (Full Sample of Vocational Students)
Dependent variable: Log earnings Dependent variable: Positive earnings
Effect of pilot (0.037) (0.013) (0.066) (0.010) (0.003) (0.018) 3 ⳮ0.143*** ⳮ0.379*** ⳮ0.254*** ⳮ0.011 ⳮ0.012*** ⳮ0.019
(0.048) (0.015) (0.081) (0.010) (0.004) (0.017) 4 ⳮ0.044 ⳮ0.012 ⳮ0.077 ⳮ0.008 0.009** ⳮ0.014
(0.042) (0.014) (0.073) (0.013) (0.004) (0.022) 5 ⳮ0.025 0.038*** ⳮ0.043 ⳮ0.009 0.015*** ⳮ0.016
(0.037) (0.013) (0.063) (0.009) (0.004) (0.015) 6 ⳮ0.034 0.055*** ⳮ0.059 ⳮ0.019** 0.021*** ⳮ0.032*
(0.031) (0.012) (0.054) (0.009) (0.003) (0.017) 7 ⳮ0.034 0.060*** ⳮ0.059 ⳮ0.017* 0.016*** ⳮ0.029*
(0.039) (0.013) (0.066) (0.009) (0.003) (0.016) 8 ⳮ0.024 0.058*** ⳮ0.041 ⳮ0.017** 0.019*** ⳮ0.030*
Hall
263
10 ⳮ0.011 0.051*** ⳮ0.019 ⳮ0.003 0.016*** ⳮ0.005 (0.028) (0.009) (0.048) (0.008) (0.002) (0.013) 11 ⳮ0.030 0.042*** ⳮ0.051 0.000 0.010*** 0.001
(0.026) (0.010) (0.044) (0.008) (0.002) (0.014) 12 ⳮ0.019 0.039*** ⳮ0.032 0.007 0.011*** 0.012
(0.028) (0.010) (0.047) (0.008) (0.002) (0.014) 13 0.003 0.039*** 0.004 ⳮ0.000 0.009*** ⳮ0.001
(0.024) (0.009) (0.042) (0.007) (0.002) (0.013) 14 0.023 0.030*** 0.040 ⳮ0.003 0.011*** ⳮ0.006
(0.026) (0.010) (0.045) (0.007) (0.003) (0.012) 15 0.024 0.041*** 0.042 0.009 0.009*** 0.016
(0.022) (0.009) (0.039) (0.007) (0.003) (0.011) 16 0.037* 0.020** 0.064* 0.010 0.011*** 0.017
(0.022) (0.009) (0.038) (0.007) (0.003) (0.012) 17 0.041 0.017* 0.070 0.009 0.010*** 0.015
(0.025) (0.010) (0.044) (0.008) (0.003) (0.013) 18 0.011 0.011 0.020 ⳮ0.002 0.008*** ⳮ0.003
(0.023) (0.009) (0.039) (0.008) (0.002) (0.014)
N (year 18) 164,022 164,022 164,022 180,743 180,743 180,743
As in the previous section, these regressions ignore the fact that students com-pleting three-year tracks systematically graduated under worse labor market condi-tions than those completing two-year tracks. This implies that they faced a higher risk of unemployment and consequently of having low wage earnings in the begin-ning of their labor market career. Not accounting for this means that the effect of attending a three-year track on earnings could be underestimated, in the sense that it includes a potential negative effect of graduating in a worse labor market situation. Unemployment after graduation may have persistent negative effects on employment and earnings. Analyzing roughly the same cohorts of students, Nordstro¨m Skans (2004) finds that being unemployed the year after graduating from upper secondary school had negative effects on earnings and employment during the subsequent five years. The negative effect however seems to decrease over time and is not signifi-cantly different from zero six years after graduation. This suggests that the effects of enrolling in a three-year track presented in this section may be underestimated, but that the bias is likely to decrease over time.
The IV results for the probability of having positive earnings do not reveal any clear pattern, at least if we recognize that these estimates may be biased downwards during the beginning of the time period; see Table 8. The table further indicates that the OLS estimates of the effect of enrolling in a three-year track may be biased for both outcomes as they suggest quite different patterns compared to the IV estimates. If students who chose the longer tracks in general were more able or had a higher level of career ambition than those enrolling in two-year tracks, we would expect an upward bias in the OLS estimates. This is in line with the results for most years. But the estimates could also differ due to that the average effect for students who were induced to choose the longer tracks as a result of access to the pilot tracks differ from the average effect for the entire population of vocational students. The reduced form regressions produce the same conclusions as the IV regressions.
I have also estimated the earnings effects separately by compulsory school GPA and parents’ education. The pattern is similar across these different sub groups: Enrollment in a three-year track implied lower earnings the second and third year after admittance; thereafter the IV estimates are generally insignificant (results avail-able from the author).
D. Effects of a National Implementation
expected returns for doing so. This means that the estimated effect on university enrollment and earnings is potentially an upper bound of the effect for the whole population of vocational students, while the estimated effect on the probability of dropping out may be a lower bound.
The coexistence of two- and three-year vocational tracks may also have implied altered peer groups compared to both the pre-pilot and post-reform periods, when only one program length existed. Thus, if peer group effects are important for the outcomes studied, the effects of attending a three-year track during the pilot period could differ from the effects of a three-year track after the nationwide prolongation. An additional point to note regarding the validity of my results for the effects of a national implementation is that a prolongation of all vocational tracks could have general equilibrium effects on the returns to education, in which case the earnings effects may differ from the earnings effects of attending a pilot track.
Finally, a pilot may be associated with specific start-up difficulties or, perhaps, higher enthusiasm among teachers and students involved, compared to when the program has been in place for some time. The effects for students who experienced the new tracks in their infancy could therefore differ from the effects later on.
V. Conclusions
Since the mid-20th century, many countries have adopted more com-prehensive school systems. These types of policy shifts can be accomplished in many different ways, for instance by postponing the age at which students are tracked into different types of schools or by reducing the number of tracks. This paper provides evidence on the effects of a particular type of such transition, where a more com-prehensive school system is obtained through making all educational tracks academic enough to prepare the students for university studies.
The results show that prolonging and adding more academic content to the vo-cational tracks increased eduvo-cational attainment among vovo-cational students. The probability of having obtained at least three years of upper secondary education by age 31 is estimated to have increased by around 40 percentage points as a conse-quence of enrolling in a three- rather than a two-year vocational track. Although an important motive behind the policy change was to enable vocational students to pursue a university degree, I find no evidence of increased enrollment in university studies due to attending the longer vocational tracks. The absence of an effect on this outcome suggests that, perhaps already in the old system, the costs of changing direction from a vocational path to pursuing university studies were not large enough to prevent individuals who changed their mind from doing so. Even before the pilot period, it was possible to supplement a two-year vocational degree within the adult education system in order to obtain university eligibility.
(2007) estimate zero returns to an additional year of (general) education among vocational students.
I have also presented results indicating that the effect on educational attainment could have been negative for some students: Enrolling in a longer vocational track increased the probability of dropping out among students with a low compulsory school GPA and with non-academic parents. This result is in line with the findings of a few studies investigating the effects of raised graduation standards on high school dropout decisions. For example, Lillard and DeCicca (2001) find that higher graduation requirements in the US led to increased dropout rates, and Dee and Jacob (2006) that the use of exit exams reduced the probability of graduating among disadvantaged students. The increased probability of dropping out gives some sup-port to a fear held among those opposing the Swedish reform: that not all students may benefit from an upper secondary education with a substantial academic content.
Appendix 1
Table A1
Results for All Upper Secondary School Students
All students
Vocational students
A.Dependent variable: Beginning a three-year tracka
Effect of pilot intensity (OLS, first stage) 0.268*** 0.577*** (0.027) (0.050)
Mean of dependent variable 0.531 0.114
Sample size 408,438 184,101
B. Dependent variable: At least three years of upper secondary education
Effect of beginning a three-year tracka(2SLS) 0.431*** 0.403*** (0.035) (0.024)
Mean of dependent variable 0.696 0.435
Sample size 397,370 181,445
C. Dependent variable: University enrollment
Effect of beginning a three-year tracka(2SLS) ⳮ0.038 ⳮ0.005 (0.030) (0.015)
Mean of dependent variable 0.463 0.184
Sample size 408,438 184,101
Table A1(continued)
All students
Vocational students
D. Dependent variable: University degree
Effect of beginning a three-year tracka(2SLS) 0.014 0.004 (0.024) (0.010)
Mean of dependent variable 0.256 0.083
Sample size 408,438 184,101
E. Dependent variable: Dropping out of upper secondary school
Effect of beginning a three-year tracka(2SLS) 0.043* 0.038** (0.025) (0.019)
Mean of dependent variable 0.080 0.109
Sample size 408,438 184,101
F. Dependent variable: Log earnings (18 years after enrollment)
Effect of beginning a three-year tracka(2SLS) 0.047 0.020 (0 .054) (0.039)
Mean of dependent variable 7,617 7,541
Sample size 362,914 164,022
Notes:Each cell represents a separate regression. All regressions control for cohort and municipality-of-residence fixed effects as well as compulsory school GPA, sex, immigrant background, the parents’ highest education level and their immigrant background. Robust standard errors in parentheses allow for clustering by municipality of residence. * denotes significance at the 10 percent level. ** denotes significance at the 5 percent level. *** denotes significance at the 1 percent level. Log earnings are restricted to individuals with positive earnings.
a. Since one academic track lasted four years, the regressions that include all students estimate the effects of beginning a three-year or longer track.
References
Aakvik, Arild, Kjell Salvanes, and Kjell Vaage. 2010. “Measuring Heterogeneity in the Returns to Education Using an Educational Reform.”European Economic Review54(4): 483–500.
Brunello, Giorgio, Kenn Ariga, and Massimo Giannini. 2004. “The Optimal Timing of School Tracking.” IZA Discussion Paper No. 995.
Brunello, Giorgio, and Daniele Checchi. 2007. “Does School Tracking Affect Equality of Opportunity? New International Evidence.”Economic Policy22(52): 781–861. Dee, Thomas, and Brian Jacob. 2006. “Do High School Exit Exams Influence Educational
Duflo, Esther. 2001. ”Schooling and Labor Market Consequences of School Construction in Indonesia: Evidence from an Unusual Policy Experiment.”American Economic Review 91(4): 795–813.
Duflo, Esther, Pascaline Dupas, and Michael Kremer. 2008. “Peer Effects, Teacher Incentives, and the Impact of Tracking: Evidence from a Randomized Evaluation in Kenya.” CEPR Discussion Paper No. 7043.
Ekstro¨m, Erika. 2003.Essays on Inequality and Education. Economic Studies 76, Department of Economics, Uppsala University.
Galindo-Rueda, Fernando, and Anna Vignoles. 2005. “The Heterogeneous Effect of Selection in Secondary Schools: Understanding the Changing Role of Ability.” CEE Discussion Paper No. 52.
Hanushek, Eric, and Ludger Wo¨ssman. 2006. “Does Educational Tracking Affect Performance and Inequality? Differences-in-Differences Evidence Across Countries.” Economic Journal116(510): 63–76.
Imbens, Guido, and Joshua Angrist. 1994. “Identification and Estimation of Local Average Treatment Effects.”Econometrica62(2): 467–475.
Jackson, Clement Kirabo. 2010. “Do Students Benefit from Attending Better Schools? Evidence from Rule-Based Student Assignments in Trinidad and Tobago.”The Economic Journal120(549): 1399–1429.
Kerckhoff, Alan, Ken Fogelman, David Crook, and David Reeder. 1996.Going
Comprehensive in England and Wales.A Study of Uneven Change. London: The Woburn Press.
Leschinsky, Achim, and Karl Ulrich Mayer, eds. 1990.The Comprehensive School Experiment Revisited:Evidence from Western Europe. Frankfurt am Main: Peter Lang. Lillard, Dean, and Philip DeCicca. 2001. “Higher Standards, More Dropouts? Evidence
Within and Across Time.”Economics of Education Review20(5): 459–473. Malamud, Ofer, and Cristian Pop-Eleches. 2010. “General Education versus Vocational
Training: Evidence from an Economy in Transition.”The Review of Economics and Statistics92(1): 43–60.
Manning, Alan, and Jo¨rn-Steffen Pischke. 2006. “Comprehensive versus Selective Schooling in England and Wales: What Do We Know?” IZA Discussion Paper No. 2072.
Meghir, Costas, and Ma˚rten Palme. 2005. ”Educational Reform, Ability and Family Background.”American Economic Review95(1): 414–424.
National Agency for Education. 2000.Reformeringen av gymnasieskolan—en sammanfattande analys. Report No. 187. Stockholm.
National Board of Education. 1988.Gymnasieskolan ho¨sten 1987: fo¨rstahandsso¨kande, intagningsplatser, intagna elever, lediga plaster. Stockholm.
———. 1989a.Gymnasieskolan ho¨sten 1988: Fo¨rstahandsso¨kande, intagningsplatser, intagna elever, lediga platser. Stockholm.
———. 1989b.Gymnasieskolan ho¨sten 1989: Fo¨rstahandsso¨kande, intagningsplatser, intagna elever, lediga platser, avhopp. Stockholm.
———. 1990a.Rapport om fo¨rso¨ks- och utvecklingsarbetet i gymnasieskolan 1988/89. Report No. 90:3. Stockholm.
———. 1990b.Gymnasieskolan ho¨sten 1989: Fo¨rstahandsso¨kande, intagningsplatser, intagna elever, lediga platser, avbrytare. Stockholm.
Nordstro¨m Skans, Oskar. 2004. ”Scarring Effects of the First Labor Market Experience: A Sibling Based Analysis.” IFAU Working Paper No. 2004:14.
OECD. 2004.Learning for Tomorrow’s World: First Results from PISA 2003. Paris. Oosterbeek, Hessel, and Dinand Webbink. 2007. “Wage Effects of an Extra Year of Basic
Palme, Mikael. 1992. “Rekryteringen till gymnasiets 3-a˚riga yrkesfo¨rberedande fo¨rso¨kslinjer”, in SOU 1992:25.
Pekkarinen, Tuomas, Roope Uusitalo, and Sari Kerr. 2009. “School Tracking and Intergenerational Income Mobility: Evidence from the Finnish Comprehensive School Reform.”Journal of Public Economics93(7–8): 965–973.
Pop-Eleches, Cristian, and Miguel Urquiola. 2008. “The Consequences of Going to a Better School.” Columbia University. Unpublished.
Proposition 1983/84:116.Om gymnasieskola i utveckling.
Proposition 1987/88:102.Om utveckling av yrkesutbildningen i gymnasieskolan.
SOU 1989:106.Sextusen platser och tiotusen platser fo¨r fo¨rso¨k i gymnasieskolan—hur, var och varfo¨r?
Staiger, Douglas, and James H. Stock. 1997. “Instrumental Variables Regression with Weak Instruments.”Econometrica65(3): 557–586.