Optimization of Streptomyces sp.A11 Medium
Cultivation on Cyclo(Tyrosyl-Prolyl) Production Using
The Response Surface Methodology
Rofiq Sunaryanto
Center of Biotechnology, Badan Pengkajian dan Penerapan Teknologi (BPPT), gd.630 Kawasan Puspiptek Serpong, Tangerang Selatan, Banten 15314
E-mail : [email protected]
Abstract :
The response surface methodology is a three factorial design which provides the relationship between one or more measured dependent response and a number of input (independent) factors. Response surface methodology was used for optimization of fermentation medium for antibacterial agent cyclo(tyr-pro) production by Streptomyces sp A11. The optimal response region of the significant factor was predicted by using a second order polynomial model fitted to the results obtained by applying the Central Composite Design (CCD) statistical design.
Determination of the best production medium of cyclo(tyr-pro) showed among 6 carbon sources used, dextrin produced the highest cyclo(tyr-pro). Among the five nitrogen sources used, peptone produced the highest cyclo(tyr-pro), and the mineral salts group I produced the highest cyclo(tyr-pro) compared with others.
The results of optimization showed that three variables (dextrin as a carbon source, peptone as nitrogen source, and mixture of mineral salts) used showed significantly affected to the activity of cyclo(tyr-pro). The mathematical model used, obtained by the composition of the three variables most optimum were concentration of dextrin was 32.55 g.L-1, peptone concentration was 11.22 g.L-1, and 8.65 mL of mineral salts. By using the composition of mathematic model, cyclo(tyr-pro) was obtained 51.54 mg.L-1 (model expectations) and 50.04 mg.L-1 from experiments. The differences of experiment with expectation response value was 2.91%. Using the optimized parameters, the studies demonstrated an increase in the cyclo(tyr-pro) was 2.5 fold from 20 mg.L-1 to 50 mg.L-1.
Keywords: response surface methodology, cyclo(tyrosyl-prolyl), optimization.
1. Introduction
Cyclo(tyr-pro) is a diketopiperazine formed by the fusion of tyrosine and proline which has been reported as a secondary metabolite of fungi and bacteria. Cyclo(L-Pro-L-Tyr), generically named maculosin, was identified as a
host-specific toxin produced by Alternaria alternate on spotted knapweed [1]. Cyclo(tyr-pro) appears to be highly
toxic only to spotted knapweed and is being researched for potential field efficacy and bioherbicide. Cyclo(tyr-pro)
was also produced by Streptomyces sp A11, actinomycetes which isolated from marine sediment [2] and also
produced by oleh Pseudomonas fluorescens GcM5-1A [3].
Response Surface Methodology (RSM) is a powerful technique for testing multiple process variables because
fewer experimental trials are needed compared to the study of one variable at a time [4]. Also, interactions
between variables can be identified and quantified by such a technique. Otherwise, the conventional method of optimization involves varying one parameter at a time and keeping the others constant. This often does not bring
about the effect of interaction of various parameters as compared to factorial design [5]. RSM is a useful model for
studying the effect of several factors influencing the responses by varying them simultaneously and carry out a
limited number of experiments [6].
In this study, we applied response surface methodology (RSM), especially central composite design (CCD), to further attempt to enhance the cyclo(tyr-pro) production. The CCD is conducted in the optimum vicinity to locate the true optimum values of the multiple variables. This investigation is aimed at optimization of medium components (glucose, peptone and mineral salt), which have been predicted to play a very significant role in
variable while maintaining all others at fixed level. This selection were conducted before optimization using Response Surface Methodology.
2. Material and Methods
2.1. Microorganism
Streptomyces sp A11, isolated in our laboratory was used as producer of Cyclo(tyr-pro). It was grown at 30°C for 4 days and maintained on marine agar slants at 4°C and was subcultured at four week intervals.
2.2. Inoculum preparation
Inoculum was prepared by transferring 5 mL suspension prepared from a slant culture, into 250 mL Erlenmeyer flask containing 50 mL of sterile inoculum medium. The composition of inoculum medium consisted of
bacto peptone 15 g L-1, yeast extract 3 g L-1, malt extract 3 g L-1, glucose 10 g L-1 and dissolved into water 12,5 mL,
and sea water 37,5 mL, pH was adjusted at 7.6.
2.3. Production culture for determination of the best of carbon source.
Five millilitres of 48 hours aged inoculum Streptomyces sp A11 was added to 50 mL production medium in
250 mL Erlenmeyer flask. The composition of inoculum medium consisted of 10 g L-1 carbon source, peptone 5 g L
-1
, yeast extract 1 g L-1, Fe (III) citrate hydrate 0,3 g L-1, demineral water 12,5 mL, and sea water 37,5 mL, pH was
adusted at 7.6 [11]. Six kinds of carbon source were investigated for selected the best of carbon source, namely:
glucose, maltose, lactose, sucrose, mollase, and dextrine.
2.4. Production culture for determination of the best of nitrogen source.
Five millilitres of 48 hours aged inoculum Streptomyces sp A11 was added to 50 mL production medium in
250 mL Erlenmeyer flask. The composition of inoculum medium consisted of 10 g L-1 glucose, nitrogen source 5 g
L-1, yeast extract 1 g L-1, Fe (III) citrate hydrate 0,3 g L-1, demineral water 12,5 mL, and sea water 37,5 mL, pH was
adusted at 7.6 [11]. Five kinds of nitrogen source were investigated for selected the best of nitrogen source,
namely: peptone, yeast extract, glutamic acid, casein, ammonium sulphate.
2.5. Production culture for determination of the best mineral source.
Five millilitres of 48 hours aged inoculum Streptomyces sp A11 was added to 50 mL production medium in
250 mL Erlenmeyer flask. The composition of inoculum medium consisted of 10 g L-1 glucose, nitrogen source 5 g
L-1, yeast extract 1 g L-1, Fe (III) citrate hydrate 0,3 g L-1, and added salt solution, demineral water 12,5 mL, and sea
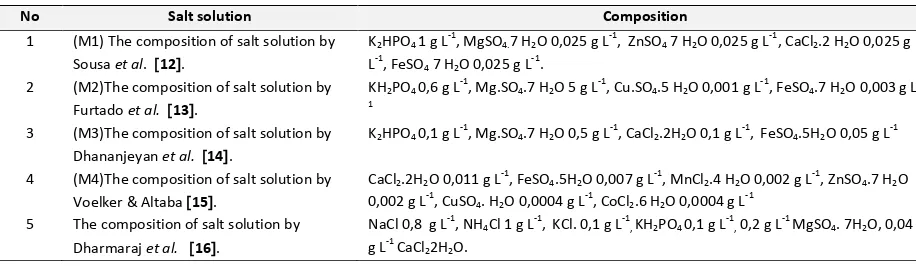
water 37,5 mL, pH was adusted at 7.6 [11]. The composition of each salt solution as Table 1.
Table 1. The composition of salt solution
No Salt solution Composition
1 (M1) The composition of salt solution by Sousa et al. 12.
K2HPO4 1 g L-1, MgSO4.7 H2O 0,025 g L-1, ZnSO4 7 H2O 0,025 g L-1, CaCl2.2 H2O 0,025 g L-1, FeSO
4 7 H2O 0,025 g L-1. 2 (M2)The composition of salt solution by
Furtado et al. 13.
3 (M3)The composition of salt solution by Dhananjeyan et al. 14.
K2HPO4 0,1 g L-1, Mg.SO4.7 H2O 0,5 g L-1, CaCl2.2H2O 0,1 g L-1, FeSO4.5H2O 0,05 g L-1
4 (M4)The composition of salt solution by Voelker & Altaba 15.
2.6. Experimental design and optimization by RSM
The best carbon source, nitrogen source, and salt solution were selected and used for optimized of fermentation medium using Response Surface Methodology. Boundaries of experimental domain and spacing of level expressed in code units are given in Table 2.
Table 2. Boundaries of experimental domain and spacing of level expressed in code units and natural units.
Variable Range and level of experimental
-1.68 -1 0 1 1.68
Carbon source (g L-1) 21.6 25 30 35 38.4
Nitrogen source (g L-1) 6.64 8 10 12 13.36
Salt solution (mL stock solution per volume (liter) of fermentation medium)
3.3 5 7.5 10 11.7
A factorial central composite design (CCD) for 3 factors with six replicates at the central point and six start point, resulting in 20 experiments was used to optimize the screened variables grouped as carbon source (X1), nitrogen source (X2), and mineral salts solution (X3). The behaviour of the system was explained by the following second order polynomial equation:
Y= bo + bixi + bij xi xj + bii x2i + e ……….
i i y
where : y = predicted response, bo = offset term, bi = linier effect, bii = squared effect, bij = interaction effect.
The design Expert was used for regression analysis of the data obtained and estimate the coefficients of the regression equation. Response contour plots were also obtained by using Design Expert.
3. Result and Discussion.
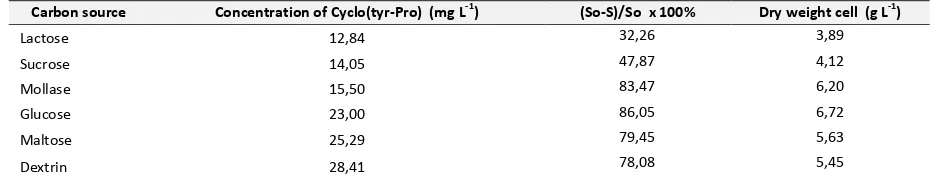
It is now recognized that the rate at which the carbon source is metabolized can often influence the formation of biomass or production of primary or secondary metabolites. This has been demonstrated the following Table 3.
Table 3. Effect of different substrates on cyclo(tyr-pro) production by Streptomyces sp. A11.
Carbon source Concentration of Cyclo(tyr-Pro) (mg L-1) (So-S)/So x 100% Dry weight cell (g L-1)
Lactose 12,84 32,26 3,89
Sucrose 14,05 47,87 4,12
Mollase 15,50 83,47 6,20
Glucose 23,00 86,05 6,72
Maltose 25,29 79,45 5,63
Dextrin 28,41 78,08 5,45
So = Initial substrate of total sugar, S= final substrate of total sugar
Of the carbon sources tested, dextrin showed the best production of cyclo(tyr-pro). Even though the consume of dextrin lower than glucose, maltose and mollase, dextrin produce cyclo(tyr-pro) higher than others. More glucose consumption will be converted to be biomass. Higher glucose concentration will effect to metabolite repression, and production of secondary metabolite will decrease significant. The next study dextrin will selected as a carbon source for optimization.
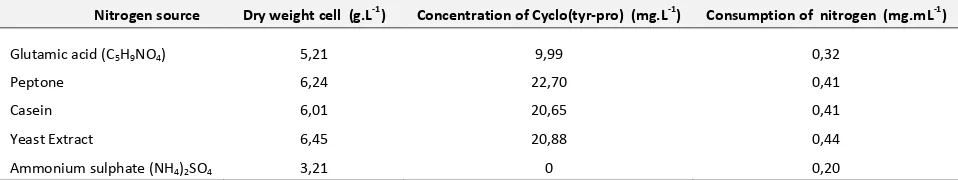
Table 4. Effect of different nitrogen source on cyclo(tyr-pro) production by Streptomyces sp. A11
Nitrogen source Dry weight cell (g.L-1) Concentration of Cyclo(tyr-pro) (mg.L-1) Consumption of nitrogen (mg.mL-1)
Glutamic acid (C5H9NO4) 5,21 9,99 0,32 with casein and yeast extract. Nitrogen consumption of peptone, casein and yeast extract also the same. Nitrogen source divide into 2 main part, organic nitrogen and inorganic nitrogen. Organic nitrogen usually rich of amino acid. Amino acids can act as a precursor in the formation of secondary metabolites. The next study peptone will be selected as a nitrogen source for optimization.
Salt solution or mineral has a crucial role in enzyme reactions as a cofactor in the metabolic process. Combination of mineral mixture also plays an important role in electrolytic and osmotic regulation in the cell. In this research, several mineral mixture were investigated. The different mixture effect of mineral salt on cyclo(tyr-pro) production by Streptomyces sp. A11 is shown on Table 5.
Table 5. Different mixture effect of mineral salt on cyclo(tyr-pro) production by Streptomyces sp. A11
Mineral salt Concentration of cyclo(Tyr-Pro) (mg.L-1) Dry weight cell (g.L-1)
Mineral I 35,50 6,56
Mineral II 31,68 6,25
Mineral III 33,10 6,34
Mineral IV 31,76 6,28
Mineral V 25,99 5,92
Table 5. showed that mineral I produced the highest cyclo(tyr-pro). The composition of mineral I as followed ;
K2HPO4 1 g L concentration could increase cell growth and product formation, but the excess concentrations would be toxic and cause cell lysis.
Optimization by RSM
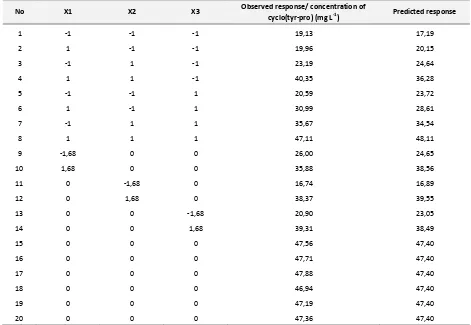
Three variable, dextrin, peptone, and mineral I were selected on basis of highest induced cyclo(tyr-pro) and optimized using central composite design. The experimental and predicted response of cyclo(tyr-pro)
production after 5 days cultivation by Streptomyces sp. A11 are shown in Table 6. By applying multiple regression
Table 6. Observed and predicted response of production of cyclo(tyr-pro)
No X1 X2 X3 Observed response/ concentration of
cyclo(tyr-pro) (mg L-1) Predicted response
1 -1 -1 -1 19,13 17,19
2 1 -1 -1 19,96 20,15
3 -1 1 -1 23,19 24,64
4 1 1 -1 40,35 36,28
5 -1 -1 1 20,59 23,72
6 1 -1 1 30,99 28,61
7 -1 1 1 35,67 34,54
8 1 1 1 47,11 48,11
9 -1,68 0 0 26,00 24,65
10 1,68 0 0 35,88 38,56
11 0 -1,68 0 16,74 16,89
12 0 1,68 0 38,37 39,55
13 0 0 -1,68 20,90 23,05
14 0 0 1,68 39,31 38,49
15 0 0 0 47,56 47,40
16 0 0 0 47,71 47,40
17 0 0 0 47,88 47,40
18 0 0 0 46,94 47,40
19 0 0 0 47,19 47,40
20 0 0 0 47,36 47,40
R2 = 0,98; adj R2 = 0,96; CV= 6,8%
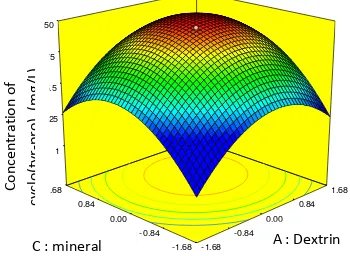
The analysis of variance of quadratic regression model demonstrates that the model is higly significant ( p-value/Prob>F) <0.0001. The closer the value of R (multiple correlation coefficient) to 1, the better the correlation between the observed and predicted value. The coefficient of variation (CV) indicates the degree of precision with which the treatments are compared. Usually, the higher the value of CV, the lower is the reliability of experiment. In this experiment, a lower value of CV indicates a greater reliability of the experiments performed. The parameter estimate and the corresponding P value suggest that among the independent variables dextrin (X1), peptone (X2), and Mineral I (X3) have significant effect on cyclo(tyr-pro) production. The quadratic term of these three variables also have a significant effect. There are no interaction between dextrin to mineral and peptone to mineral but there is interaction between dextrin to peptone. Response surface plot obtained as function of dextrin concentration versus peptone concentration and other variable are at zero level. A maximum increase in
cyclo(tyr-pro) yield with increase in dextrin concentration versus peptone concentration was observed (Figure 1).
Figure 1. Response surface plot showing the effect on dextrin concentration , peptone concentration and their mutual effect on the production of cyclo(tyr-pro). Other variables are held at zero level.
Response surface plot obtained as function of dextrin concentration versus mineral salt and other variable are held at zero level. A maximum increase in cyclo(tyr-pro) yield with increase in dextrin concentration versus mineral salt was observed (Figure 2).
Figure 2. Response surface plot showing the effect on dextrin concentration, mineral salt concentration and their mutual
effect on the production of cyclo(tyr-pro). Other variables are held at zero level.
Dextrin and mineral salt concentration increases significantly and influence the production of cyclo(tyr-pro). Increasing the dextrin concentration looks the same influence on the production of cyclo (tyr-pro) compared the increasing of the mineral salt concentration, but there is no interaction between dextrin to mineral salt.
Response surface plot obtained as function of peptone concentration versus mineral salt and other variable are held at zero level. A maximum increase in cyclo(tyr-pro) yield with increase in peptone concentration versus mineral salt was observed (Figure 3).
Figure 3. Response surface plot showing the effect on peptone concentration, mineral salt concentration and their mutual
The regression equation (equation 1) was solved by Design Expert. The optimal values of test variables in coded unit were X1 = 0,51; X2 = 0,61; X3 = 0,46. At the these values, the concentration of dextrin and peptone
were 32,55 g L-1, 11,22 g L-1 respectively, and volume increase of mineral salt was 8,65 mL. The maximum
predictes value of cyclo(tyr-pro) production was 51,54 mg L-1. A repeated fermentation of cyclo(tyr-pro) under
optimal condition was carried out in laboratory. The maximal of cyclo(tyr-pro) was obtained 50,04 mg L-1. This
value was found to be 2.9% less than the predicted value. The discrepancy might due to the slight variation in experimental conditions
4. Conclusion
Determination of the best production medium of cyclo(tyr-pro) showed dextrin, peptone, and the mineral
salts group I produced the highest cyclo (tyr-pro). The combination concentration of dextrin, peptone were 32.55 g
L-1, 11.22 g L-1 respectively, and volume increase of mineral salt was 8.65 mL was obtained the highest
cyclo(tyr-pro) concentration 50.04 mg L-1. The differences of experiment with predicted value was 2.91%. Using the
optimized parameters, the studies demonstrated an increase in the cyclo(tyrosyl-prolyl) was 2.5 fold from 20 mg L
-1
to 50 g L-1.
References
1 Stierle A, Cardellina JH, Strobel GA. 1988. Maculosin, a host-specific phytotoxin for spotted knapweed from Alternaria alternata. Proc Nat Acad Sci.85(21): 8008-8011.
2 Sunaryanto R, Marwoto B, Irawadi TT, Mas’ud )A, Hartoto L. . Isolatio a d hara terizatio of a ti i ro ial substance from marine Streptomyces sp. J Microbiol Indonesia 4(2): 84-89
3 Guo Q, Daosen G, Zhao B, Xu J, Li R. 2007. Two cyclic dipeptides from Pseudomonas fluorescens GcM5-1A carried by the pine wood nematode and their toxicities to Japanese black pine suspension cells and seedlings in vitro. J Nematol. 39(3): 243–247.
4 Box GEP, Hunter WG, Hunter JS. 1978. Statistics for experimenters. an introduction to design, data analysis and model building. New York: John Wiley and Sons.
5 Montgomery DC. 1997. Design and analysis of experiments. 4th Edition. New York: John Wiley and Sons.
6 Box GEP and Draper NR. 1987. Empirical model building and response surface. New York: John Wiley & Sons.
7 Popa O, Narcisa B, Vamanu A, and Namanu E. 2007. The utilization of the response surface methodology for the optimization of cultivation medium and growth parameters in the cultivation of the yeast strain S cerevisiae 3.2 on ethanol. Afr J Biotechnol 6(23):2700-2707.
8 He GQ, Kong Q, Ding LX. 2004. Response surface methodology for optimizing the fermentation medium of Clostridium butyricum. Lett App Microbiol 39:363-368.
9 Sathyanarayanan J, Kunthala J, Gurumurthy K. 2011. Optimization of MRS media components using response surface methodology for the riboflavin production by Lactobacillus fermentum isolated from yogurt sample. Int Food Res J 18: 149-159.
10 Man LH, Behera SK, Park HS. 2010. Optimization of operational parameters for ethanol production from Korean food waste leachete. Int.J.Environ/Sci. Tech. 7(1): 157-164.
11 Kanoh K, Matsuo Y, Adachi K, Imagawa K, Nishizawa M, Shizuri Y. 2005. Mechercharmycins A and B, Cytotoxic Substances from Marine-derived Thermoactinomyces sp. YM3-251. J Antibiot 58(4): 289–292.
12 Sousa MFVQ, Lopes CE, Junior NP. 2001. A chemically defined medium production of Actinomycin D by Streptomyces parvulus. Brazilian arch biol technol 44(N3): 227-231.
13 Furtado NAJC, Pupo MT, Carvalhho I, Campo VL, Duarte MCT, Bastos JK. 2005. Diketopiperazines produced by an
Aspergillus fumigatus Brazillian strain. Braz Chem Soc 16(6B):1448-1453.
14 Dhananjeyan V, Selvan N, Dhanapal K. 2010. Isolation, characterization, screening and antibiotic sensitivity of actinomycetes from locally (Near MCAS) collected soil samples. J Biol Sci 10(6): 514-519.