THE INFLUENCES OF NATURAL GAS IMPURITIES TO THE
SURFACE TENSION OF BLENDED
PIPERAZINE-N-METHYLDIETHANOLAMINE (MDEA) SOLUTION
Iwan Ratman
1,2)and Ahmad Fauzi Ismail
1*)1)
Advanced Membrane Technology Research Center, Faculty of Chemical and Natural Resources Engineering,
Universiti Teknologi Malaysia, 81310 UTM, Skudai, Johor Bahru, Malaysia Tel.:+60-7-5535592; Fax:+60-7-5581463
*)
Corresponding author: [email protected]
2)
TOTAL SA, Strategy Business Development - LNG Department, Tour Coupole, La Defense, Paris- France
Abstract
This study focuses on the effect of impurities in the natural gas stream on the characteristic of surface tension in the blended piperazine and MDEA solution. Hydrocarbon liquids, Iron Sulphide, Sodium Chloride, Acetic Acid, Methanol and Polyethylene Glycol were used as the impurities. The results indicated that the type of impurities determined the surface tension changes of the amine solution. The concentration of piperazine-MDEA blends also enhanced to the increasing of surface tension. Iron sulphide, hydrocarbons and sodium chloride as the impurities in the amine solution were the most influential factors to the surface tension. Statistical experimental method was employed to determine the main effect in the increasing of surface tension. Full factorial design and response surface methodology (RSM) coupled with central composite design (CCD) were used to determine the increasing of surface tension in the amine solution. A central composite design was used to determine the main variables such as iron sulphide, hydrocarbon and sodium chloride. The maximum surface tension of 74.33 mNm-1 was determined at the combined impurities concentrations of Iron Sulphide at 6.346 ppm, Hydrocarbon liquids at 11.827 ppm and Sodium Chloride at 8.261 ppm.
Keywords: amine degradation, piperazine-MDEA, statistical, surface tension
Abstrak
Pada penelitian ini difokuskan untuk mengetahui pengaruh impuritas didalam aliran gas alam terhadap karakteristik tegangan permukaannya pada campuran larutan MDEA-piperazin. Hidrokarbon, besi sulfida, NaCl, asam asetat, methanol dan PEG digunakan sebagai larutan impuritas pada gas alam. Pada penelitian ini menunjukan bahwa jenis dari impuritas akan mempengaruhi besarnya tegangan permukaan yang dihasilkan pada larutan amin. Konsentrasi larutan amin juga mempengaruhi tegangan permukaan yang dihasilkan. Besi sulfida, hidrokarbon dan NaCl adalah faktor penting yang menentukan besanya tegangan permukaan yang dihasilkan. Metode statistik yang menggunakan response surface methodology (RSM) yang digabungkan dengan central composite design (CCD) telah digunakan untuk mengetahui faktor utama yang menentukan tegangan permukaan. Tegangan permukaan yang paling tinggi dihasilkan pada konsentrasi besi sulfida 6,346 ppm, hidrokarbon 11,827 ppm dan NaCl 8,261 ppm adalah sebesar 74,33 mNm-1.
Kata kunci: penurunan kualitas amine, piperazine-MDEA, statistic, tegangan permukaan
INTRODUCTION
The surface of a liquid has interesting properties which appear as the surface tension. The surface tension of liquids can be looked upon as the property which draws a liquid together and forms a liquid–vapor interface. The surface tension of liquid mixtures is a property that plays an important role in aqueous
molecules diffuse between the bulk phase and the sub layer adjacent to the fluid interface; (ii) surfactant molecules are exchanged between the sub layer and fluid interface through the kinetic processes of adsorption and desorption. The description of these processes and the evaluation of the diffusion coefficient and rate constants are important in understanding the influence of surfactant adsorption on many processes (Hernández et al, 2000).
Surface tension has high industrial importance in the chemical reactions as the reactions in the surface region are quite different from the bulk region. In various chemical engineering processes such as separation, distillation, extraction and absorption, surface tension has a determining effect. Also in electrochemical reactions, biological membranes operation, environmental engineering and several other processes, such as corrosion, adherency, detergency, floating and lubricating, the surface tension plays a significant role. The surface tension of liquids and its variation with composition in liquid solutions must often be taken into account in designing rational chemical process equipment involving inter phase heat and mass transfer. Many methods to calculate the surface tension of binary non-electrolyte mixtures have been proposed (Belton and Evans, 1945; Tahery et al, 2005).
Natural gas, whether produced from a condensate field or as associated gas from an oil reservoir, usually contains water vapour and frequently contains H2S and CO2. The separation of gas
impurities such as carbon-dioxide (CO2) and
hydrogen-sulphide (H2S) from the gas mixtures is an important
operation in natural gas treating, petroleum refining, coal gasification and ammonia manufacturing industries. Therefore, to remove these acid gases aqueous solutions of one alkanolamine have traditionally been used in gas treating plants. Some of the most important alkanolamines used in industrial processes include monoethanolamine (MEA), diethanolamine (DEA), and triethanolamine (TEA). The surface tension is an important characteristic to be considered in the design of contacting equipment like gas absorption towers. Surface tension affects the hydrodynamics and mass transfer rate of acid gases through the absorption solution (Rangwala et al, 1992). Moreover, it is observed that no surface tension data have been reported up to now for aqueous of three alkanolamines with impurities of natural gas. The impurities in natural gas were hydrocarbon, iron sulphide, sodium chloride, acetic acid, methanol and glycol respectively. Moreover, the impurities of natural gas will affect the physical properties of alkanolamines aqueous such as the surface tension, density and foamability. Another problem of industrial interest, related to interfacial phenomena, which has to be understood in order to put forward proper answers, is the undesirable presence of foam during the counter-current contact between the sour hydrocarbon-rich gas stream and the absorption solution of aqueous
alkanolamines. Foam is the dispersion of a gas in a liquid and is characteristic of each system, depending on the chemical structure of the components that compose the system under study (Carthy and Trebble, 1996). Few results have been reported on the foaming tendency of aqueous solutions of one alkanolamine (Yanicki and Trebble, 2006; Hesselink and Huuksloot, 1985; Reza and Trejo, 2006).
The statistical design of the experiments as an established procedure continues to show increasing use in chemistry and chemical engineering processes. Experimental designs are commonly performed in the study of empirical relationship, in terms of a mathematical model, between one or more measured responses and a number of variables or factors (Nele et al, 1999). Experimental design and mathematical modelling techniques are mathematical tools normally used to optimize a process. Traditional methods of optimization involved changing one independent variable while fixing the others at a certain level. Experiment design techniques were developed to allow the gathering of maximum process information with reduced number of experiments. Experimental design techniques usually depend on empirical model structure in order to interpret experimental data and provide optimum process conditions.
In general, response surface methodology (RSM) allows an empirical model to be built from data collected from a minimal set of systematically designed experiments. The RSM integrates mathematical and statistical techniques, (Myers and Montgomery, 2002) and was essentially developed from numerical method. The RSM is initiated with an experimental design commonly called design of experiment (DOE) to screen model parameters before going to the optimization process (Cornel, 1990).
However, no experimental data on the surface tension and foaming behaviour of aqueous solutions of MDEA and piperazine was found in the literature. Therefore, in the present study, the physicochemical characterizations of aqueous solutions of blends of piperazine and MDEA in the natural gas impurities were investigated. In order to identify and assess the characteristic of the surface tension, we have determined experimentally the surface tension of the solutions with different impurities such as Iron Sulphide, Hydrocarbon liquids, Sodium Chloride, Methanol, Organic Acid as Acetic Acid and Polyethylene Glycol.
EXPERIMENTAL METHOD Materials
The sample of MDEA was obtained from an activated MDEA manufacturer with a purity of 99.9% mol. Water was distilled and deionised. The blends of piperazine and MDEA were twice distilled under vacuum with a stream of nitrogen in order to remove traces of moisture and other impurities. The impurities involved on the testing were Methanol, Hydrocarbon liquids, Polyethylene Glycol, Natrium Chloride and Acetic Acid.
Preparation of Solutions
All the studied aqueous solutions of known concentration of alkanolamines were prepared by mass using a Sartorius 2006 MP analytical balance whose precision and accuracy is ±0.0001 g. It should be noted that although for simplicity all the concentration values for the studied systems are reported throughout this work to the first decimal digit they have an uncertainty of ±0.002 mass %.
Surface Tension
Equilibrium surface tension values were obtained with the pendant drop method using a FTA200 contact angle system. The main components of the apparatus includes a light source, a computer-controlled dosing system, a thermal cell with cuvette, and a video system mounted on an optical platform which shows live on the computer screen the pendant drop of the system under study, so that the images are captured for analysis with special software for fitting the Laplace–Young equation to the drop shape coordinates. The automatic image analysis that allows obtaining accurate surface tension values is based on the following working equation:
Experimental Design
The determination of important factors affected the surface tension were applied a technique called the response surface methodology (Cornel, 1990). A central composite design and full factorial design were employed in this regard. Three independent experimental variables, namely, iron sulphide (X1),
hydrocarbon (X2) and sodium chloride (NaCl) (X3)
were selected as controlled factors. Their experimental range and levels used in this work are given in Table 1.
Table 1. The levels of variables chosen for impurities separation
-α -1 0 +1 +α
Iron sulphide (ppm)
4236 5000 6000 7000 7764
Hydrocarbon (ppm)
5354 6000 8000 9000 10646
NaCl (ppm) 5854 6500 8500 9500 11146
The lower, upper, and centre point of the design were coded as -1, 1, 0 and α, where + 1 denotes high level, -1 low level, α = 2 n/4 (n = number of variables or factors) is the star point, and 0 corresponds to the centre point. The star points were added to the design to provide of curvature estimation for the model. Based on the type of experimental design used, 16 experiments were needed.
According to this design, the total number of treatment combinations is 2k + 2 k + “no”, where ‘k’ is the number of independent variables and “no” is the number of experiments repeated at the centre point. The experimental plan and levels of independent variables are shown in Table 2.
For statistical calculation, the variables Xi have
been coded as xi according to equation (2):
xi = (Xi-Xo)/δX (2)
where, xi = dimensionless coded value of the variable
Xi, Xo = the value of the Xi at the centre point, and δX
= step change.
Response surface methodology was applied to the conversion and selectivity data using the commercial Statistica Stat Software version 6.
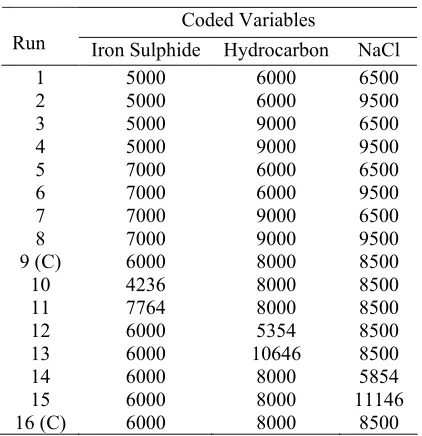
Table 2. Factorial central composite experimental design for impurities separation
Coded Variables
Run Iron Sulphide Hydrocarbon NaCl
1 5000 6000 6500
2 5000 6000 9500
3 5000 9000 6500
4 5000 9000 9500
5 7000 6000 6500
6 7000 6000 9500
7 7000 9000 6500
8 7000 9000 9500
9 (C) 6000 8000 8500
10 4236 8000 8500
11 7764 8000 8500
12 6000 5354 8500
13 6000 10646 8500
14 6000 8000 5854
15 6000 8000 11146
The statistical experiment design provides second order polynomial equation for the prediction of the effects of experimental variables and their interactions on the response variables. Each response Y can be represented by a quadratic model of the response surface, here with three independent variables as shown in equation (3)
∑ β
interaction effect, βjj the squared effect. In this study,
the conversion of methane and the selectivity of hydrogen and carbon monoxide were obtained as the responses of the experiment. Response contour and surface plots, analysis of variance and standard deviation were generated with Statistica Stat Software version 6.
The statistical analysis of the model was performed in the form of analysis of variance (ANOVA). This analysis included the Fisher’s F-test (overall model significance), its associated probability p(F), correlation coefficient R, and determination coefficient R2 which measure the goodness of the fitted regression model. It also includes the student’s t-value for the estimated coefficients and the associated probabilities p (t). For each variable, the quadratic models were represented as contour plots (2D) and surface plots (3D).
RESULTS AND DISCUSSION
Since the objective of the present work is to identify the main factors influencing the surface tension, the surface tension characteristic of aqueous solution of blends piperazine-MDEA was determined as a function of types and concentrations of the impurities and the concentration of alkanolamine solutions. As known that the contaminants in amine solutions can arise from various sources and usually exist in several different forms. Although a single contaminant may necessitate a certain plan of action, gas treating solutions rarely contain only one or two impurities. Instead, many different impurities exist in varying concentrations, many of which have some adverse effect on the process. The effect of impurities on the surface tension was depicted in the Figures 1, 2, 3, and 4.
The Effect of Concentration MDEA Solution
The effect of concentration of MDEA (MDEA + water system) on the surface tension was presented in Figure 1. This contains the experimental surface tension data from this work for MDEA + water system at 10, 20, 30, 40, 50, 60 and 80 volume % of the amine at 303 K obtained with the pendant drop method. It may be observed that the surface tension of these system decreases as the concentration of the MDEA (alkanolamines) increases. Figure 1 also includes
surface tension data from the work by Aquila Hernandes et al (2001) in order to carry out a comparison. For all experimental of MDEA solution in this work and Aquila-Hernandes was quite similar trend of surface tension data.
40
Concentration of MDEA (vol %)
Sur
Figure 1. The effect of concentration MDEA on surface tension (a) experimental work (b) data from
literature (Hernández and Trejo, 2001)
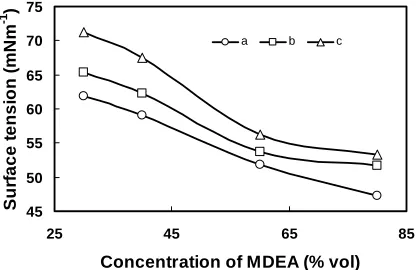
The Effect of MDEA Concentration and Hydrocarbon as the Natural Gas Impurities on the Surface Tension
The effect of MDEA concentration on the hydrocarbon impurities on the formation of surface tension was presented in Figure 2.
Figure 2. The effect of concentration MDEA and hydrocarbon as impurities on surface tension (a) 500
ppm (b) 5,000 ppm (c) 10,000 ppm
Generally, hydrocarbons tend to stay in solution and will generate certain surface tension and afterward they will produce foam in the amine solution (Jou et al, 1996). As shown in Figure 2, the concentration of MDEA and hydrocarbons determined the surface tension of amine solution. The surface tension of aqueous solution of MDEA increased with increasing the concentration of hydrocarbon as evidenced in Figure 2. Firstly, the surface tension increased by 5.6% at the hydrocarbon concentration from 500 ppm to 5000 ppm. Moreover, the surface tension increased by 15.5% with the increasing of hydrocarbon concentration at 10,000 ppm. However, the surface tension of MDEA solution decreased with increasing the concentration of solution as depicted in Figure 2.
on
Concentration of MDEA (% vol)
The results indicated that fresh of MDEA was slightly reacted with impurities to increase the surface tension. In another world, the fresh MDEA will be more stable to form the foaming compare to another concentration of MDEA.
The Effect of Iron Sulphide on the Surface Tension
Figure 3 represents the effect of iron sulphide on the surface tension in the amine solution.
Figure 3. The effect of concentration MDEA and iron sulphide as impurities on surface tension (a) 500 ppm
(b) 5,000 ppm (c) 10,000 ppm
Generally, the inorganic material increases the surface tension of aqueous solution and thus they tend to deplete from the air-water surface layer. Due to the hydration ions in iron sulphide will be depleted in the surface layer. In the amine system, iron sulphide could be reacted with the water to form Fe(OH)2. Therefore,
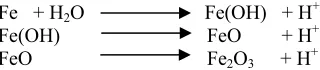
the presence of iron sulphide on the MDEA solution would be caused the increase of surface tension as depicted in Figure 3. The formation of the oxide film in an aqueous system has been proposed as a series of anodic reactions involving adsorbed complexes:
Fe + H2O Fe(OH) + H+
Fe(OH) FeO + H+ FeO Fe2O3 + H+
As suggested in the previous studies (Chang and Dang, 2006; Jungwirth and Tobias, 2006; Rinker et al, 1994), the presence of inorganic material in the water system will be affected the surface tension. The alteration of surface tension in the inorganic material usually depends on the valence of the ions, the larger in the increase in the surface tension. Chang and Dang (2006) suggested that the increasing of surface tension by inorganic cations is correlated to their standard hydration entropy. They also found that small non-polarisable ions such as alkali and fluoride cations are strongly repelled from the surface tension, whereas larger polarisable ions such as heavier halides, sulphate and hydronium cations exhibit a surface affinity.
The Effect of Sodium Chloride (NaCl) on the Surface Tension of Amine Solution
Figure 4 displays the effect of NaCl on the surface tension onto aqueous solution of MDEA.
Figure 4. The effect of concentration MDEA and sodium chloride as impurities on surface tension (a)
500 ppm (b) 5,000 ppm (c) 10,000 ppm
Concentration of MDEA (vol %)
a b c
The presence of NaCl in the solution can be reacted with the MDEA solution and would be reduced the MDEA quality. Moreover, in the solution of MDEA, sodium chloride will be formed crystal and could be attached to air bubble. The attached sodium particles form a network structure on the surface of the air bubble due to the particle–particle and particle–water interactions (Vijayaraghavan et al, 2006). Finally, the crystal of sodium chloride will be increased the surface tension.
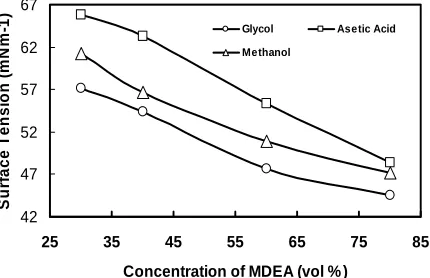
Effect of Acetic Acid, Methanol, and Polyethylene Glycol on the Surface Tension
Figures 5-7 represent the effect of acetic acid, methanol and polyethylene glycol on the surface tension formation in the blends of piperazine-MDEA solution. The results in Figures 5-7 indicated that the type of impurities affected the surface tension behaviour of blends piperazine-MDEA. However, the trends of all impurities were quite similar with different concentration of the impurities as depicted in Figures 5-7.
Figure 5. The effect of concentration MDEA and various impurities at 500 ppm on surface tension
45
Concentration of MDEA (vol %)
Sur
Concentration of MDEA (vol %)
As shown in Figure 5, the acetic acid with concentration of 500 ppm generated and increased surface tension about 4.5%, respectively. Furthermore, acetic acid at the concentration above 5,000 ppm, the surface tension increased about 7.5%, respectively. This phenomenon indicated that the concentration of acetic acid caused slight effect to the increasing of surface tension in the amine solution. Likewise acetic acid, other impurities (methanol and polyethylene glycol) increased the surface tension only by 1% and 0.5% at the concentration of 30% MDEA-piperazine blended solution as seen in Figures 6 and 7.
Figure 6. The effect of concentration MDEA and various impurities at 5,000 ppm on surface tension
Figure 7. The effect of concentration MDEA and various impurities at 10,000 ppm on surface tension
The small increment of the surface tension was caused by the lower valence of methanol and polyethylene glycol particles, which could not be strongly depleted onto the surface layer. Therefore, they only contribute to the small increase of the surface tension. This phenomenon was confirmed that the valence of impurities affected the surface tension and it has been observed earlier (Chang and Dang, 2006).
Determination of Effect Mixed Aqueous Impurities on the Surface Tension Using Statistical Analysis
In this study, full factorial design (FFD) and central composite design (CCD) were systematically performed to investigate the main factor of natural gas impurities affected the surface tension of blended
piperazine-MDEA. A response surface methodology and central composite design were used to optimize the experiments, and the iterative regression analysis was to determine the maximum surface tension of aqueous solution of MDEA. Hence, the dominating factors that seem to be the most important and influence, could be diagnosed in order to determine the surface tension and related to the foam formation in the CO2 removal using MDEA solution process. A
complete full factorial design with central composite design for experimental data of this study was conducted by using Statsoft Statistica version 6. The effects and interactions of iron sulphide concentration (X1), hydrocarbon concentration (X2) and sodium
chloride concentration (X3) on surface tension of
amine solution were investigated. A complete 2k + 2*k + no full factorial and central composite design was summarized in Table 2
40
Concentration of MDEA (Vol % )
Glycol Asetic Acid Methanol
The experimental value and predicted response for 16 trials runs carried out are presented in Table 3.
Table 3. Factorial central composite design three variables with the observed responses and predicted values
Run Co/Ni T, oC CH4/O2 Yo s Yp s
1 5000 6000 6500 63.17000 62.11180
2 5000 6000 9500 64.42000 65.24704
3 5000 9000 6500 65.72000 66.91527
4 5000 9000 9500 69.75000 73.22625
5 7000 6000 6500 74.58000 74.40102
6 7000 6000 9500 66.78000 66.16471
7 7000 9000 6500 75.67000 75.42293
8 7000 9000 9500 66.57000 70.36236
9 6000 8000 8500 70.95000 71.09575
10 4236 8000 8500 74.77000 73.13536 11 7764 8000 8500 77.67000 76.99313 12 6000 5354 8500 64.32000 65.96647 13 6000 10646 8500 76.23000 73.99566 14 6000 8000 5854 65.74000 66.81113 15 6000 8000 11146 62.35000 60.37538 16 6000 8000 8500 74.63000 71.09575 Yo s = Observed surface tension
Yp s = Predicted surface tension
The coefficients of the model developed for the three responses were estimated with multiple regression analysis on the experimental data. The following second order polynomial equations (Equations 3) provided the predicted responses for surface tension, respectively.
YS = 70.72 + 4.71 X1 + 4.5 X2 -0.92 X3
+2.55 X12 +4.50 X22-4.82 X32
-1.89 X1X2 -5.68 X1X3+1.58 X2X3. (4)
The quality of the models can be judged from their coefficients of correlation, R and R2. The R value for the surface tension is 0.93, indicating a fairly good agreement between the experimental and predicted values from the models. From Table 4 the value of R2 for the surface tension is 0.87; respectively implying
S
Concentration of MDEA (vol % )
that 87% of the total variation in the three responses are attributed to the experimental variables.
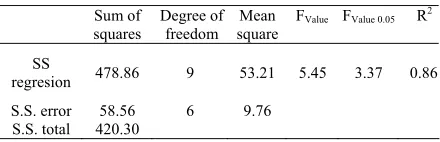
Table 4. ANOVA for impurities separation
Sum of
The adequacy of model was further checked with the analysis of variance (ANOVA) (Cornel, 1990; Montgomery, 1997) as shown in Table 4. In ANOVA, the sum of squares of the total variation of each response is broken down into two components, i.e. regression and residual. The F-value for the regression is defined as MSreg/MSres, where MSreg is the mean
square of regression, obtained by dividing the sum of squares of regression by the degree of freedom. MSres
is the mean square of residual. The test of significance of the fitted regression model is based on the following hypothesis:
Table (Fp-1,N-p,α), which means that alternative hypothesis (HA) is rejected. Here p-1 denotes level
significance, while N-p,α expresses the degrees of
freedom with respect to regression and residual error respectively. On the contrary, if the F-value > F Table (Fp-1, N-p,α), the null hypothesis is rejected and the
alternative hypothesis is true.
In general, the calculated F value should be several times greater than the tabulated value for a good model. If the value of F is greater than the tabulated F(p-1, N-p, α), then the null hypothesis is rejected
at the α level of significance and implies that the variation accounted for by the model is significantly greater than the unexplained variation. The result in Table 4 indicated the F values for surface tension which is 5.45, respectively. These values are greater than the tabulated F(p-1,N-p,α), value of 3.37. Therefore,
the null hypothesis is rejected, and the Fisher F test demonstrates a 95% confidence level (α = 0.05). Consequently, the surface tension models developed are correct and adequate. The F-value shows a statistically significant regression at 5% level of significance (95% confidence level). In this case, the null hypothesis (H0) is rejected at 5% level of
significance based on the marked F-value (Cornel, 1990; Montgomery, 1997; Box et al, 1978) implies that at least one of the independent variables contributes significantly to the model.
Significance of Regression Coefficients
The result is shown in Table 5 exhibit multiple regression results and the significance of the regression coefficient of the surface tension model with mixed aqueous impurities such as iron sulphide, hydrocarbon and sodium chloride.
Table 5. Multiple regression result and significance of regression coefficient for the surface tension
Parameter Term Coefficient t-value p-value
βo 70.72564 33.65078 0.000000
-0.71658 -0.39819 0.704270 β33 X32 -4.82303 -2.68007 0.036533
R2 0.86
R 0.93
The significance of the regression coefficient was determined using the student’s t tests (Cornel, 1990; Box et al, 1978). In the Table, the coefficients with one factor represent the effect of that particular factor, while the coefficients with two factors and those with second-order terms represent the interaction between the two factors and quadratic effect, respectively. A positive sign in front of the terms indicates synergistic effect, while a negative sign indicates antagonistic effect. The t-test and p-value is used as a tool to check the significance of each of the coefficients (Montgomery, 1997). The p-value is defined as the smallest level of significance that would reject the null hypothesis, H0. The smaller the magnitude of the
p-value the more significant is the corresponding coefficient and contributes largely towards the response variable. While, the larger the t-test value, the more significant is the corresponding coefficient and consequently, the greater is the distribution of the corresponding model term towards the response variable.
From Table 5, the significant term for response model can be determined. For example, it can be found from Table 5 that the variable with the largest effect on surface tension is the linear term of iron sulphide concentration (X1) having a t-test value of
4.72 and a p-value = 0.033. This is followed by the linear term of hydrocarbon concentration (X2) with
p-values of 0.039, respectively. The effect of linear term of sodium chloride concentration (X3) and interaction
term of iron sulphide with sodium chloride (X1X3) are
tension are statistically insignificantly. Main effect of iron sulphide concentration had the strongest influences to the surface tension of aqueous amine solution. As discussed in Section 3.3., the surface tension of MDEA solution is affected by the natural gas impurities such as iron sulphide. The low iron sulphide concentration in the natural gas was reduced the surface tension of MDEA solution and also reduce the foamability of MDEA solution. Moreover, the lower concentration of iron sulphide will increase the MDEA performance to remove the CO2 in the natural
gas. Therefore, the determination of main parameters is an important factor to achieve high performance of CO2 removal process. One interesting factor is the
effect of interaction between X1 and X3 is considerably
important (p-value = 0.039). The combination of iron sulphide and sodium chloride concentration can be used to control the surface tension and foamability of MDEA solution to understand the behaviour of MDEA for CO2 removal process. Due to the combination of
inorganic factors, the surface tension of MDEA can be controlled with the reducing of iron sulphide and sodium chloride as impurities in the natural gas stream.
From statistical model, the optimum point for maximum surface tension in the range of experiment is 74.33 mNm-1. The maximum surface tension can be achieved at the condition of iron sulphide, hydrocarbon and sodium chloride concentration of 6,346, 11,827 and 8,261 respectively. Additional experiments at the maximum surface tension condition were performed to validate the modelling results. As shown in Table 6, the experimental values of surface tension are 75.28 mNm-1. The percent error between the experimental and predicted result is 1.2%. The differences between the experimental and predicted are within the acceptable limit. From these results, it can be verified that the statistical model is a useful tool for giving an accurate prediction of the process. The response surface methodology (RSM) coupled with central composite design (CCD) is useful for predicting the experimental conditions which would give the information data about the surface tension of MDEA solution for CO2 removal processes.
Table 6. Comparison of response between predicted and observed optimization values
Iron
A clear relationship was established between the impurities and surface tension behaviour of the blended piperazine-MDEA aqueous solution. It was shown that the type and concentration of the impurities significantly affected the changes of surface tension values. The concentration of MDEA also significantly influenced to the increasing of the surface tension. Iron sulphide, hydrocarbons and sodium chloride as the
impurities in the amine solution were the most influential factors to the surface tension. The present study has also shown that the response surface methodology can be successfully used to determine the main factor of the surface tension value changes. The use of central composite design allowed fitting the experimental data to the second order polynomial expression that could predict the surface tension as a function of the most significant impurities of natural gas. ANOVA confirmed the adequacy of the second degree polynomial equation to represent the data.
REFERENCES
Belton, J.W. and Evans, M.G., (1945), Studies in the molecular forces involved in surface formation. 2. The surface free energies of simple liquid mixtures. Transactions of the Faraday Society, 41, 1–12.
Box, G.E.P., Hunter, W.G., and Hunter, J.S., (1978). Statistics for Experiment, An Introduction to Design, Data Analysis and Model Building. New York: John Wiley & Sons Inc, USA.
Carthy, J.M. and Trebble, M.A., (1996), An experimental investigation into the foaming tendency of diethanolamine gas sweetening solutions, Chem. Eng. Commun., 144, 159–171.
Chang, T.M. and Dang, L.X., (2006), Recent advances in molecular simulations of ion solvation at liquid interfaces, Chemical Reviews, 106, 1305–1322
Cornel, J.H., (1990), How to Apply Response Surface Methodology, Volume 8 USA. ASQC.
Hernández, J.A., Trejo, A., and Fadrique, J.G., (2000), Surface Tension of Aqueous Solutions of Alkanolamines: Single Amines, Blended Amines and Systems with Nonionic Surfactants, Fourteenth Symposium on Thermophysical Properties, June 25-30, Boulder, Colrado, U.S.A
Hernández, J.A., Trejo, A., and Fadrique, J.G., (2001), Surface tension of aqueous solutions of alkanolamines: single amines, blended amines and systems with nonionic surfactants, Fluid Phase Equilibria, 185, 165–175
Hesselink, W.H. and van Huuksloot, A., (1985), Foaming of amine solutions, Inst. Chem. Eng. Symp. Series, 94, 193–202.
Idris, A., Kormin, F., and Noordin, M.Y., (2006), Application of Response Surface Methodology in Describing the Performance of Thin Film Composite Membrane, Separation and Purification Technology, 49: 271–280
Jou, F.Y., Carroll, J.J., Mather, A.E., and Otto, F.D., (1996), Phase Equilibria in the System n- Butane-Water-Methyldiethanolamine, Fluid Phase Equilibria, 116, 407.
Rinker, E.B., Oelschlager, D.W., Colussi, A.T., Henry, K.R., and Sandall, O.C., (1994), J. Chem. Eng. Data, 39, 392.
Romeroa,, C.M., P´aez, M.S., Miranda, J.A., Hern´andez, D.J., and Oviedo, L.E., (2007), Effect of temperature on the surface tension of diluted aqueous solutions of 1,2-hexanediol, 1,5-hexanediol, 1,6-hexanediol and 2,5-1,6-hexanediol, Fluid Phase Equilibria, 258, 67–72.
Jungwirth, P. and Tobias, D.J., (2006), Specific ion effects at the air/water interface, Chemical Reviews, 106, 1259–1281.
Montgomery, D.C., (1997), Design and Analysis of Experiments, 4th ed., New York, John Wiley and Sons,
NY, USA. pp. 704. Tahery, R., Modarress, H., and Satherley, J., (2005), Surface tension prediction and thermodynamic analysis of the surface for binary solutions, Chemical Engineering Science, 60, 4935 – 4952
Nele, M., Vidal, A., Bhering, D.L., Pinto, J.C., and Salim, V.M.M., (1999), Preparation of High Loading Silica Supported Nickel Catalyst: Simultaneous Analysis of the Precipitation and Aging Steps, Applied Catalysis A: General, 178: 177-189.
Vijayaraghavan, K., Nikolov, A., and Wasan, D., (2006), Foam formation and mitigation in a three-phase gas–liquid–particulate system, Advances in Colloid and Interface Science, 123–126, 49–61. Rangwala, H.A., Morrell, B.R., Mather, A.E., and Otto,
F.D., (1992), Absorption of CO2 into aqueous tertiary
amine/MEA solutions, Can. J. Chem. Eng., 70, 482– 490.
Yanicki, G. and Trebble, M.A., (2006), Experimental measurements of foaming tendencies in aqueous gas sweetening solutions containing MDEA over a temperature range of 297–358K and a pressure range of 101–500 kPa, Chem. Eng. Commun., 193, 1151– 1163.
Reza, J. and Trejo, A., (2006), Degradation of aqueous solutions of alkanolamine blends at high temperature, under the presence of CO2 and H2S, Chem. Eng.