1 CHAPTER 1
INTRODUCTION
1.1 Project Background
Basically, the project aims is to do the finite element analysis of Violin Bridge. By doing the finite element analysis, the implementation of sensor can be done so that it can amplify the sound without problem happen among the musicians. Furthermore, it is expected that piezoelectric sensor can be a suitable alternative to amplify the sound as the transducer of the instrument. Currently, there is only implementing the piezoelectric sensor without concerning the highest or lowest mechanical stress point. There is no optimum position for the sensor installation. Due to that, the aim of this project is to find the highest mechanical stress point so that piezoelectric can be implementing in the musical instrument. According to the expectation, the installation of piezoelectric sensor at highest mechanical stress point can efficiently amplify the sound.
1.2 Problem Statements
Since the engineering technology development nowadays, an improvement is successfully created which needed to cope with musician problem faced. Apart from that, there are limited movements of musician during playing the instrument such as the uses of microphone which is to amplify the sound. In orchestra, there are crowded musicians with the limited space which is can reduce the ergonomic factor especially for violin musician; they need more movement to play the instrument. By using a microphone, it is possible in making noises because of the touching between the violin or hand with the microphone.
2
Now days, there are improvements in technology development to amplify the music sound such as pickup devices. The installation of pickup devices into the musical instrument, it will make the instruments become too messy with full of devices.
Besides that, there is no study about the optimum position for implement the transducer into the bridge. There are only several designs was developed by installing the sensor on the bridge accordingly to the assumption of mechanical highest stress point. For example, current position of sensor onto the violin bridge is at the middle of the bridge.
This is the reason why an analysis of finite element should be done in this project so that can improve the sound performance.
1.3 Objective and Scopes of Study
The objectives of the project are as the followings:
i. To determine stress concentration for the optimum position.
ii. To apply finite element in the market by studying the complex shape of the bridge.
The scopes of study in this project is largely involved the studies in manufacturing area.
The aim of the project is to improve the current alternative means to solve the problem issues among the musician nowadays. The project will consist mainly the application of finite element analysis modeling to find the highest mechanical stresses.
3
CHAPTER 2
LITERATURE REVIEW
2.1 Bowed Stringed Instruments
Figure 1: Bowed String Instruments
There are many types of strings instrument which are bowed instrument, plucked instrument, struck instrument, instruments played in another ways such as air movement, and traditional string instrument.
The bowed string instruments which are in use today are the violin, the viola, violoncello and the double bass according to the figure 1 above. Generally, the process of tone generation is the same in this entire instrument and the only differences are the sizes and the tonal range. [1] Based on this project, the main instrument are been focusing are violin and viola.
4 2.2 Violin Characteristic
Regarding the similar shape of the violin and viola, sometimes it confusing which one is a violin or viola. Maybe because due to the way the violin and the viola played are look so much alike. Actually, the size of viola a little bit larger than violin. The sound of viola is low and dark because it is tuned lower than the violin’s, but it is stronger. So, by using only a dozen of violas can hold their own compared to thirty two first and second violins [2]. In orchestra, violin is the most popular among the stringed instrument;
probably it can do so many things. A violinist can play slow, sad, smooth melodies and dazzling, fast scales. The violin has a very large range and it can be heard easily above a big orchestra. Therefore, its tone is very sweet and clear, and its sound good in solos [3].
Actually, both of viola and violin are made from same material and constructions.
According to Appendix A, it had shown the major parts of the violin and viola. The major parts of the instrument from top to bottom are scroll, tunning pegs, strings, fingerboard, belly, waist, f holes, bridge, sound post, fine tuners, tailpiece, and chin rest.
The parts of the bow are horsehair and frog.
Figure 2: Violin Bridge
Basically, when there is oscillation between the bow and strings, the strings will vibrate and produce sound. The pitch of a vibrating string depends on four factors. There are thickness, tension, length of free vibrate, and mode of vibration. The strings itself make hardly any noise and a sound wave is a disturbance of the air. The vibration of the
5
strings into sound in the air is transmitted through the bridge and body of the acoustic violin. Hence, the function of bridge is to transfer the energy of the vibration to the body of the violin. Due to very effective at transmitting power of the bridge to the body, it can be transfer in range of frequencies from about one until four kHz, which is where the ear is most sensitive. Actually, the bridge is only standing on the belly between the f holes.
According to the figure 2, it shows the bridge of the violin which is made from maple wood. [4]
The body is made of wood, and it has a hollow so that it can vibrate and produce sound.
The most important to determine the sound quality and probability of a string instrument is the vibration behavior of its body. In addition, the coupled motions of the top plate, back plate, and enclosed air are mainly determine the vibration modes. [5]
The bow is the most important of the violin sound. Actually, the part of the bow that touches the string is made of horsehair. The excitation of a bowed string into vibration allows the player to maintain the continuously input energy and to maintain a note. [6]
2.3 Electrification and Amplification of String Instrument
The popularity of electronics for musical instruments presents a certain technical problem. A transducer which is for this purpose is called microphones. The main function for this device is to convert acoustical or mechanical vibrations into electrical signals.
Actually, microphone can be categorized into pressure (electromagnetic coil), contact (vibration pickup), and electrostatic (condenser/electrets) microphones [7]. They are mostly designed for different frequency ranges than that of audio sound which is it can be use in building acoustics and noise control. It is important of the microphone characteristic for the performance. In addition, there are also microphones for water- borne sound which is called “hydrophones”. It can be used in underwater sound and in ultrasonic. [8]
6 2.4 Pickup
Technically, pickup is a transducer that captures the string vibrations and translates them into an electrical current. Usually, the use of pickup is to satisfy the tone of instrument.
Based on the components of violin which is the wood, string, hardware and pickups whereby all of these components have their own important role in formulating the tone and determining sound of instrument. If the musician had chose the best instrument based on the physical and feeling but the sound is not right to the musician. They will search for the suitable pickup so that the sound produced is right to them. Therefore, there are many types of pickups which is can help the musician find their own suitable tone. [9]
Table 1: Type of pickups with different positions
Pickup position Type of Pickup
Magnetic Pickups
Piezoelectric Pickups
7
Based on the table 1, it shows the type of pickups which is the most popular pickups for violin and viola among the musician are magnetic pickup and piezoelectric pickup.
Generally, a magnetic violin pickup consists of a permanent magnet winding by a few thousand of coil of copper wire. Usually, the magnetic pickup mounted on the body of the instrument such as at the tail piece and at the bridge. The energy of vibration from the strings, it will transform into magnetic flux through the coil. As the result, the signal created then been transmitted to amplification or recording equipment via a cable. There also have preamplifier stage between the pickup and cable. Basically, the magnetic pickup operation can be described using the concept of a magnetic circuit. Hence, the motion of string varies the magnetic reluctance in the circuit created by the permanent magnet.
The most popular pickups that musician always choose is piezoelectric pickup. Piezo crystal is a material which is has the ability to produce a voltage when there is existing pressure. More generally, it can convert vibration into an electrical signal. Usually, piezo transducer installed with microphone so that can amplify acoustic instruments for live performance. Actually, piezoelectric pickups are fitted with many violins rather than use magnetic pickups. Compare between magnetic pickup and piezoelectric pickup, there are very different in producing sound. It is because, magnetic pickups have high potential to capture the unwanted magnetic field which is can disturb the real tone. The advantages of using piezoelectric pickups are it have very high output impedance and appear as a capacitance in series with a voltage source. Usually, piezo pickup mounted under the bridge and sometimes form part of the bridge assembly itself. Furthermore, piezo pickups gives more wide frequency range output compare to the magnetic types.
Besides that, piezo pickup also can give large amplitude signals from the strings. [10]
8 2.5 Piezoelectric Effect
The word of Piezoelectric originally comes from Greek which is means “electricity by pressure”. This phenomenon has been discovered by the Pierre and Jacque Curie brothers. They found that several parts of the crystal surfaces having the positive and negative charges appeared when comprising the crystal in different directions, previously analyzed according to its symmetry [11]. The property called piezoelectric, actually, there are many of solid materials polarised to generate electricity which manifests itself as an electrical charge on its surface. Generally, piezoelectric effect is reversible which when a body of such a material is exposed to an electrical field its dimension will undergo certain changes [12].
Hence, the asymmetry of the coupling of vertical and horizontal displacement modes to bridge based on the vibration mode of the nylon strings of the musical instrument had been discovered. Therefore, it is necessary to apply multi-axis transduction into a stringed instrument such as piezoelectric transducer. The motion of all the strings can be captured by the transducer which equipped with a bridge as a single electrical signal [13].
Actually, piezoelectric material can manufactured in any shape or size, and the mechanical and electrical axes of the material can be oriented in relation to the shape of the material. During the process that induces piezoelectric properties in the material (poling), the axes been set. The orientation of the DC poling field determines the orientation of the mechanical and electrical axes. Due to the Piezoelectric characteristic, it is a suitable sensor to be implementing into the bridge after finding the optimum position.
9
CHAPTER 3
METHODOLOGY AND PROJECT WORK
The project is mainly divided into two different parts, which are FYP II and I respectively. In FYP I, the task is mostly consist of preliminary works like literature research. Hence, the drawing progress will be done in FYP II. The simulation is tentatively mostly to be conducted during FYP II. The overall overview of the project flow is shown in Figure 3. Based on the Table 2 and Table 3, its show the both Gantt charts of FYP I and FYP II. During, FYP II, the improvement of using CATIA software conducted to get more accurate result of the stress performance. Besides that, the improvement is also done to obtain more accurate data from the simulation.
3.1 Planning
This project is using the reverse engineering method to convert the complex shape of the bridge into digital model. Basically, reverse engineering is a method to duplicate the actual component becomes the fake component which is having same dimension of each angle [14]. Unfortunately, the digitizer of reverse engineering at building 16 in UTP is in under maintenance. In order to convert the complex shape of the bridge into digital model, CATIA have the application of tracing the model image which is by using CATIA Sketch Tracer and the normal scanner. Normal scanner is function to translate the sketch from the paper into image file. After done with the image tracing, it is easy to do the 3D modeling of the violin bridge. Then, continue with the simulation part also by using CATIA whereby CATIA can do the FEA.
In order to make the Finite Element Analysis by using CATIA, the important data is needed such as the material properties of the bridge and the force analysis. Therefore, the study of string tension acting on the bridge is important in this project.
10 3.2 Flow Chart
Figure 3: The flow chart of the project Start
Define objectives and scope of study
Literature Review
CATIA Modeling
Research for the material properties
Force Analysis
Finite Element Analysis
Stress Analysis
Recomendation and Improvement
End
FYP I
FYP II
11 3.3 Gantt Charts
Table 2: Gantt chart of the FYP 1 course
No Tasks/ Week 1 2 3 4 5 6 7 8 9 10 11 12 13 14
1 Topic Selection and Confirmation
2 Preliminary Research Work
3 Preparation of Extended Proposal
4 Transformation of Bridge into 3D Drawing
5 Proposal Defence
6 Study and Familiarize with Simulation Software
7 Run Stress Point Simulation
8 Preparation of Interim Draft Report
9 Improvement of Interim Draft Report
12
Table 3: Gantt chart of the FYP 2 course
No Tasks/ Week 1 2 3 4 5 6 7 8 9 10 11 12 13 14
1 Stress Point Determination
2 Submission of Progress Report
3 Stress Point Confirmation
4 Pre-EDX
5 Submission of Draft Report
6 Submission of Dissertation (soft bound)
7 Submission of Technical Paper
8 Oral Presentation
9 Submission of Project Dissertation (hard bound)
13 3.4 Possible Approaches
Basically, there are two techniques which is can be use to find the stress concentration at the violin bridge. The techniques consist photoelastic and modeling which is having different ways to find the stress concentration. Photoelastic is a method by using visual technique by does the observation toward the full field distributions in photoelastic material [15]. Actually, this technique needs to be done by scaling the photoelastic plastic accordingly to the part model. The photoelastic coating is temporarily applied to the actual parts in order to look more closely at the stress pattern in suspect regions of the structure [16]. Generally, the photoelastic method can be applied to the istropic material only. In order to find the stress concentration for bridge of violin which is made from wood material, therefore, this method is not suitable.
The other method which is can be use for this project is modeling method. The software is can be use for this method is Computer Aided Three-dimensional Interactive Application (CATIA) software. CATIA also can do the finite element analysis (FEA) code. CATIA Software is allow engineers to construct computer models of violin bridge by apply operating load. Hence, by using CATIA software, can determine the physical response such as the bridge stress level. Furthermore, the advantages of using simulation by CATIA software is it allow the evaluation of a design without having to build and destroy multiple prototypes in testing. Besides that, the CATIA program has a variety of design analysis application, ranging from such everyday items such as dishwasher, cookware, automobiles, and others. In addition, by using CATIA software, it also can trace the complex shape of the model.
14 3.5 CATIA Modeling
In order to draw the bridge, the dimension of the bridge is need to been trace. Actually, reverse engineering concept is the easy way to trace the dimension but it having technical problem. Therefore, an alternative can be use whereby trace the bridge and draw the bridge by manually. So, by using CATIA tracer, it can trace the bridge shape according to the sketch. Refer to the Appendix B for the procedure of CATIA Modeling.
The technical drawings for the bridge refer to Appendix C.
Figure 4: 3D Drawing of Figure 5: The front view.
Violin Bridge.
Figure 6: The side view. Figure 7: The top view.
15 3.6 Material Properties of the Bridge
Usually, the material use for make the violin bridge is Maple. Maple has the best material properties whereby the maker can make the light bridge and can maintain the acoustic properties. [17] The following table presents the value for maple properties.
There are several type of maple which is black, red, silver and sugar maple. [18]
Table 4: Physical Properties of Maple Common
name
Botanical name
Density, g/cc
Density, lbs/cu.ft.
Modulus of rupture, 12%(moisture
content), Kpa
Modulus of elasticity, 12%(moisture content), Mpa Maple,
black Acer nigrum 0.62 >38.71 92,000 11,200
Maple, red Acer rubrum 0.546 34.09 92,000 11,300
Maple, silver
Acer
saccharinum 0.506 31.59 61,000 7,900
Maple, sugar
Acer
saccharum 0.676 42.2 109,000 12,600
Referring to the table, the highest value of modulus of elasticity is Maple sugar. It shows that the material is a hard maple. Therefore, it is the best maple to face the highest load into it. Generally, sugar maple has a heavy, light brown, close-grained. It is also popular among the industries to produce furniture. This kind of maple has the abnormal grain patterns called “curly maple” and “bird’s eye maple”. Based on the maple properties, it is suitable been used to make gun stocks and violins. [19]
The value of modulus elasticity for this maple is needed to apply in finite element analysis. The stress concentration will occur according the wood strength.
16 3.7 Force Analysis
There are four strings on the musical instrument which are G, D, A and E. The strings are fixed at both ends with two anchors points which are the tunning pegs and the tail piece as shown at Figure 8. There are been stretched over a high arched bridge in order to able the musician bowing of one or two strings at a time.
Figure 8: The actual position of the strings between the two anchors.
Figure 9: The motion of the bowed strings
Tunning pegs strings bridge Tail piece
17
Based on figure 9, it shows the motion of the bow on the string. Actually, there are two motions which is the bowing motion and the snap back motion. The friction of stretching between the bow and strings will generate a restoring force which is the string will be able to drag further and tries to return to the rest position. The force will increase if the displacement of the bridge increases. Therefore, the strings start to slip. The amount of friction between two objects that are been force moving with respect to one another is higher than between two objects moving with respect to one another. So, these types of friction are called dynamic and static as shown below on Figure 10.
Figure 10: Type of bow friction
Basically, static friction happen when the bow sticks with the string in order to make a vibration until the returning forces causes it to slip as shown on figure 2 (b). After slipping, the string will snap back in order to return to the rest position which is shown at (c). So, it called as dynamic friction. At this point, the momentum of the string will take it into the region which is having low tension. As the result, after the strings return a point somewhere beyond the rest point, the dynamic friction is great enough so that the string can stick again with the bow for the second time [20]. Therefore, this project is only focusing on static friction because the amount of static friction is higher than dynamic friction in order to analyze the highest stress concentration point.
Type of Frictions
Static Dynamic
18 220N
220N
Downward force = 90N Bridge 90𝑜
String
Bridge Violin body
Tension Tension
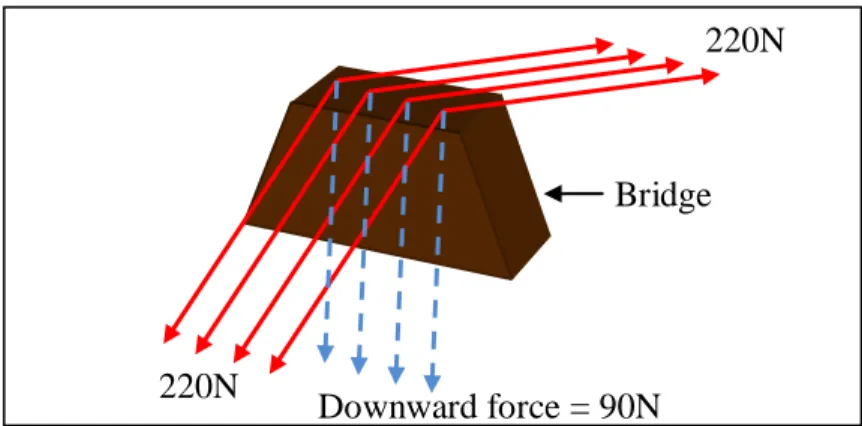
In order to generate the simulation of finite element analysis by using CATIA, the value of force need to be calculated. Basically, there are several forces acting on the bridge which is from the strings tension, downward force and bow force.
According to the Figure 11 as shown below, it shows the free body diagram of the violin which is without the downward force. The angle of string and the bridge is 900.
Figure 11: Tension string perpendicular with bridge.
According to “The Physics of Musical Instrument” by Neville H. Fletcher and Thomas D. Rossing, for example, the total tension for four strings of a violin is typically about 220N (50 lb) and this results in a downward force on the bridge of about 90 N as shown at Figure 12 shown below. The force acting is in static condition
Figure 12: Force acting by the string tension with the downward force.
19
55N 𝛼 55N
22.5N
For this example, it assuming all the tension for each string is same. Therefore, the tension of each string is 55N and the downward force is 22.5N after the total force be divided by four strings. Based on the Figure 13, it shows how the force acting on the
bridge. As the result, the value of angle between the string and the bridge is 65.85𝑜.
Figure 13: Force acting by a string on bridge during in static condition.
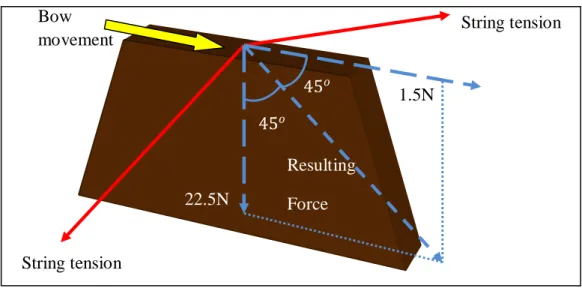
Figure 14: Force acting during the bow move to the right.
Therefore, there are several force conditions during the citation whereby to produce certain rhythm.
String tension Bow
movement
45𝑜
1.5N
22.5N
String tension
45𝑜
Resulting Force
20
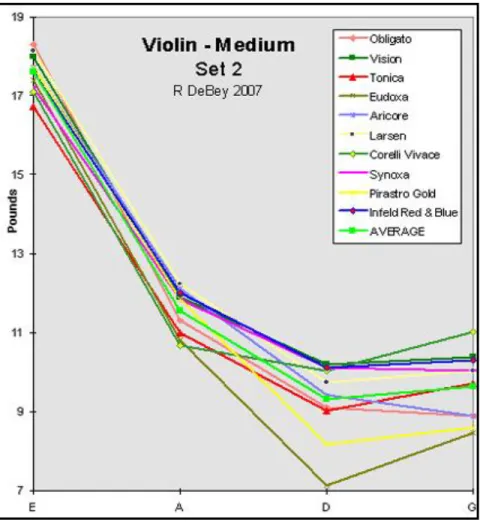
Basically, according to reference [21], it shows the graph as a visual representation to compare the variety of string tension. There are several physical properties of strings which are helpful to predict the optimal string according to its elasticity, damping, flexibility under tension, and mass per unit length under tension.
Referring to Figure 15 and Figure 16, it shows the string tension for each type of string.
Actually, there is two set of string tension graph shown. Therefore, in order to choose the suitable string tension, it is better to choose the average value whereby the tension is not too high and not too low.
Figure 15: String tension for several types of strings (Set 1).
21
Figure 16: String tension for several types of strings (Set 2).
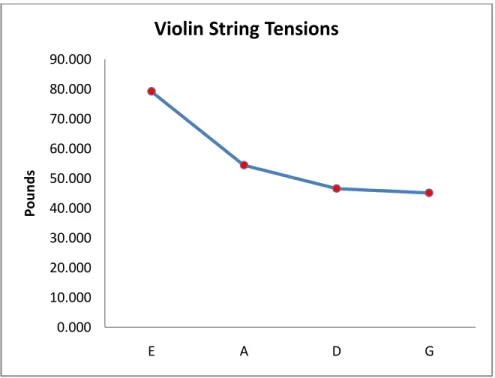
As the result, by comparing both set, the average value has been calculated including the graph. The force data calculated for each strings as shown in Table 5 below.
Table 5: Downward force of string for static condition.
Tunning Tension (pounds)
Downward Force (N)
E 18 79.201
A 12.8 54.424
D 11.6 46.551
G 10.6 45.083
22
Figure 17: Average value of string tension.
During musician playing the violin, the bow will produce force acting from bow to the string. Basically, there are right and left bow movements in order to produce music according to the rhythm. However, the bow force is varies between 0.5-1.5 N and the lowest bow force is been generated when it is on steady tone which is 0.1 N. As the result, the maximum bow force will produce high stress on the bridge which is the value is 1.5N. Generally, during the citation between the bow and the string, only one string will involve and the others in static condition.
0.000 10.000 20.000 30.000 40.000 50.000 60.000 70.000 80.000 90.000
E A D G
Pounds
Violin String Tensions
23 There are three cases for this project:
1. Case 1: Static condition whereby only string tension acting on the bridge.
2. Case 2: Only a string either string E, A, D or G bowed to the right.
3. Case 3: Only a string either string E, A, D or G bowed to the left.
Table 9: Force analysis for Case 2 (string G)
Tunning Bow movement Downward Force (N) Bow Force (N)
E Static 79.201 0.000
A Static 54.424 0.000
D Static 46.551 0.000
G Right 45.083 1.500
Table 6: Force analysis for Case 2 (string E)
Tunning Bow movement Downward Force (N) Bow Force (N)
E Right 79.201 1.500
A Static 54.424 0.000
D Static 46.551 0.000
G Static 45.083 0.000
Table 7: Force analysis for Case 2 (string A)
Tunning Bow movement Downward Force (N) Bow Force (N)
E Static 79.201 0.000
A Right 54.424 1.500
D Static 46.551 0.000
G Static 45.083 0.000
Table 8: Force analysis for Case 2 (string D)
Tunning Bow movement Downward Force (N) Bow Force (N)
E Static 79.201 0.000
A Static 54.424 0.000
D Right 46.551 1.500
G Static 45.083 0.000
24
Table 10: Force analysis for Case 3 (string E)
Tunning Bow movement Downward Force (N) Bow force (N)
E Left 79.201 -1.500
A Static 54.424 0.000
D Static 46.551 0.000
G Static 45.083 0.000
Table 12: Force analysis for Case 3 (string D)
Tunning Bow movement Downward Force (N) Bow Force (N)
E Static 79.201 0.000
A Static 54.424 0.000
D Left 46.551 -1.500
G Static 45.083 0.000
Table 13: Force analysis for Case 3 (string G)
Tunning Bow movement Downward Force (N) Bow Force (N)
E Static 79.201 0.000
A Static 54.424 0.000
D Static 46.551 0.000
G Left 45.083 -1.500
Referring to the all tables shown above, it shows the force data for each case. In order to do the finite element analysis, the data is important to continue with the simulation to get the stress concentration at the bridge.
Table 11: Force analysis for Case 3 (string A)
Tunning Bow movement Downward Force (N) Bow Force (N)
E Static 79.201 0.000
A Left 54.424 -1.500
D Static 46.551 0.000
G Static 45.083 0.000
25 3.8 Finite Element Analysis
Finite element is a numerical technique in order to find the solution of partial equations as well as integral equations. Generally, Finite Element Analysis (FEA) is an analysis for a design that is stressed and analyzed for specific results. Usually, FEA is used to analysis the new product design and existing product refinement which is the violin bridge. The modification of the bridge is needed to be analyzing in order to qualify the bridge for a new installation condition. Due to structural failure, FEA is the best way in order to help determine the design modifications to meet the new condition.
Due to this project, it is suitable to use CATIA for finding the stress concentration of the bridge. Refer to Appendix D for the procedure of using CATIA in order to do the simulation.
26 CHAPTER 4
RESULTS AND DISCUSSIONS
As the result, there are nine results after the simulation of finite element analysis. For each case, it has closer result of stress concentration. In order to define the high stress concentration is depend on the contour plot. The red color is the highest stress concentration and the blue color is the lowest value of stress concentration.
From the result for Case 2 and Case 3, there are four results for each which is the bow movement at different string. This is due to the rhythm of the music whereby musician needs to excite the different string which is either string E, A, D or G in order to get a nice music sound.
4.1 CASE 1: Only String Tension Acting on the Bridge
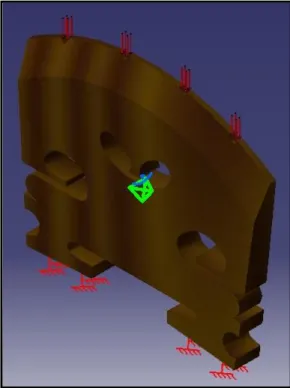
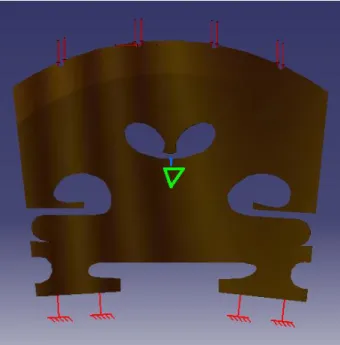
According to the Figure 18, it shows the string tension acting on the bridge without the any external force which is in static condition.
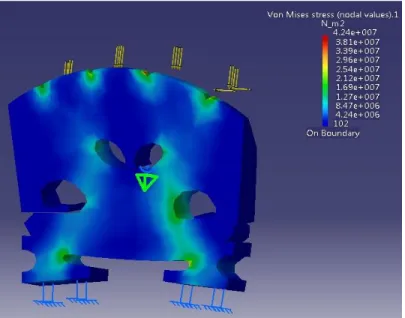
After the simulation, the result of force applied is shown in Figure 19. From Von Misses Stress, the maximum stress is 4.24 x10⁷ 𝑁𝑚2which mostly occur at the waist of the bridge.
27
Figure 18: String tension acting the bridge in static condition.
Figure 19: Stress concentration of bridge in static condition.
4.24 x10⁷ 𝑁𝑚2
A
E D
G
28 4.2 CASE 2A: Only String E Bowed to the Right
According to the Figure 20, it shows the string tension acting on the bridge including the external force which is there is only string E bowed to the right.
Figure 20: The bow movement to the right at string E acting on the bridge.
From Von Misses Stress, the maximum stress is 4.24 x10⁷ 𝑁𝑚2which mostly occur at the waist of the bridge as shown at Figure 21.
Figure 21: Stress concentration of bridge in after string E bowed to the right.
29 4.3 CASE 2B: Only String A Bowed to the Right
According to the Figure 22, it shows the string tension acting on the bridge including the external force which is there is only string A bowed to the right.
Figure 22: The bow movement to the right at string A acting on the bridge.
From Von Misses Stress, the maximum stress is 4.20 x10⁷ 𝑁𝑚2which mostly occur at the waist of the bridge as shown at Figure 23.
Figure 23: Stress concentration of bridge in after string A bowed to the right.
30 4.4 CASE 2C: Only String D Bowed to the Right
According to the Figure 24, it shows the string tension acting on the bridge including the external force which is there is only string D bowed to the right.
Figure 24: The bow movement to the right at string D acting on the bridge.
From Von Misses Stress, the maximum stress is 4.24 x10⁷ 𝑁𝑚2which mostly occur at the waist of the bridge as shown at Figure 25.
Figure 25: Stress concentration of bridge in after string D bowed to the right.
31 4.5 CASE 2D: Only String G Bowed to the Right
According to the Figure 26, it shows the string tension acting on the bridge including the external force which is there is only string G bowed to the right.
Figure 26: The bow movement to the right at string G acting on the bridge.
From Von Misses Stress, the maximum stress is 4.24 x10⁷ 𝑁𝑚2which mostly occur at the waist of the bridge as shown at Figure 27.
Figure 27: Stress concentration of bridge in after string G bowed to the right.
32 4.6 CASE 3A: Only String E Bowed to the Left
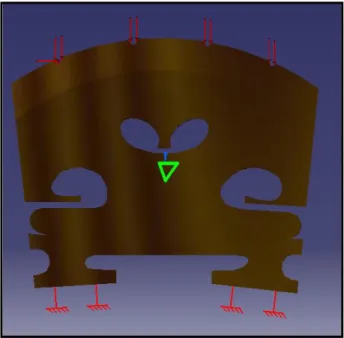
According to the Figure 28, it shows the string tension acting on the bridge including the external force which is there is only string E bowed to the left.
Figure 28: The bow movement to the left at string E acting on the bridge.
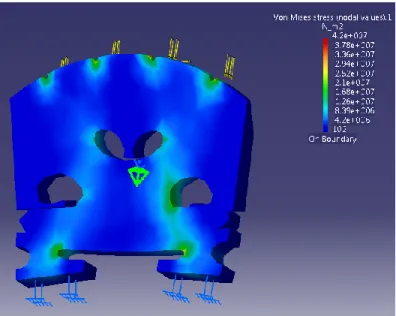
From Von Misses Stress, the maximum stress is 4.24 x10⁷ 𝑁𝑚2which mostly occur at the waist of the bridge as shown at Figure 29.
Figure 29: Stress concentration of bridge in after string E bowed to the left.
33 4.7 CASE 3B: Only String A Bowed to the Left
According to the Figure 30, it shows the string tension acting on the bridge including the external force which is there is only string A bowed to the left.
Figure 30: The bow movement to the left at string A acting on the bridge.
From Von Misses Stress, the maximum stress is 4.28 x10⁷ 𝑁𝑚2which mostly occur at the waist of the bridge as shown at Figure 31.
Figure 31: Stress concentration of bridge in after string A bowed to the left.
34 4.8 CASE 3C: Only String D Bowed to the Left
According to the Figure 32, it shows the string tension acting on the bridge including the external force which is there is only string D bowed to the left.
Figure 32: The bow movement to the left at string D acting on the bridge.
From Von Misses Stress, the maximum stress is 4.24 x10⁷ 𝑁𝑚2which mostly occur at the waist of the bridge as shown at Figure 33.
Figure 33: Stress concentration of bridge in after string D bowed to the left.
35 4.9 CASE 3D: Only String G Bowed to the Left
According to the Figure 34, it shows the string tension acting on the bridge including the external force which is there is only string G bowed to the left.
Figure 34: The bow movement to the left at string G acting on the bridge.
From Von Misses Stress, the maximum stress is 4.24 x10⁷ 𝑁𝑚2which mostly occur at the waist of the bridge as shown at Figure 35.
Figure 35: Stress concentration of bridge in after string G bowed to the left.
36 4.10 Discussions
The assumptions for this project is the boundary condition is been assumed by using isotropic. Besides that, there are two types of frictions which are static and dynamic.
Therefore, the force analysis is assumed as a static because the force acting on the bridge is higher than dynamic friction.
As the result, the stress concentration is appear at the same area of the bridge which is the position of the highest stress is at the waist of the bridge.
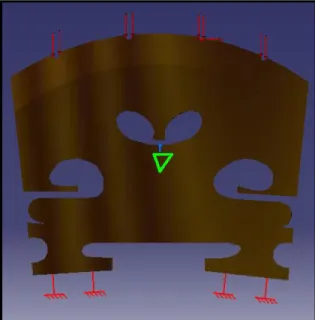
Hence, there are deformation occur for all cases which is the bridge bending after the force applied onto the bridge. Referring to the Figure 36 shown below, the bridge bends to the side of back side in static condition.
Figure 36: Bending position for static condition.
37 CHAPTER 5
CONCLUSION AND RECOMMENDATION
As a conclusion, this project is helpful to improve the performance of the musical instrument through an experimental musical instrument by using CATIA software.
Bridge of the violin is the best chosen part that can determine the stimulus toward the production of tones with characteristics acoustic timbre. There is no need to use digitizer, but only using CATIA sketcher to draw the complex shape of the bridge. A part from that, CATIA also suitable to carry out finite element analysis in complex shape. Actually, there are certain finite positions on the bridge which can be the best placement for the piezoelectric sensor plate. The position is the points that having higher strain for each maximum amplitude of the various possible modes of vibration resonances. So, by determine the stress concentration, it suitable for implement the piezoelectric sensor within the bridge. Therefore, finite element modeling and analysis can be use to develop an improved whereby finding the highest concentration of violin bridge. This project is helpful to improve the performance of the musical instrument. For the future work, it is recommendation to install the sensor into the bridge and do the experimental to prove either this analysis is acceptable or not.
38 CHAPTER 6
REFERENCES
1. Heinrich Kuttruff. Acoustics, An introduction. String Instrument : p215-222 2. Oracle Think Quest, Education Foundation. Violin and Viola retrieved February
16, 2012 from http://library.thinkquest.org/J002478F/violin_and_viola.htm 3. More about Violin. Popularity of Violin retrieved February 11,2012 from
http://www.playmusic.org/string/more/moreviolin.html
4. Music acoustics. http://www.phys.unsw.edu.au/jw/violintro.html
5. Neville H. Fletcher and Thomas D. Rossing. The Physics of Musical Instruments.
Violin Body vibrations : p285-288
6. Music acoustics. Bows and strings retrieved February 16, 2012 from http://www.phys.unsw.edu.au/jw/Bows.html
7. B. Ariwahjoedi, O.Mamat, C.Rangkuti and K.Fuad. Implementation of Piezoelectric Ceramic Sensors in Prototype Electrical Musical Instrument to Reproduce Acoustic Timbre of wood Contra-bass. Electrification and Amplification of Stringed Instruments: p4.
8. Heinrich Kuttruff. Acoustics, An introduction. Microphones : p377
9. Seymor Duncan. Is your relationship with your guitar on the ropes? What’s a
Pickup? Retrieved April 11, 2012 from
www.seymourduncan.com/support/.../how_to_pick_a_pickup.pdf
10. The Violin Site. Violin Pickups retrieved April 11, 2012 from http://www.theviolinsite.com/violin_pickups.html
11. Antonia Arnau. Piezoelectric Transducers and Applications, Second Edition.
Fundamentals of Piezoelectricity : p1-37
12. Heinrich Kuttruff. Acoustics, An introduction. Piezoelectric transducer : p361 13. Adrian Feed, Osman Isvan. Musical Application of New, Multi-axis Guitar
Strings Sensors. Introduction : p1
14. Search CIO-Market. Definition of Reverse Engineering retrieved April 24, 2012 from http://searchcio-midmarket.techtarget.com/definition/reverse-engineering
39
15. Photoelasticity. retrieved April 23, 2012 from
http://yunusbillah.files.wordpress.com/2008/02/geometri-dan-konsentrasi- tegangan.pdf
16. Hand-held Digital Polariscope. Photo elastic NDE Revival retrieved April 23, 2012 from http://as.wm.edu/Faculty/Hinders/Photo.pdf
17. Violin Wood Type. Maple retrieved July 11, 2012 from http://www.rocheviolins.com/html/violin_wood_types.html
18. Physical Properties of Common Woods., retrieved July 11, 2012 from http://www.csudh.edu/oliver/chemdata/woods.htm
19. Maple Family. Sugar Maple retrieved July 11, 2012 from http://www.uky.edu/Ag/Horticulture/kytreewebsite/pdffiles/ACERSACprint.pdf
20. Synthesizing Bowed Strings: the Violin family
http://www.soundonsound.com/sos/apr03/articles/synthsecrets48.asp 21. http://www.rdebey.com/string_tension.htm
40 APPENDIX
Appendix A
41 Appendix B
PROCEDURE OF CATIA SKETCH TRACER Step 1: Open the CATIA Sketch Tracer
Here the 3D Modelling in CATIA using Sketch Tracer Function. Firstly, open the CATIA V5.
According to the figure shown below, it is the step to open the CATIA Sketch Tracer.
Start > Shape > Sketch Tracer
Figure 37: The beginning step to open the CATIA sketch tracer.
After that, make sure the model is been set as front view by clicking icon. Next, the shading also needs to be set as shading with material function by clicking on icon.
Continue with create an immersive sketch by clicking on icon
42
Step 2: Import Bridge Image into CATIA Sketch Tracer
In order to trace the image of the bridge, the sketch of the bridge is needed. By using a paper and a pencil, put the bridge on the paper and draw the bridge according to the prototype. Then, by using normal scanner, the sketch becomes as an image file so that it can be import into CATIA.
Therefore, select the file which containing the bridge image to be open in CATIA Sketch Tracer as shown at Figure 38 below.
Figure 38: The condition of the bridge image in CATIA
Step 3: Trace the Bridge Image
After the image has been imported into the CATIA, a Sketch Parameter toolbar will appear as shown at Figure 39. The sketch parameter needs to be set as “use a cube”.
Sketch Parameters > Use a cube > Reload Image > OK
43
Figure 39: The toolbar of Sketch Parameter Then, open a new part design in the same file as shown at Figure 40.
Product (right click) > Components > New Part
Figure 40: To open the new part.
44
After that, double click on the part body to start new part drawing by referring to the sketch uploaded.
Product > Part1 >yz plane > Click
Use any icon to obtain the best fitted line of the image. Icon available such as , , and many more.
Figure 41: The yz plane view.
Then, only by tracing the image carefully, it will manage to draw the complex shape of the bridge as shown at Figure 42.
Figure 42: Trace the bridge image.
45 Step 4: 3D Modeling
Once drawing is finished, proceed for 3D modeling.
Extrude the sketch to form a 3D object by clicking icon. Then, draw lines on the side view of the bridge. Extrude the shape with thickness similar to the length of the bridge. Boolean operation is applied.
Figure 43: Boolean Operation
According to the bridge shape, it has a curve on the top side. Then, a chamfer is needed to form a curve smoothly.
46
Figure 44: Before and after chamfer.
Then, the model need to be scale in according to the actual size of the bridge as shown at Figure 45. Finally, the 3D modeling of the bridge is completed.
Figure 45: Scale in the model size.
47 Appendix C
48 Appendix D
PROCEDURE OF CATIA SIMULATION Step 1: Define Properties
There are several ways to do the finite element analysis which is by using ANSYS and CATIA. Both of this software has the simulation in finding the stress concentration. For this project, the chosen software is CATIA V5. Here it is the procedure to do the finite element analysis by using CATIA. This procedure is referring to Case 1 which is in static condition.
Figure 46: The complex shape of the bridge.
The first step is to set the material properties that the bridge made. Generally, the bridge is made from wood and the most popular wood in making the bridge is Maple. For this project, the chosen Maple is Maple Sugar which is have modulus elasticity of 12,600 Mpa. Next, to set up the material for the bridge is by clicking . The material catalog will open; hence, there is several type of material including wood. By clicking the wood, it will appear variety of wood such as Alphine Fir, Bark, Beech and others as shown at Figure 47.
49
Figure 47: The material catalog for apply the material on the model.
Figure 48: Shading with the chosen material.
50
Actually, in CATIA, the modulus elasticity cannot be set manually exactly with the value of 12,600 Mpa. Unfortunately, there is no Maple in the catalog. Therefore, the closer value of modulus elasticity for maple is Dark Oak which is having 12,300 Mpa.
Next, the model has been clicked first and then the Dark Oak box. So, the model successfully been set with chosen modulus elasticity.
After set up the material, by clicking the model can be change into the shading material as shown at Figure 49. As the result, the bridge model changed into the Dark Oak shading referring to the figure shown below. Therefore, the model is already to begin with the simulation for the finite element analysis.
Figure 49: After shading the bridge with the chosen material.
Step 2: Generative Structural Analysis
In order to start with the simulation, go to the Generative Structural Analysis (Start >
Analysis & Simulation > Generative Structural Analysis) as shown at Figure 50.
51
Figure 50: The beginning step of the simulation.
Then it will appear a message box as shown at Figure 51 in order to choose the New Analysis Case. According to this project, the analysis chosen is Static Analysis. Next, click OK to continue the next step.
Figure 51: To set up the New Analysis Case.
52 Step 3: Specify Initial Condition
Generally, initial condition and constraint must be specified. For this analysis, the bridge model will be clamped at the two bottom face of the bridge. It is because the position of the bridge is perpendicular with the violin body. Actually, the bridge only been supported by the string tension to stand on the surface of the violin body. Therefore, these both face need to be clamp as a fix condition.
In order to clamp the both faces, click at the clamp button, .Then a message box will appear so that can clamp the first face. Select the first face and click OK. Next, continue with the second face as shown at Figure 52 and Figure 53.
Figure 52: To clamp the first face of the bridge.
53
Figure 53: To clamp the second face of the bridge.
Step 4: Distributed Force
Basically, there are four strings which is the tension acting on the bridge. Each string has different value of downward force acting on the bridge. Therefore, the force needs to be distributing separately for each string. In order to define the force, click on the distributed force button, . Then, a message box will appear which is to put the force data. Four values of string tension input used were 79.201 N, 54.424 N, 46.551 N and 45.083 N. These values were found from the analysis of the graph string tension.
Referring to the Figure 54, 55, 56 and 57, it shows the force applied onto the bridge for each string. The position of the downward force is at opposite direction with Z axis which is putting the negative value of the force.
In addition, for the other case such as for Case 2 and Case 3 which are there is external force acting on the bridge. The external force of 1.5 N is from the bowed movement to the certain string. For example, for Case 2 which is there is only external force acting on the string E whereby the bowed move to the right. Therefore, the positive value applied to the Y axis.
Referring to the Figure 58, it shows the position of the bow move to the right.
54
Figure 54: Define the downward force and apply them onto the position for string E.
Figure 55: Define the downward force and apply them onto the position for string A.
55
Figure 56: Define the downward force and apply them onto the position for string D.
Figure 57: Define the downward force and apply them onto the position for string G.
56
Figure 58: Define the bowed force to the right and apply them onto only the position for string E.
Step 5 : Compute
Next, the force applied will be compute by the CATIA by click on the compute button, as shown at Figure 59. Then, a message box will appear, so, to continue by clicking OK. Therefore, the CATIA will compute the bridge model automatically.
57
Figure 59: To compute the bridge model.
Step 6: Von Mises Stresses
After completed the compute process, the next step is to apply Von Mises Stresses so that can get the result of stress concentration position. By clicking on the Von Mises Stresses button, , stress distribution in this case is shown by Figure 60. If any stress distribution plotted seem to be irrelevant, the predefine loads parameters must be revised. Some cases include improper stress distribution which shows the position of the stress concentration have too much different with the other cases. In case this happen, the value of downward force must be revised by repeating the application of force distribution. Basically, the contour plot will be plotted to show the stress distribution.
As the result, the optimum position of stress concentration is at the back side of the bridge as shown at Figure 61. In addition, because of too much stress, the bridge will bend.
58
Figure 60: Stress distribution of the bridge model on the front side.
Figure 61: Stress distribution of the bridge model on the back side.