Employment Sector
Employment Working Paper No.
100
2011
The impact of the financial and
economic crisis on ten African economies
and labour markets in 2008-2010
Findings from the ILO/World Bank policy inventory
Catherine Saget and Jean-François Yao
Copyright © International Labour Organization 2011 First published 2011
Publications of the International Labour Office enjoy copyright under Protocol 2 of the Universal Copyright Convention. Nevertheless, short excerpts from them may be reproduced without authorization, on condition that the source is indicated. For rights of reproduction or translation, application should be made to ILO Publications (Rights and Permissions), International Labour Office, CH-1211 Geneva 22, Switzerland, or by email: pubdroit@ilo.org. The International Labour Office welcomes such applications.
Libraries, institutions and other users registered with reproduction rights organizations may make copies in accordance with the licences issued to them for this purpose. Visit http://www.ifrro.org to find the reproduction rights organization in your country.
ILO Cataloguing in Publication Data
Saget, Catherine; Yao, Jean François
The impact of the financial and economic crisis on ten African economies and labour markets in 2008-2010 : findings from the ILO/WB policy inventory / Catherine Saget and Jean-François Yao ; International Labour Office, Employment Sector, Economic and Labour Market Analysis Department. - Geneva: ILO, 2011
1 v. (Employment working paper ; No.100) ISBN: 9789221255956;9789221255963 (web pdf)
International Labour Office; Economic and Labour Market Analysis Dept
economic development / employment / unemployment / economic indicator / economic recession / economic implication / social implication / trend / Benin / Burkina Faso / Cameroon / Egypt / Ghana / Kenya / Mali / Mozambique / Nigeria / Tanzania
03.02.3
Abstract
The main contribution of this document is to analyse the financial and economic crisis impact on economies and labour markets, and a range of policy responses in 10 African countries, namely Benin, Burkina Faso, Cameroon, Egypt, Ghana, Kenya, Mali, Mozambique, Nigeria, and Tanzania. This document compares policy measures implemented in 2008-2009 in these ten economies using data from the ILO/WB inventory of policy responses to the financial and economic crisis.
It looks at fiscal policy responses using data on direct beneficiaries and costs reported in this inventory. These measures included oil and food subsidies to answer the rise in commodity prices up to May 2008. The packages also included new measures to support agriculture and exports, to build and maintain infrastructure, and to create jobs for youth, as well as, in four cases, an increase in public wages.
The designations employed in ILO publications, which are in conformity with United Nations practice, and the presentation of material therein do not imply the expression of any opinion whatsoever on the part of the International Labour Office concerning the legal status of any country, area or territory or of its authorities, or concerning the delimitation of its frontiers.
The responsibility for opinions expressed in signed articles, studies and other contributions rests solely with their authors, and publication does not constitute an endorsement by the International Labour Office of the opinions expressed in them.
Reference to names of firms and commercial products and processes does not imply their endorsement by the International Labour Office, and any failure to mention a particular firm, commercial product or process is not a sign of disapproval.
ILO publications and electronic products can be obtained through major booksellers or ILO local offices in many countries, or direct from ILO Publications, International Labour Office, CH-1211 Geneva 22, Switzerland. Catalogues or lists of new publications are available free of charge from the above address, or by email: pubvente@ilo.org
iii
Preface
Following the G20 leaders' statement at the London Summit in April 2009 inviting the ILO "working with other relevant organizations, to assess the actions taken and those required for the future [in the areas of employment and social protection policies]", a joint ILO/WB Inventory of policy responses to the 2008 financial and economic crisis was one of the initiatives adopted by the ILO. The Inventory follows the framework of policies provided by the ILO's Global Jobs Pact and contains information of policy responses in four major areas (macroeconomics and employment, social protection, international labour standards and social dialogue) for 77 countries. For all recorded measures, the Inventory database gives, whenever possible, information on costs, time frame, target population, number of beneficiaries, impact and whether the measures resulted from social dialogue.
The Inventory project has been managed in the Economic and Labour Market Analysis Department of the ILO by Catherine Saget (Senior Economist, and manager of the project) and Moazam Mahmood (Director), under the responsibility of Jose Manuel Salazar (Executive Director, Employment Sector). On the World Bank side, the project was managed by Friederike Rother (Operations Officer), David Newhouse (Labour Economist), and David Robalino (Director) of the Labour Markets Team, under the responsibility of Arup Banerji (Director, Social Protection and Labour). On the ILO Regional Office for Africa side, Charles Dan (Regional Director) and Mpenga Kabundi (Deputy Regional Director) provided support and guidance in the data collection and analysis.
This paper discusses the impact of the crisis on economies and labour markets of ten African countries from 2008-2009 based on the information of the ILO/World Bank (WB) Inventory of policy responses to the financial and economic crisis. The paper also includes ten Country Briefs, four pages summarizing the social and economic effects of the crisis, as well as the policy responses. These Country Briefs were prepared for the 2nd African
Decent Work Symposium on Building a Social Protection Floor with the Global Jobs Pact, which was convened under the auspices of H.E. President Paul Biya, Republic of Cameroon, and organized in collaboration with the ILO and was held from 6-8 October 2010 in Yaoundé. The financial support of the ILO Regional Office for Africa, as well as the support of the French Government via the APERP (Appui à la Promotion de l'Emploi et la Réduction de la Pauvreté) project was highly appreciated.
The Swiss Secretariat of the Economy (SECO) provided financial support to the Inventory project to the ILO and to the WB through the Multi Donor Trust Fund. This support is gratefully acknowledged.
José Manuel Salazar-Xirinachs Executive Director
Acknowledgements
v
Contents
Page
Preface ... iii
1.Introduction ... 1
2.Transmission of the crisis ... 3
3.Labour market indicators ... 8
4.Policies implemented as a response to the crises ... 11
Conclusions and future perspectives ... 15
References ... 19
Country Annexes ... 21
Burkina Faso ... 23
Benin ... 29
Cameroon ... 33
Egypt ... 41
Ghana ... 47
Kenya ... 55
Mali… ... 63
Mozambique ... 69
Nigeria ... 75
Tanzania ... 81
Tables Table 1: Real GDP growth rate (in per cent) between 2008 and 2011 ... 3
Table 2: Ratio of exports of goods to GDP, 2009 (in %) ... 4
Table 3: Impact of the crisis on tourism ... 5
Table 4: Gross capital formation 2002-2009 (% of GDP) ... 5
Table 5: Yearly changes in FDI inflows in 2008-2009 ... 6
Table 6: Changes in remittances in 2009 ... 6
Table 7: General government fiscal balance, excluding grants ... 7
Table 8: Changes in government revenue, excluding grants, and in government expenditure, as a percentage of GDP, 2009 with respect to 2006 ... 8
Table 9: Labour market indicators ... 8
Table 10: Increase in population aged 20-24 years, 2001-2010 (in %) ... 9
Table 11: Fiscal package as a percentage of GDP ... 11
Table 12: Composition of fiscal packages: Support to agriculture ... 12
Table 13: Composition of fiscal packages: Support to export sector ... 12
Table 14: Composition of fiscal packages: Support to infrastructure ... 12
Table 15: Additional support to youth employment ... 13
Table 16: Main mechanisms of transmission of the crisis ... 15
1
1. Introduction
1This document examines the effect of the 2008 financial and economic crisis on African growth and labour markets by focusing on ten economies. The crisis originated in the real-estate sector of the United States in 2007 with the defaulting of mortgages, before spreading to other sectors of the economy, and to industrialized countries and their trading partners. The crisis eventually affected Africa in late 2008, where its adverse impact on growth and labour markets was added to other structural crises: poverty and inequality, rising commodity prices in 2007/08, demographic challenge, lack of infrastructure (Majid, 2011). Also these crises were far worse in low-income countries, where high level of growth in the 2000s reflected increases in commodity prices and did not translate into employment creation in industry nor – with a few exceptions- in higher GDP per capita (ILO, 2011). On the more positive side, the pre-crisis macroeconomic situation in many African countries, with lower inflation, and smaller budget deficits, was sounder than a decade earlier.
The main contribution of this document is to analyse the crisis impact on economies and labour markets, and a range of policy responses in 10 African countries, namely Benin, Burkina Faso, Cameroon, Egypt, Ghana, Kenya, Mali, Mozambique, Nigeria, and Tanzania. It does so by comparing the transmission of the crisis from industrialized economies to these countries, through reduction in the price and volume of exports, credit contraction, decrease in investment, lower tourism receipts and remittances, and effects on the state budget of increased public spending and reduced governments’ revenues. It shows that countries were affected through different factors with varying intensities. Some countries suffered several shocks (Egypt, Benin and Nigeria), while others seemed more isolated from the global financial and economic turmoil (Burkina Faso, Mali). On labour market effects, there is evidence of employment losses and/or increases in unemployment rates for two countries, with women being more adversely affected in both cases. More sporadic evidence of employment shedding in the export-oriented sector or tourism is also provided for all other countries.
This document then compares policy measures implemented in 2008–2009 in these ten economies using data from the ILO/WB inventory of policy responses to the financial and economic crisis. The main results regarding policy responses to the financial crisis are the following. There was a relaxation of monetary policy in nine out of ten countries, which provided liquidity to the economy, especially the export sector.
Also, eight countries introduced additional measures to stimulate demand and protect living standards. In general, these measures included oil and food subsidies to answer the rise in commodity prices up to May 2008. Spending on food and energy measures represented on average .71 per cent of GDP per year in countries for which data were available. Therefore initiatives taken in 2008/10 include food crisis measures and the need to appease social tensions and are not related to the 2008 financial and economic crisis.
1 Catherine Saget is the author of the cross-section analysis. Jean-François Yao prepared the 10
On average, the fiscal package amounted to 2.0 per cent of GDP. Although it is not easy to identify crisis responses from measures that had already been planned and budgeted before the crisis hit, this percentage is broadly in line with other estimations of additional spending due to the crisis (for example, IMF, Article IV reports). Additional spending was permitted by a combination of relatively low budget deficits prior to the crisis (with the exception of Burkina Faso, Ghana and Mozambique), debt relief initiatives in five countries and support from international financial institutions.
The packages included new measures to support agriculture and exports, to build and maintain infrastructure, and to create jobs for youth, as well as, in four cases, an increase in public wages. By order of decreasing importance, support to infrastructure, agriculture-related measures, youth programmes and increased public wages were the main elements of fiscal packages in terms of costs. The budget for export-support measures appears to be the smallest, to the extent that the two countries, for which data are reported, represent the full sample.
In terms of labour market impact, additional support to infrastructure and agriculture may create the enabling environment for economic development, while also providing new employment and income support opportunities in the short term.
Additional funds to youth employment programmes could provide substantial relief to unemployed youth but given their modest size (.4 per cent of GDP) are unlikely to be sufficient to create enough jobs to alter unemployment and under-employment in a significant way.
The increase in public wages in four countries could be interpreted as much as a catching-up exercise after years of stagnation, as an answer to social turmoil in urban areas following the rise in food and energy prices in 2007/08.
The effect of export measures, which are the most direct policy response to the financial crisis, is more difficult to assess, mainly because exports are capital intensive in some countries (aluminium in Mozambique) and labour intensive in others (flower cutting in Kenya). All-in-all, the rebound in exports in late 2009 is largely independent from these measures, but the fact that enterprises were in a position to benefit from the rebound, thanks to credit lines and credit guarantees, might have been.
3
2. Transmission of the crisis
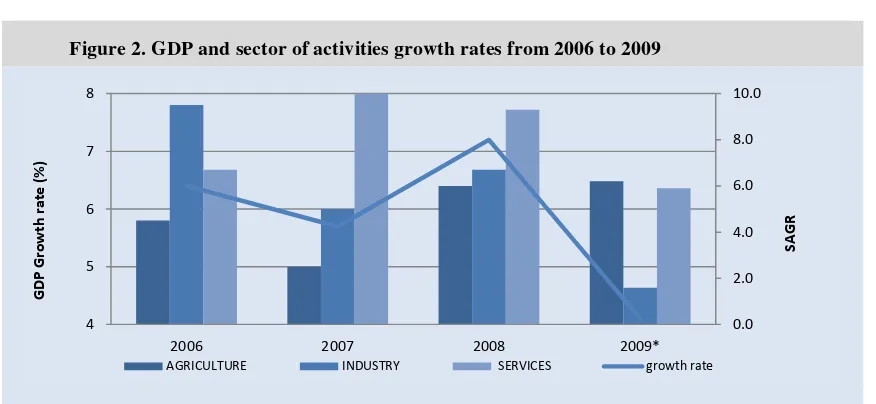
Economic growth was much lower in 2009, the peak of the crisis at the global level, than the year before. 2 Growth rates in the sample of ten African countries fell to 3.7 per cent in 2009, from 5.7 per cent in 2008. The decrease in growth rates was about 2 to 3 percentage points in Benin, Burkina Faso, Egypt, Ghana, Nigeria and Tanzania. The decrease was smaller in Mali and Mozambique and even smaller in Cameroon and Kenya, where growth in 2008 was lower than in the rest of the group. Given the importance of agriculture in these economies, part of the decline in growth rates is also attributable to geographic factors (rain, natural disasters). The decomposition of GDP in 2008 shows the overwhelming share of household final consumption which represented between 70 and 87 per cent of GDP in our groups of countries, against between 9 and 22 per cent for general government final consumption expenditure.3 Gross fixed capital formation is more modest
at 17–25 per cent of GDP, and exports comprised between 15 and 42 per cent.
!
! " #
! $ % & #
' # #
( $ # #
#
) * + ,! - ". * * / " . % 0 1
Exports
As Figure 1 shows, the volume of exports of merchandise took a major tumble in 2008 in Mozambique, declining by 12.8 per cent, followed by Burkina Faso (-9.7 per cent). In 2009, exports of merchandise decreased in Tanzania (-11.9 per cent), followed by Mali (-10.9 per cent), Kenya (-9.9 per cent) and Nigeria (-6.3 per cent). These declines occurred against the background of continuous increases over 2000–07 for all countries except Cameroon and Nigeria, which came after decades of slow growth. In Egypt, the volume of exports continued to increase over the period. Of course, these changes have more impact
2 Growth prior to the crisis (during the global boom years of 2002-2007) exceeded the trend level in
most countries (except for Kenya which was due to the violence that occurred at the end of 2007/2008), and reflected increased in commodity prices rather than broad-based development of the economy.
in countries where exports represent a high share of GDP such as Nigeria, Mozambique and, to a lesser extent, Cameroon and Egypt (Table 2). The ratio of exports to GDP declined in a majority of countries.
Turning to the reduction in the prices of exports, fuels and mining products were hardest hit by the recession. Exports of oil (99 per cent merchandise exports in Nigeria, 53 per cent in Cameroon, 42 per cent in Egypt) reduced by 38 per cent in Cameroon, 40 per cent in Nigeria and 28 per cent in Egypt. Lower demand for mining and quarrying in 2008 and 2009 affected Benin, Cameroon, Ghana, Mali and Tanzania. Turning to exports of agriculture products, food export reduced by 10.6 per cent in Kenya, 11.1 per cent in Ghana, 30.2 per cent in Cameroon, and 11.2 per cent in Tanzania. The drop in the demand for, and in the price of, cotton affected Burkina Faso, Benin and Mali. As a result, the share of cotton in total exports in Mali, for instance, decreased from 60 per cent in 2005 to 29 per cent in 2009. On the positive side, growth in Mali was sustained by exports of mining products, and agriculture. Similarly, increase in gold production and in the price of gold supported exports in Mali, Burkina and Tanzania.
" #$ % & ' ( )
) * + 2' (34)(3(
* $ % * % ( +
'3
#
#
# # # #
! "
! $ % & #
Benin
Burkina Faso
Cameroon
Egypt
Ghana
Kenya
Mali
Mozambique
Nigeria
Tanzania
E
x
p
o
rt
v
o
lu
m
e
i
n
d
e
5 Tourism
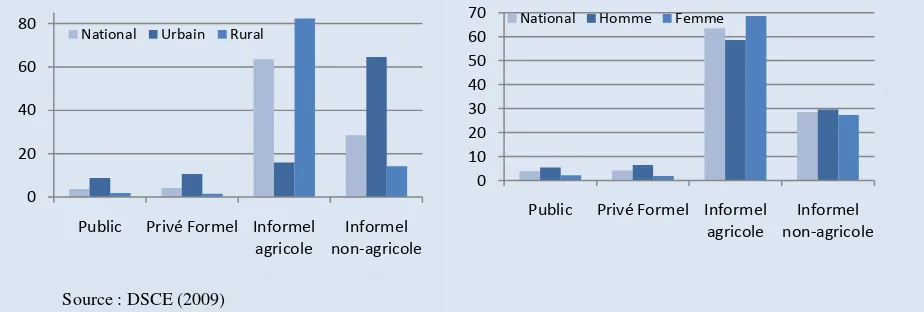
Tourism represents 10.9 per cent of total employment in Egypt, 7.3 per cent in Kenya, and 6.3 per cent in Tanzania, while its share is 5 per cent on average in sub-Saharan Africa (Table 3). The recession in rich countries translated into a drop in tourism receipts for many countries, for example 17 per cent in the first quarter of 2009 in Egypt.
, -' * % % %'
, . * 7
8 . 596
*
7 " 0 7 4:
4 " * % 9
; * 5* * 60 4 * . <
= 7 & 7 ; *
% 7
7 " 7 4:
4 * % 9 8 * 7 9
( $ # 7 "
7 4:
'3
) % ) 37 *
7 " # 7 4:
; " 7 37 * 8 * . * . %
9 8 . % 9 5* * 6
' 37 * 7 "
7 4:
) * + 2'-(/8 - ". ( 8 > 0 - ". ( ? " . ( * " * 8
Investment, Foreign Direct Investment (FDI) and portfolio investment
Gross capital formation as a percentage of GDP declined in Egypt and Ghana between 2008 and 2009, while it increased in the other three countries for which data are available: Benin, Kenya, and Mozambique, albeit from modest levels (Table 4).
. %% * ' ) + *
! <
'3 '3
'3
#
! " '3
! $ % &
' '3 '3 '3
( $ '3
) * + - - ". 4 ? " , . *
' + + 4 7 # . 0 + . 7 0 ( $ + 4 7 8
Amongst countries where FDI represented an important share of gross fixed capital formation in 2002–07, such as Egypt, Nigeria, Mozambique, Benin and Ghana, three recorded declines of FDI inflows during the crisis (Table 5), these were Benin, Egypt and Nigeria. In the remaining two countries, Ghana and Mozambique, FDI inflows continued to increase at a rapid pace.
Tighter global credit and investor risk aversion had also led to a reversal of portfolio inflows in Africa after the peak of the financial crisis in September 2008 (IMF Regional Economic Outlook, April 2009).
Both trends have limited new investment projects in a number of countries, such as, for instance, in the mining and quarrying sector in Burkina Faso.
/ 0 % " - * % )
) 7 4, 7 @ . * "
7 596
*
4, 596
4, 596
< <
' <
! $ % & #
< < # # #
) * + 2' (34 )(38 4 * , ? 7" ; 8 2) . "" 8 * *
1 % ' %
A * *
7 4: # *
* 7" ;
; * 596
) " '
# ! "
< # #
# <
) * + - ". 8 ! . A * * %
7 Financing recovery packages
Many countries in our sample were in a better financial position in 2008–2009 than a few years before. Cameroon benefited from the Heavily Indebted Poor Countries Initiative (HIPC) and the Multilateral Debt Relief Initiative (MDRI) in 2006, Ghana in 2004, and Benin, Mali and Mozambique earlier.4 In Ghana, resources freed by the MDRI and HIPC in
2009 were used to strengthen youth employment programmes.
Tanzania’s sound fiscal position in 2008 allowed the government to finance the fiscal package by borrowing from national and international markets. Tanzania also received increased assistance from development partners, equivalent to 0.4 per cent of GDP. In Mali, privatization of the telecommunications company, and the increase in mining revenues in 2009 provided the government with additional budgetary resources to respond to the crisis. Some countries managed to finance a substantial part of the fiscal package through bonds in the domestic market. For example, Kenya issued three bonds between early 2009 and March 2010 to finance 90.7 per cent of the fiscal package.
2 & ' * % ( $ %
1
< # < <# <#
< < < <
< <
< < < <
< < < <
< < <# <
! " < < < <
! $ % & < < < <
' < < <
( $ < # < < <
3? <# # <# < <
) * + ,! 8 A " * * / " + ) %<) 37 * 8 ! .." . " 3 8 /* 1
Budget deficits increased in eight out of ten countries over the period 2008–2009, including in Benin, Burkina Faso, Cameroon, Egypt, Kenya, Mozambique, Nigeria and Tanzania (table 7). In Ghana, budget deficit decreased from 19.4 per cent of GDP in 2008 to 15.3 per cent of GDP in 2010, still the highest deficit amongst counties in the sample that year.
Trends in budget balances are the result of changes in government revenues and expenditure (Table 8). Budget balances have suffered from decreased receipts and increases in priority social spending in two oil exporting countries: Nigeria and Cameroon. In Benin,
4 The HIPC and the MDRI provide debt relief so as to free up additional resources to help elected
Ghana, Kenya, Mozambique and Tanzania, government revenues increased between 2006 and 2009, as a percentage of GDP, but much less than the increase in spending.
In addition to the lower level of economic activity, which automatically generates less revenue, many countries also decreased taxes. For example Tanzania reduced several taxes (VAT, income tax, oil tax) thereby decreasing government revenues by .43 per cent of GDP.
% & ' & ( $ %( & ' $ ( %
* ( % 1
! " ! $ < % &
' ( $
3?
A ? # < < < <
@ . < < #
) * + ,! A " / " /* % + ) %<) 37 * 8 ( %" )3 8 )3 0 . ,! A " / " /* % + ! .." . " 3 8 ( %" .
As for the impact of the crisis on official development aid (ODA), Ghana recorded a one per cent decline in aid in 2009 relative to 2006.
3. Labour market indicators
Often the labour markets adjust in these countries through an increase in informal employment, and changes in labour supply patterns. Unemployment is unlikely to be a very good indicator because of the large informal sector and its role as a buffer, and the absence of a social protection system covering a substantial share of workers. However, unemployment did increase in the two countries for which there are national statistics.
3 ' 4 %
" 2 "
3 . 8 B % " ; * . .
% ; . 7 . . 7
( " 7 ;
* . 7 9 .
7 * 8 ; " 7
. * . 7 9 ?
. 7
'
( " ; 9 ! *
8 * . 9 .
( $
C 7 7 " " ; .
( $ * "" * ;
" " * " . ; 8 . * 5 . 8 " .
6
, 8 % 7 . 9 7
9
Before turning to labour market indicators, it is worth noting that labour regulations in these countries, including hiring and firing legislation are relatively flexible so that enterprises were in a position to adapt their labour demand to the new situation fairly rapidly (see Barbier and Pagès, 2011 for a discussion on labour market institutions in the French-speaking group of countries). Also regulations are poorly enforced.
Youth employment indicators
All countries in the sample face the challenge of massive increases in the population size, mainly youth. While population growth has not changed as a result of the crisis, it makes the school-to-work-transition even more difficult. In Nigeria, for example, 47 per cent of the population is below 15 years. Over the period 2001–10, the cohort of youth aged 20–24 years increased on average from 2.22 per cent a year in Mozambique to 3.32 per cent a year in Benin (Table 10).
Regarding youth indicators, the unemployment rate for women aged 15-24 deteriorated, from 43.5 per cent in March 2007 to 48.9 per cent in March 2009 in Nigeria. Over the same period, the unemployment rate for men aged 15-24 reduced from 56 to 51.9 per cent.
- % ) . %( ) +
# 3?
# # #
#
# < # < #
#
! " # #
! $ % & #
' # #
( $ ## # # ## #
) * + ,C/ C % 8
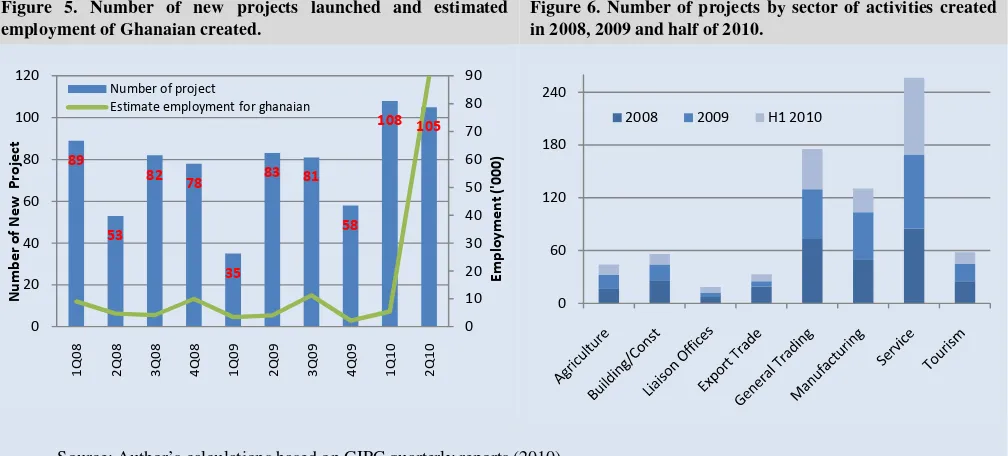
The available evidence in some countries showed that the school-to-work transition was becoming increasingly difficult. In Egypt, the labour force increased by 400,000 individuals between August 2008 and August 2009, instead of the estimated 700,000.5 This gap could indicate discouragement among unemployed youth or a longer stay in the education system. Ghana’s economy should create 230,000 jobs every year in order to cope
5 The estimate is based on demographic trends. Source: ILO, 2010, Laborsta,
with increasing population size, mostly youth. To give an idea of the challenge, this should be compared with the 103, 928 jobs expected to be created by FDI in 2010.
Working conditions’ indicators
It was reported that employees who kept their jobs in the Tanzanian tourism sector experienced a decline of 10 per cent of their monthly wage. Worsening working conditions (lower wages and higher expectations) were also reported in exports’ sectors. Minimum wages were increased in Kenya and in Mozambique in 2009.
Public sector
The public sector is a major provider of formal employment in low-income and lower-middle income countries. In Ghana, Cameroon, and the five LDCs in the sample, public sector employment can represent up to half of formal employment. In addition, public wages have increased in 2008–2010 in five countries of the sample.
Ghana has implemented a Single Spine Pay Policy, which is aimed at reducing and eliminating wage discrimination in the public sector. Following this policy, over 500,000 public sector employees will have seen an increase in their wages in 2010. This measure, whose full implementation will cost US$2.2 billion (or 6 per cent of 2010 GDP) will contribute to improving the living standards of some of low-paid public workers. In Benin, the public wage bill increased by 24 per cent between 2008 and 2009.
There was also an increase in public wages in Cameroon in 2008 (after a massive decrease in the 1990s).
In Mali, an agreement was reached to increase wages for teachers over 2009–2010 for an amount equivalent to .05 per cent of GDP. These measures were taken after years of nominal stability, usually as part of renewed efforts to achieve MDGs.
In Kenya, public wages increased by between 14 and 28 per cent. The rise was applied in such a way as to increase wage differentials between low paid and high paid public workers.
In Nigeria, part of the fiscal package representing .02 per cent of GDP was used to settle a part of wage arrears to workers in public companies and the government sector.
11
4. Policies implemented as a response to the
crises
Food and energy crisis
. . 59 7 4:6
, * %" * ; : * % .
4 * @ 7 % *
#
5 6
A . * 7 % * 7 . 5 6
) % . 7 . . " # 5 6
) * + ,C/D- , ? 7 " * 7 * " . * * *
Financial crisis
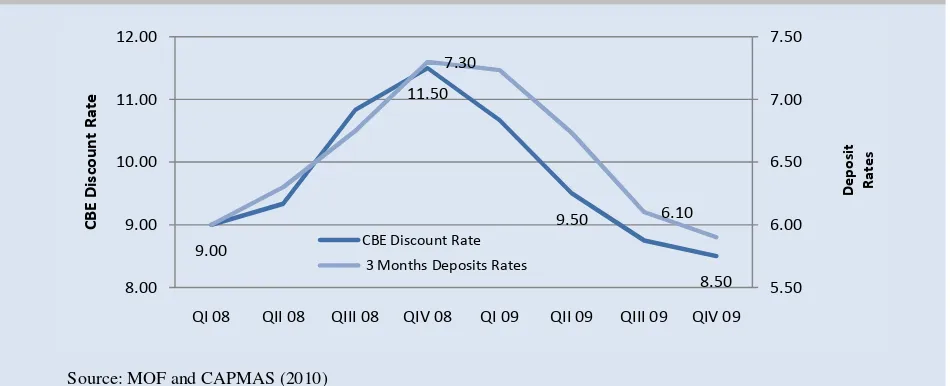
Nine out of ten countries in the group eased monetary policy in 2009/2008. Egypt, the Bank of Central African States (Cameroon), the West African Economic and Monetary Union (Benin, Burkina Faso and Mali), Kenya, Mozambique, Nigeria, and Tanzania reduced interest rates in 2008/2009 at least once. Ghana did not because of inflationary pressures. In addition, some countries also decreased the mandatory reserve coefficient for banks, such as Egypt, Kenya, Mozambique and the Bank of Central African States (Cameroon).
" % 4 % *
( 7 * 9 7 4:
#
! " #
'
( $ < #
) * + ,C/D- , ? 7 " * 7 * " .
' % * * % 4 % 5
3 * " 9 7 4:
) % . E * "
! " ) 7 . 77 * *
( $
) * " < 8 *" . +
) * " % , . 7
. 7 "" 7
#
' ) * " " *
) * *
) * + ,C/D- , ? 7 " * *
, ' % * * % 4 % 5 $ %
!
)* " @
) % . * #
) @ * 8 *" .
* " '3
) @ * .
. ? 7 * '3
' @ " *
) * + ,C/D- , ? 7 " * *
. ' % * * % 4 % 5 * %
! 59 7 4:6
, 7 * ? " % < ? * 8 %" ; . ; 8 . . % . 8 . % ". 7 * " . % * " * 7 * "
? <
' , 7 * . ? " . * #
, 7 * B *
! " , 7 * *" . +
( 8 " * .
)* " 8 ? . *
) 7 *
( $ , 7 * . ? "
! $ % & ( 7 * . ? " '3
) * + ,C/D- , ? 7 " * *
13
In Ghana, Growth and Poverty Reduction Strategies allowed the government to launch infrastructure projects worth 5 per cent of GDP. In Mali, more than half of the fiscal package, representing 1.5 per cent of GDP, was allocated to finance infrastructure projects. The recovery package in Mali focused on the construction of schools, universities and training centres (.3 per cent of GDP), as well as transport, health centres and irrigation systems (1.2 per cent of GDP).
In Tanzania, spending on infrastructure development represented 2.5 per cent of GDP over two years. In Burkina Faso, support to infrastructure was reported to have increased, although the data on additional costs were not available. In Kenya support to infrastructure amounted to 1.71 per cent of GDP in 2009.
During the first semester of 2009, Benin initiated a recovery package mainly centred on public investments but later faced financial constraints due to the reduction of tax receipts.
Support to banks was reported in Nigeria.
/ 6 % ' '
3* 59 7 4:6
: " % " .
"
! * < . ? * "
8 7 "
# ? <
) F> % 7 G ;
7 * % ; 8 . 8 B %
#
! " , * . " *
!)!
A * 7 . % " . ; "" * . "
) * + ,C/D- , ? 7 " * *
In Egypt, there was a national action plan for youth, representing .4 per cent of GDP, to promote youth employability through training and support to self-employment. There was additional support to youth employment in 2009 and 2010 through micro-entrepreneurship and vocational training in Burkina Faso: 130,000 youth from rural areas should benefit from training in 2010. In Burkina Faso, the share of total budget devoted to the Ministry of Youth and Employment has increased from .70 to 86 per cent of GDP There was additional support to vocational training and entrepreneurship programmes for youth in Nigeria, however, insufficient to address the challenge of youth employment. In Mali as well, the budget for youth employment programmes was increased with a long-term objective of creating 250,000 jobs in SMEs and micro-enterprises. In Kenya, an additional .36 per cent of GDP was allocated to the “Jobs for youth programme” in August 2009 with the target of creating between 200,000 and 300,000 jobs. This should be compared with the 50,000 additional youth reaching the age of 20–24 years in 2009, and also with the estimated 700,000 unemployed youth aged 20-24 in 2008.
Support to enterprises
Malian enterprises for an estimated .9 per cent of GDP. In Tanzania, credit facilities represented 1.2 per cent of GDP in 2009.
Social protection
Burkina Faso also had to implement emergency support to flood affected areas in September 2009, as did Ghana in the same year. There was an increase in low old-age pensions in Egypt.
Other structural changes unrelated to the crisis
15
Conclusions and future perspectives
The intensity of the crisis varied among countries, depending on the structure of their economies and the transmission mechanisms of the crisis (Table 16). There was a decline in the volume of exports in six countries in the sample, including two where exports represented the highest share in GDP: Nigeria and Mozambique. Exports did not decrease in all countries, but their growth was halted, while the production of sub-sectors like manufacturing and textiles did decrease in all countries. Among countries for which data are available, investment decreased in Egypt and Ghana, as a percentage of GDP. The decrease in FDI inflows mostly affected Egypt, Nigeria and Benin. Finally, budget balances deteriorated in seven out of the ten countries. Benin and Egypt suffered from the decrease in remittances, while Egypt and Tanzania experienced a decrease in tourism receipts. According to the typology adopted in Table 16, the countries which suffered most from the crisis include Egypt, Benin and Nigeria. Interestingly, these are also the countries where GDP growth reduced the most between 2008 and 2009 (Table 1). Noticeably, one of these
1 7 ' %'% * %' %% * % %
@ , ? 4, A * ( . . 7 *
H H H H
H
H H
H H H H H
H H
H H H
! " H
! $ % & H H
' H H H
( $ H H H
worst affected countries, namely Egypt is also one where protests, initiated early 2011, including demonstrations and labour strikes led to the fall of the government.6
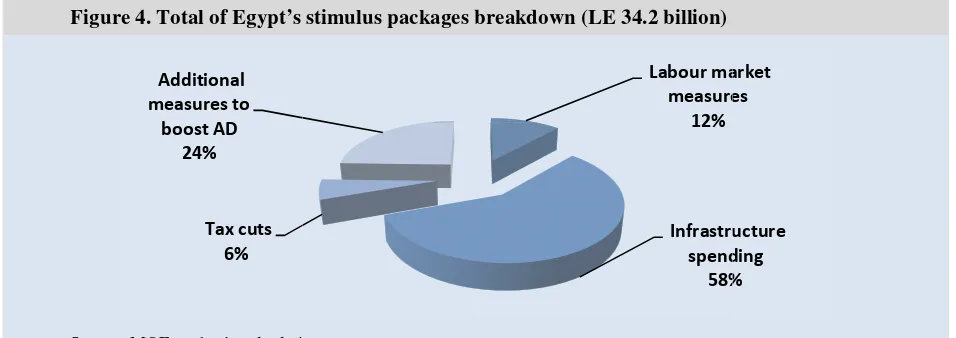
In terms of policy responses, almost all countries implemented a package in 2008 to address the increase in food and energy prices. This package represented 1.5 per cent of GDP in 2008 in Cameroon, and also 1.5 per cent in Egypt. The policy space to address the impact of the 2008 financial crisis was, therefore, reduced in some of these countries when it hit Africa in early 2009. Egypt adopted a 0.7 per cent of GDP package in 2009 and 0.9 of GDP in 2010. In Nigeria, the fiscal stimulus represented .1 per cent of GDP in 2009. In Benin, the fiscal package implemented in the first semester of 2009 represented 2.18 per cent of GDP. In Mali, it represented 2.16 per cent of GDP. In 2009, Tanzania adopted a rescue package worth 5.76 per cent of GDP over two years.
6 The magnitude of the different mechanisms could be examined in view of the composition of
2 7 % % % % %
A * * 9 4:
3 * " , 7 *
9 4:
I " 9 4:
( @ * 7 , *
%" * ;
H #
#
1 # 1
# 111
# #
! " #
! $ % &
' + #
( $ 11 11
1I " ? ? < 0 11 " ? < 0 111 " . * 7 ) : " * 8 ; * " . *
) * + ,C/D- , ? 7 " * *
More resources were also available because of the MDRI and the HIPC initiatives, which released funds previously used for debt payment. In other cases, privatization of public enterprises had released resources. Also, incomes from gold and, from 2009 onwards, from oil, mining and quarrying, supported public expenditure in Mali, Ghana and Nigeria among others. In general, our sample of countries had a better macroeconomic situation than in the past, and was able to adopt a pragmatic approach to the crisis.
Countries have used the additional resources provided by donors’ community, multilateral organizations, and privatization to first adopt new programmes to increase agricultural productivity and incomes, as well as to strengthen food security. Second, infrastructure development and maintenance received additional support, including construction of schools and health care centres. Third, all countries have implemented new programmes and policies to support youth employment and youth employability. Fourth, spending for social protection increased in some countries. Fifth, four countries have revised pay policies in the public sector, mainly increasing public wages, especially for low-wage public servants, but also regularizing precarious contracts and reducing wage discrimination. These initiatives seem to be more related to the food crisis and the need to appease social tensions than to the 2008 financial and economic crisis. In addition, some also recruited new public sector staff. In Nigeria, part of the fiscal package representing .02 per cent of GDP was used to settle parts of wage arrears to workers in public companies and government sector. To that extent, policy responses in Africa included a social dialogue dimension, and the consultation between government, business and labour which took place in the early phase of the crisis (ILO, 2009) materialized in these initiatives. Given the size of the fiscal package, however, no country in the sample adopted a tripartite national pact as a response to the crisis.
17
sector, predated the GFE crisis. As far as the GFE crisis is concerned, and putting aside monetary policies, support to export sector, and to a lesser extent, tourism, was the most frequently adopted measure to respond to the adverse impact on employment and living standards. From the 2009 figures, showing a rebound, it would seem that efforts to support export enterprises and, therefore, also formal employment, were worthwhile.
In the two countries for which there are employment data disaggregated by gender (Egypt and Nigeria), the situation of women deteriorated in the labour market, while that of men improved. There seems to be a kind of inverted added worker effect.
In conclusion, additional policy measures taken in 2008/2009 in ten African countries addressed three “crises”, including: i) the energy and commodity crisis, through food and oil subsidies; ii) structural issues, through support to infrastructure development, and support to agriculture; and iii) the 2008 financial and economic crisis through the combination of support to the export sector, additional funds to youth employment programmes, and – to some extent – increase in public wages. Of course, other measures were taken, such as a modest expansion of targeted social protection programmes, and steps towards long-term reforms (including tax reforms, simplification of administrative procedures for enterprises).
In terms of impact, the renewed emphasis on agriculture and rural development in general is welcome. Turning to youth employment programmes, the additional spending seems insufficient to address the challenge of numerous new entrants into the labour market. The additional spending on youth employment represented on average .4 per cent of GDP in the five countries for which data are available. These programmes could give valuable social protection for vulnerable youth by offering public works and internships, but cannot be expected to create enough jobs, given the employment intensity of growth in Africa for this age group (.75).7
19
References
Barbier, J.-P. and N. Pagès (2011): Les institutions du marché du travail face aux défis du
développement: expériences nationales au Bénin, Burkina Faso, Cameroun et Mali,
International Labour Office, Geneva.
ILO (2009): Protecting people, promoting jobs - A survey of country employment and social
protection policy responses to the global economic crisis. An ILO report to the G20
Leaders’ Summit, Pittsburgh, 24-25 September 2009.
––. (2011): Growth, employment, and decent work in the least developed countries. Report of
the International Labour Office for the fourth Conference on the Least Developed Countries, Istanbul, 9-13 May 2011.
ILO/World Bank (2011): Inventory of policy responses to the 2008 financial and economic
crisis (forthcoming).
IMF: World Economic Outlook database (various years).
––. Regional Economic Outlook: Sub-Saharan Africa (October 2010).
––. Regional Economic Outlook: Middle East and Central Asia (October 2010).
Kapsos, S. (2005): The employment intensity of growth: Trends and macroeconomic
determinants, Employment Strategy Paper No. 2005/12.
Majid, N. (2011): “The global recession of 2008-2009 and developing countries” in I. Islam and S. Verick (eds.): From the Great Recession to Labour Market Recovery: Issues,
Evidence and Policy Options, ILO, Geneva.
UNWTO (2010): World Tourism Barometer, Vol 8, No 2, June 2010.
World Bank (2010): Remittances Data Inflows, online database.
WTO (2010): International Trade Statistics.
Zhang Y., N.Thelen and A. Rao (2010): Social Protection in Fiscal Stimulus Packages: Some
Evidence, A UNDP/ODS Working Paper, Office of Development Studies and United
Nations Development Programme, New York, March 2010.
21
23
Le Burkina Faso face à la crise
1.
Les impacts de la crise sur l’économie et le marché du travail
L’impact de la crise financière et économique internationale (2008-2009) sur l’économie du Burkina Faso est majeur même s’il a été ressenti avec retard. Les équilibres macroéconomiques sont fragilisés (creusement des déficits du compte courant et budgétaire, baisse des recettes d’exportation, baisses des flux de capitaux, contraction de l’investissement privé), tandis que les indicateurs sociaux et d’emploi sont préoccupants.
Des performances macroéconomiques fragiles
La réduction de l’investissement privé mais aussi public ont des effets négatifs sur la croissance et entame sérieusement la capacité du pays à atteindre les OMD et les objectifs de réduction de la pauvreté. La crise a entamé les acquis de la dernière décennie en termes de croissance et de réduction de la pauvreté.
Tableau 1. Evolution des agrégats macroéconomiques (projections après la crise)
* :, J " 596 ) ". 59:, 6
5 6 5 6 5 6 5 6
8 8 8 8 < 8 < 8 < 8 < #8
37 & 8 8 8 8 8 < 8 8#
(e) estimations et (p) projections, Source : BAfD/OCDE 2010 et FMI 2010.
L‘ampleur de l’impact de la crise dépend du degré de vulnérabilité économique et de résilience face aux chocs. Le Burkina Faso est parvenu à réduire les impacts de la crise grâce à l’augmentation de la production aurifère sur la base de partenariats publics-privés, à une politique agricole volontariste et à des investissements publics. Le pays est principalement exportateur de produits miniers et agricoles. Il a été affecté par la crise en raison de la baisse de la demande mondiale et des cours internationaux (notamment le coton), de la baisse des IDE et de l’aide au développement, avec un impact direct sur les recettes publiques. Néanmoins, il a maintenu une relative performance macroéconomique bien que contrastée, suite aux effets successifs des crises alimentaire, énergétique puis financière et à la baisse de la demande du coton sur le marché international.
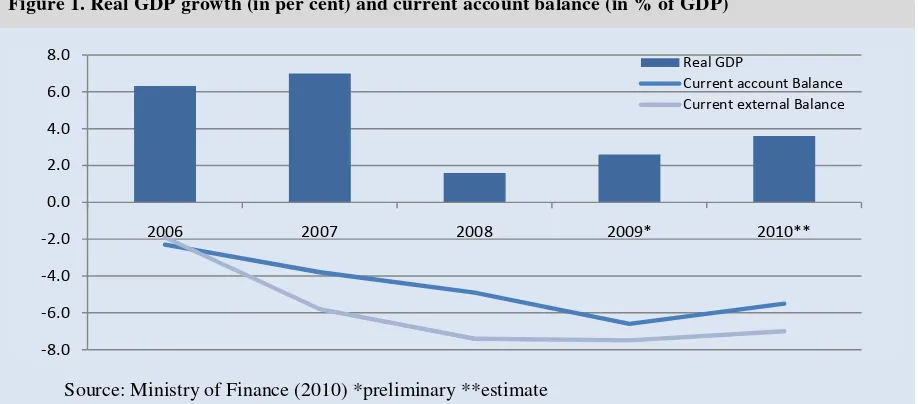
• Après une décélération entre 2006 et 2007 - de 5,5% à 3,6%-, la croissance du PIB réel atteint 5,2% en 2008 grâce à la hausse de la production agricole et des investissements dans le secteur minier. La croissance diminue en 2009 en passant à 3,1% avec le ralentissement de l’économie mondiale, la crise ayant affecté les activités cotonnières et celles du secteur tertiaire. La reprise économique est projetée à 4,2% en 2010 et à 5,3% en 2011.
• La baisse des investissements directs étrangers et des entrées d’investissements de portefeuille est notable et le ralentissement de la demande affecte la qualité des portefeuilles de crédits des banques. La crise entraîne une baisse des taux d’investissement de 19,5% du PIB en 2007 à 18,1% en 2008 et 2009, mais ils doivent remonter à 19,5% en 2010.
• La reprise économique serait essentiellement tirée par l’industrie extractive tandis que les services, incluant le commerce, les transports et télécommunications, constitueraient le second pilier de la croissance. L’agriculture continuerait à jouer un rôle majeur dans la croissance, grâce aux mesures du Gouvernement (semences améliorées, équipement, contre-saison, restructuration de la filière coton, contrôle des prix des produits alimentaires).
• Les termes de l’échange se sont dégradés entre 2006 et 2008 en raison de la nature des produits de leurs exportations. Entre 2008 et 2009, les termes de l’échange se sont améliorés de 12,5% (amélioration des prix du coton et des produits miniers). La baisse relative des exportations entraîne une baisse des revenus des producteurs et travailleurs des secteurs d’exportation, entraînant un ralentissement de la demande de consommation mais aussi de l’épargne intérieure.
Tableau 2. Exportations et termes de l’échange du Burkina Faso (2007-09)
( " . @ 59 :, 6
( . "KJ* 5 . * 8 # L 6
1 1 1 1
8# 8 8 8 8# 8 8 8
* Prévisions. Source : FMI, 2009
• La structure des exportations s’est modifiée en raison de la crise internationale et des évolutions respectives des cours du coton et de l’or. La part du coton dans les exportations passe de 60% en 2005 à 29% en 2009. L’or devient le premier produit d’exportation avec une contribution de 41% en 2009 contre moins de 4% en 2005 (avec 12 tonnes en 2009 contre 5,5 tonnes en 2008).
• Le déficit du compte courant extérieur (y compris les transferts) atteint 8% du PIB en 2009, contre 12% en 2008 et 8,3% en 2007, alors que les prévisions étaient plus pessimistes, et ce, grâce à une production aurifère meilleure que prévue. En 2010, la position extérieure du pays s'est redressée grâce aux bons résultats à l'exportation et à l'amélioration des termes de l'échange, suite à la baisse des cours mondiaux des produits alimentaires et énergétiques. Mais cette position favorable reste fragile car les importations restent dominées par les produits énergétiques.
• Le solde global de la balance des paiements est passé d’un surplus de 5,8% du PIB en 2007 à un déficit de 1% en 2008 et doit se rapprocher de l’équilibre en 2009.
• Les chocs exogènes qui ont affecté le Burkina Faso ont exercé une forte pression sur le budget de l’État. Avec une politique budgétaire expansionniste, le déficit budgétaire global (hors dons) est estimé à 13,8% du PIB en 2009, contre 8,4% en 2008. En 2010, la situation globale des finances publiques s’améliore avec un déficit budgétaire estimé à 11,7% du PIB. Les résultats budgétaires ont été meilleurs que prévu grâce à l'augmentation des recettes, rendue possible par les gains d'efficience réalisés dans l'administration fiscale, et à la diminution des dépenses non prioritaires (FMI, 2010).
• L’endettement reste un défi majeur, représentant 113,9% de la valeur des exportations en 2009 et 20,6% en 2010.
• Les investissements privés ont été limités y compris dans le secteur minier : les nouveaux projets d’investissements dans le secteur minier ont été stoppés en 2009 (sur les six mines qui devaient démarrer leurs activités en 2009, trois sociétés minières ont reporté le démarrage de leurs opérations face aux difficultés de mobilisation de fonds).
• Le crédit à l'économie a nettement ralenti du fait que l'activité économique a manqué de dynamisme et que la conjoncture incertaine a incité les banques commerciales à une plus grande prudence.
La situation sociale et de l’emploi reste préoccupante
25
43,2% en 2009, contre 46,3% en 2004, et ne devrait pas s’améliorer sur les années suivantes, notamment en milieu rural, alors qu’on assiste parallèlement à une urbanisation de la pauvreté. L’atteinte des OMD est remise en cause (objectif de 35% de la population en dessus du seuil de pauvreté en 2015).
• La population est très jeune : 47% des habitants ont moins de 15 ans, tandis que les jeunes de 15 à 24 ans et ceux de 25 à 35 ans représentent respectivement 19,1% et 14,3% de la population. Avec un taux de croissance démographique de 3,1% par an, la croissance de la part des jeunes de 15 à 35 ans est la plus importante sur la dernière décennie (soit 3,7%).
• Le niveau d’employabilité de la population en âge de travailler (15 ans et plus) et son potentiel de productivité, est faible. Le taux d’instruction est de 25,5% avec à peine 1% de la population ayant un niveau supérieur et 17,8% qui ont un niveau primaire. Le taux d’instruction de la population en âge de travailler est de 23,2%, avec un écart encore plus important selon le sexe (17,2% des femmes en âge de travailler sont instruites contre 30,1% pour les hommes). L’offre de travail reste jeune, peu instruite et de plus en plus féminine.
• Le secteur primaire (agriculture, produits miniers) concentre près de 85% des emplois et le secteur informel concentre 96% des emplois. Le taux de sous-emploi global atteint 53% et le taux des travailleurs pauvres est proche de l’incidence de pauvreté.
• Les questions d’emploi sont restées non résolues en raison au cours des deux dernières décennies en raison de la nature de la croissance économique : peu porteuse d’emplois productifs et n’agissant pas sur le niveau de pauvreté de façon significative. Le récent ralentissement économique a notamment touché le BTP et le secteur coton et fibre-textile. Il s’est traduit par une dégradation des conditions de travail et une hausse des taux de chômage, de sous-emploi et des taux de travailleurs pauvres et vulnérables (BIT, 2009).
2.
Des réponses nationales tournées vers la promotion de l’entrepreneuriat et des
jeunes et le renforcement de l’employabilité de la main d’œuvre
Dans le cadre de la Loi de Finances rectificative 2009 et de la loi de Finance 2010, les autorités ont adopté un certain nombre de mesures pour soutenir la demande interne, renforcer les filets de protection sociale, répondre aux besoins humanitaires d’urgence (inondations de septembre 2009), lancer des politiques de grands travaux, appuyer les exportations et la diversification productive. En 2010, le Gouvernement a favorisé une politique budgétaire déficitaire sur fonds de réduction des recettes propres, face à l’ampleur des effets de la crise et des inondations (1 152 milliards Fcfa de dépenses contre 890,7 milliards de recettes). En parallèle, le Gouvernement a décidé de réformer de fond en comble sa politique fiscale en élargissant la base d’imposition pour pour mieux mobiliser les ressources intérieures.
Dans le cadre de la nouvelle Stratégie de Croissance Accélérée (2011-2015), les Gouvernement fait de l’emploi un objectif prioritaire, à travers notamment des appuis renforcés dans le secteur de l’agriculture et de l’agro-industrie, les infrastructures et la formation professionnelle. Dans le cadre des négociations budgétaires 2010 et du budget-programme 2011-13, le Ministère de la Jeunesse et de l’Emploi (MJE) compte désormais parmi les sept ministères prioritaires.
Tableau 3. Part des dépenses pour l’emploi dans les dépenses totales de l’Etat sur ressources propres (milliards Fcfa)
. / 1 2
4 " > 8 8 8# 8 8 8 8
9 . 8 9 8 9 8 9 8 9 8 9 8 #9 8 9
Source :MEF/Loi de Finances initiale.
Face aux impacts de la crise internationale sur l’emploi, des enveloppes exceptionnelles ont été accordées par le Ministère des Finances au MJE, pour les exercices budgétaires 2009 et 2010: 520 millions ont été accordés en 2009 afin de renforcer les fonds d’appui et 700 millions en 2010 dans le cadre du projet de lutte contre le chômage des jeunes des communes urbaines à statut particulier.
• Le renforcement des fonds d’appui en 2009 (FASI, FAPE, FAIJE, FAFPA) doit permettre d’accroître le nombre d’emplois par le financement de microprojets et le nombre de jeunes bénéficiaires de formation aux métiers. Le nombre d’emplois créés est estimé à environ 1 700 emplois par an.
• Le projet de lutte contre le chômage des jeunes, répond au problème du chômage et du sous-emploi des jeunes dans les deux grandes villes du pays - Ouagadougou et Bobo-Dioulasso. Ce projet vise la création directe d’emplois par le financement des microprojets, la formation aux métiers et l’appui à l’installation des jeunes formés, le renforcement des capacités des artisans et des entreprises avec un appui financier en vue de générer des emplois. Ce projet permettra de financer la formation de 3 735 jeunes aux métiers et la création de 6 765 microprojets, soit 6 765 emplois directs en consolidant 830 autres emplois (Revue des Dépenses Publiques du MJE, mars 2010).
Le MJE a aussi exprimé des besoins de financements en 2010 pour:
• Etendre le Programme National de Volontariat au Burkina Faso (563,8 millions Fcfa dans le cadre du Budget 2010), pour assurer le recrutement de 1000 volontaires nationaux au profit des institutions partenaires et l’ouverture de deux centres régionaux de volontariat.
• Mettre en œuvre de nouveaux projets de formation : (i) le projet de formation de 130 000 jeunes ruraux et (ii) le projet de création de 225 entreprises agricoles pour la production, la collecte et la transformation de produits agro-alimentaires afin de créer 225 emplois directs et 675 emplois indirects.
• Mettre en œuvre la Politique nationale de l’emploi et de la jeunesse, à travers un financement supplémentaire de 3 milliards Fcfa par an, soit la moitié de l’enveloppe CMDT accordée annuellement (Revue des Dépenses Publiques du MJE, 2010).
3. Perspectives et challenges
Le Gouvernement a adopté une série de mesures pour faire face aux effets sociaux de la crise sur la base d’une politique budgétaire expansionniste. Mais le principal défi du pays est d’assurer les conditions d’une croissance durable porteuse d’emplois productifs et décents. La forte dépendance de l’économie au coton et à l’or rend l’économie fortement vulnérable aux chocs extérieurs, aux aléas climatiques et aux variations des termes de l’échange et le challenge majeur reste la diversification productive de l’économie.
27
notamment être mis en place en faveur des groupes vulnérables et des nouveaux entrants sur le marché du travail, mais aussi en faveur des salariés licenciés et des travailleurs indépendants du secteur informel. Ces dispositifs doivent privilégier l’amélioration des opportunités d’emploi et d’auto-emploi et le renforcement de l’employabilité des actifs vulnérables. Ces politiques actives devront accompagner la politique économique du pays qui doit désormais s’attaquer aux problèmes structurels (existant avant même la crise mondiale), notamment aux contraintes financières et à celles posées par les accords commerciaux internationaux.
Sources
Banque africaine de développement (BAD), 2010 : www.afdb.org/en/countries/west-africa/burkina-faso.
BAD/OCDE, 2010 : Perspectives économiques en Afrique 2010.
Brixiova Z., A. Kamara et L. Ndikumana, 2010 : La relance en Afrique. Quand et comment sortir des politiques d’intervention contre la crise, BAD.
Barbier J.P. et N. Pagès, 2010 : Les institutions du marché du travail face aux défis du développement. Etude comparée d’expériences nationales en Afrique Sub-saharienne (Bénin, Burkina Faso, Cameroun, Mali), BIT.
BIT, 2009 : Tendances mondiales de l’emploi, mai, Genève.
Cazes S., S. Verick, C. Heuer, 2009: Labour market policies in times of crisis, Employment Working Paper
N°35, BIT, Genève.
FMI, 2009 et 2010 : www.imf.org/external/country/bfa/index.htm
Ministère de l’Economie et des Finances du Burkina Faso : www.finances.gov.bf
Ministère de la Jeunesse et de l’Emploi, 2010 : La revue des dépenses publiques du MJE 2006-2009, mars,
Ouagadougou.
Ministère de la Jeunesse et de l’Emploi, 2010 : Tendance de l’emploi et de la pauvreté au Burkina Faso,
29
Le Bénin face à la crise
1. Les impacts de la crise sur l’économie et le marché du travail
L’impact de la crise financière et économique internationale sur l’économie du Bénin est important, même s’il a été ressenti avec retard comme pour l’ensemble des pays d’Afrique subsaharienne. Les effets de la crise se sont propagés par le ralentissement de la demande mondiale, la baisse des investissements directs étrangers et des envois de fonds des travailleurs émigrés, ainsi que l’accentuation des problèmes de financement des PME due à la rareté des crédits internationaux. Les équilibres macroéconomiques sont fragilisés, tandis que les indicateurs sociaux et d’emploi sont préoccupants.
Des indicateurs macroéconomiques en baisse
Etant dépendant des échanges commerciaux avec le Nigéria et de l’exportation de produits agricoles, le Bénin a été affecté par la crise en raison de la baisse de la demande sous-régionale et mondiale, de la baisse des recettes douanières et d’une aggravation des déficits commerciaux et budgétaires. L‘ampleur de l’impact de la crise est à la mesure du degré de vulnérabilité économique du pays (dépendance par rapport au coton, au commerce transfrontalier et aux services).
Tableau 1. Evolution des agrégats macroéconomiques (projections après la crise)
* :, J " 596 ) ". 59:, 6
5 6 5 6 5 6 5 6
J 8 8 8 8 < 8 < 8 < 8 < 8#
37 & 8 8 8 8 8 < 8 8#
(e) estimations et (p) projections, Source : BAfD/OCDE 2010 et FMI 2010.
• La crise a réduit de moitié la croissance du PIB réel, qui est passé de 5% en 2008 à 2,7% en 2009. En 2010, la croissance est estimée à 3,2%. Le Bénin parvient à maintenir son niveau de croissance économique autour de 3%, grâce à la hausse de la production agricole, des services et du BTP (programme d’infrastructures publiques notamment). La baisse de la croissance économique s’explique par le contexte de récession internationale, par la baisse de la production du coton et du commerce avec les pays voisins.
• Le taux d’inflation a décliné pour atteindre 2,2% en 2009 alors qu’il était à 7,9% en 2008, suite à la baisse des prix alimentaires et pétroliers (soit en dessous de la norme communautaire de 3%).
• Les secteurs primaire et tertiaire sont la première source de croissance, en contribuant à 40% et 45% du PIB respectivement. La croissance du secteur primaire est fortement dépendante du coton, celle du secteur tertiaire est déterminée par les relations avec le Nigeria, par les activités du Port Autonome de Cotonou et par l’essor des services. Le secteur secondaire représente la portion congrue de l’économie béninoise (avec un secteur manufacturier contribuant à 8% du PIB). Le secteur manufacturier et les services ont été les plus touchés par la crise.
• La baisse des investissements directs étrangers et des entrées d’investissements de portefeuille est constatée. Le ralentissement de la demande affecte la qualité des portefeuilles de crédits des banques, induisant un ralentissement des crédits à l’économie, que les PME subissent le plus en raison de la forte pression exercée par les grandes entreprises sur le marché bancaire local. La crise internationale entraîne une baisse des taux d’investissement de 21,4% du PIB en 2007 à 20,7% en 2008 mais ils remontent dès 2009, à 24,5% en 2009 et 24,8% en 2010.
• Le déficit budgétaire se creuse en raison de la baisse de l’activité commerciale alors que les dépenses d’investissement financées sur ressources intérieures ont doublé, et que la masse salariale de la fonction publique a augmenté de 24% en 2009 par rapport à 2008. La politique budgétaire expansionniste s’est traduite par des dépenses publiques atteignant 26% du PIB en 2009 et 2010. Le déficit budgétaire global (hors dons) a plus que doublé en passant à 7,3% du PIB, et a été financé par des concours budgétaires supplémentaires de la communauté internationale et l’emprunt intérieur.
• Les termes de l’échange se sont dégradés entre 2006 et 2008 en raison de la nature des produits de leurs exportations (Tableau 2). Entre 2008 et 2009, les termes de l’échange se sont faiblement améliorés de +0,9%. La baisse relative des exportations entraîne une baisse des revenus des producteurs et travailleurs des secteurs d’exportation, qui est accentuée par la diminution des envois de fonds des travailleurs émigrés (notamment envers les producteurs ruraux), entraînant un ralentissement de la demande de consommation mais aussi de l’épargne intérieure.
Tableau 2. Exportations et termes de l’échange - Bénin (2007-09) ( " . @
59 :, 6
( . "KJ* 5 . * 8 # L 6
1 1 1 1
J #8 8 8# 8 # 8 #8 #8 8
* Prévisions. Source : FMI, 2009
• Le déficit du compte courant passe à -8,3% PIB en 2008 contre -7,6% en 2007 puis à -10% en 2009 et -9,5% en 2010, car les exportations de coton ont sensiblement diminué et les transferts de fonds des travailleurs établis à l’étranger ont reculé.
Une situation sociale et d’emploi qui s’aggrave
La crise internationale agit négativement sur la situation sociale et remet en cause les résultats atteints au cours de la dernière décennie. Le Bénin est classé 161ème sur 182 pays pour l’IDH en 2009.
• La proportion de la population située en dessous du seuil de pauvreté se situe à 37,4%. En 2009, l'incidence de la pauvreté augmente d’un point de pourcentage.
• Le niveau de développement social est faible au regard des indicateurs sociaux de base (espérance de vie, taux de mortalité infantile, taux d’alphabétisation). L'atteinte des OMD en 2015 est compromise, suite aux impacts de la crise conjugués aux contreperformances internes (faible diversification des sources de la croissance et faibles investissements dans le capital humain).
• Le niveau d’employabilité de la population en âge de travailler (15 ans et plus) et son potentiel de productivité, est faible au regard du taux d’analphabétisme (58%). La population active est jeune : plus de 60% des actifs sont âgés de moins de 35 ans et les enfants de 10 à 14 ans représentent 8,7% des actifs. Par ailleurs, 63,4% des femmes âgées de moins de 35 ans sont actives. Le niveau d’instruction des actifs occupés est globalement faible : le nombre moyen d’années d’études réussies est de 6,4 ans pour l’ensemble des actifs occupés.
31
2.
Les réponses nationales face à la crise
Au cours du premier semestre 2009, les autorités nationales ont cherché à mettre en place un important plan de relance budgétaire, à travers notamment les investissements publics, mais elles ont dû ensuite resserrer leurs politiques en raison de contraintes financières, dans un contexte de diminution des recettes douanières (baisse des échanges commerciaux avec le Nigeria). Le coût des mesures d'accompagnement prises par le Gouvernement pour contrer les effets de la crise, s'établit à 68 milliards de Fcfa.
Les recettes totales de l’Etat ont baissé d’environ 48 milliards de FCFA en 2009 et 86 milliards de FCFA en 2010. Du fait des effets de la crise financière sur l’économie nigériane, le commerce de réexportation a connu une contraction et a réduit les recettes douanières. En outre, les recettes des impôts ont diminué face à la contraction de l’activité économique intérieure, en particulier dans les services.
Des mesures d’urgence ont été adoptées par le Gouvernement avec l’appui des partenaires au développement afin de :
• donner libre cours aux stabilisateurs budgétaires automatiques pour faire face aux baisses des recettes fiscales en maintenant la politique fiscale en cours, le niveau des dépenses publiques et en opérant des augmentations discrétionnaires pour les dépenses sociales ;
• augmenter les engagements du FMI et des autres partenaires pour financer le déficit budgétaire et rechercher des dons et prêts concessionnels pour financer les dépenses publiques ;
• renforcer le suivi de l’économie et la coordination de la politique économique ;
• encourager la BCEAO à poursuivre le renforcement de la liquidité des banques commerciales, en faisant preuve d’une souplesse accrue et en révisant à la baisse les taux directeurs et les coefficients de réserves obligataires appliqués aux banques. Ainsi, le taux de pension est passé de 4,75% à 4,25% et le coefficient de réserves obligataires de 15% à 9%.
Des mesures structurelles pour renforcer le cadre macroéconomique ont été proposées, par la Commission nationale chargée de proposer des mesures de politique économique. Ces mesures visent à relancer l’offre de la production intérieure ainsi que la demande intérieure et à soutenir les finances publiques, à travers :
• la relance de l'activité agricole autour des filières porteuses et des activités de commerce (réaménagement du dispositif fiscal et douanier et dégel des importants stocks de marchandises),
• des appuis financiers auprès des entreprises du secteur privé et des garanties auprès des banques, via l'accélération du paiement des créances des entreprises privées sur l'Etat et la mise en place du guichet unique pour les opérations portuaires et douanières.
3.
Perspectives et challenges
Entre 2011 et 2015, la croissance du PIB réel devrait avoisiner 5,6% en moyenne par an (projections du FMI, 2010), avec la reprise de l’économie mondiale et régionale. Au-delà des mesures d’urgence prises par le Gouvernement, des mesures à moyen terme doivent être adoptées pour réduire la vulnérabilité économique et financière du pays. La Commission nationale de suivi de la crise met en avant la nécessité d’améliorer la compétitivité de l'économie béninoise, notamment la compétitivité du port de Cotonou et de l'ensemble du corridor du transit du Bénin (réforme au sein du secteur portuaire, efficacité du service douanier, lutte contre la corruption…), l’amélioration de la productivité des facteurs (énergie, télécommunications…), l’organisation du secteur agricole et la promotion de zones franches industrielles.
La revue annuelle de la SCRP 2007-2009 souligne que des défis majeurs subsistent et méritent davantage d’efforts pour atteindre l’ensemble des objectifs visés. Il s’agit, entre autres, de : l’amélioration du climat des affaires, la diversification de l’économie, l’amélioration de l’entretien routier et l’aménagement des pistes rurales, la fourniture de l’énergie, l’efficacité interne du système éducatif, l’amélioration de la gouvernance dans le secteur sanitaire, l’amélioration de la qualité des dépenses publiques en particulier dans les secteurs prioritaires.
A moyen terme, les effets sur l’emploi ne seront pas estompés. Le sous-emploi et la proportion des travailleurs vulnérables et pauvres risquent d’augmenter si des mesures appropriées ne sont pas envisagées. Les politiques actives de l’emploi ont un rôle essentiel à jouer en temps de crise. Des dispositifs doivent notamment être mis en place en faveur des groupes vulnérables et des nouveaux entrants sur le marché du travail, mais aussi en faveur des salariés licenciés et des travailleurs indépendants du secteur informel. Ces dispositifs doivent privilégier l’amélioration des opportunités d’emploi et d’auto-emploi et le renforcement de l’employabilité des actifs vulnérables. La mise en place de ces mesures d’accompagnement nécessite que des accords internationaux soient trouvés pour lever les contraintes financières et commerciales qui pèsent sur le pays.
Sources
BAD, 2010 : www.afdb.org/en/countries/west-africa/benin.
BAD/OCDE, 2010 : Perspectives économiques en Afrique 2010.
Banque Mondiale, 2010: Indicateurs du Développement dans le Monde, Washington DC.
Barbier J.P. et N. Pagès, 2010 : Les institutions du marché du travail face aux défis du développement. Etude comparée d’expériences nationales en Afrique Sub-saharienne au Bénin, Burkina Faso, Cameroun, Mali, BIT, Genève.
BIT, 2009: Tendances mondiales de l’emploi, Genève.
Cazes S., Sh. Verick, C. Heuer, 2009 : Labour market policies in times of crisis, Employment Working Paper
N°35, BIT, Genèv