MODELLING VAGUE KNOWLEDGE FOR DECISION SUPPORT IN PLANNING
ARCHAEOLOGICAL PROSPECTIONS
S. Boos a, S. Hornung b, H. Müller a, *
a
Mainz University of Applied Sciences, Institute for Spatial Information and Surveying Technology (i3mainz), Lucy-Hillebrand-Str. 2, D-55128 Mainz, Germany - (boos, mueller)@geoinform.fh-mainz.de
b Mainz University, Institute for Pre- and Protohistory, Schillerstr. 11, D-55116 Mainz, Germany - [email protected]
Commission II, WG II/7: Spatial Decision Support and Location-Based Services
KEY WORDS: archaeology, GIS, prediction, modelling, visualization, parameters, decision support, landscape, spatial
ABSTRACT:
Most archaeological predictive models lack significance because fuzziness of data and uncertainty in knowledge about human behaviour and natural processes are hardly ever considered. One possibility to cope with such uncertainties is utilization of probability based approaches like Bayes Theorem or Dempster-Shafer-Theory. We analyzed an area of 50 km² in Rhineland Palatinate (Germany) near a Celtic oppidum by use of Dempster-Shafer’s theory of evidence for predicting spatial probability distribution of archaeological sites. This technique incorporates uncertainty by assigning various weights of evidence to defined variables, in that way estimating the probability for supporting a specific hypothesis (in our case the hypothesis presence or absence of a site). Selection of variables for our model relied both on assumptions about settlement patterns and on statistically tested relationships between known archaeological sites and environmental factors. The modelling process was conducted in a Geographic Information System (GIS) by generating raster-based likelihood surfaces. The corresponding likelihood surfaces were aggregated to a final weight of evidence surface, which resulted in a likelihood value for every single cell of being a site or a non-site. Finally the result was tested against a database of known archaeological sites for evaluating the gain of the model. For the purpose of enhancing the gain of our model and sharpening our criteria we used a two-step approach to improve the modelling of former settlement strategies in our study area. Applying the developed model finally yielded a 100 percent success rate of known archaeological sites located in predicted high potential areas.
KURZFASSUNG:
Den meisten archäologischen Vorhersagemodellen wohnt inne, dass sie Unsicherheiten über das Wissen menschlicher Verhaltensweisen und natürlicher Prozesse nur unzureichend berücksichtigen. Wahrscheinlichkeitsbasierte Ansätze wie das Bayes Theorem oder die Theorie von Dempster-Shafer bieten die Möglichkeit mit diesen Unsicherheiten umzugehen. In einem gewählten Untersuchungsraum von 50 km² nahe eines in Rheinland-Pfalz (Deutschland) gelegenen keltischen Oppidums wurde unter Anwendung der Dempster-Shafer-Theorie eine Modellierung der räumlichen Verteilung potentieller archäologischer Siedlungsfundstellen durchgeführt. Die Wahl dieser Methode zeichnet sich dadurch aus, dass sie den Grad des Vertrauens in definierte Variablen für die Unterstützung bestimmter Hypothesen (in unserem Fall die Hypothesen: Fundstellenanwesenheit und Fundstellenabwesenheit) berücksichtigen lässt. Die Eingangsgrößen unseres Modells beruhen sowohl auf Annahmen über Besiedlungsstrategien, als auch auf statistisch erhobenen Beziehungen zwischen bekannten archäologischen Fundstellen und definierten Umweltfaktoren. Die Modellierung wurde in einem Geographischen Informationssystem (GIS) durchgeführt, mit dessen Hilfe rasterbasierte Wahrscheinlichkeitskarten für die einzelnen Einflussfaktoren generiert wurden. Final wurden im GIS die einzelnen Karten zu einer Gesamtkarte aggregiert, deren Zellwerte ein Wahrscheinlichkeitsmaß für das Besiedlungspotential wiedergeben. Zur Modellvalidierung wurde das Ergebnis schließlich mit einer Datenbank bekannter Fundstellen in Beziehung gesetzt und in der Folge weiter verbessert. Die Anwendung des Modells lieferte eine Übereinstimmung von 100 Prozent der bekannten Fundstellen im Untersuchungsgebiet mit der Vorhersage hohen archäologischen Potentials.
* Corresponding author
1. INTRODUCTION
Landscape archaeology deals with the reconstruction of past human behaviour by considering the way in which people constructed and used the environment around them. In particular for protohistoric times, for which no written sources exist, our knowledge on landscape and environmental changes mainly relies on an analysis of archaeological records and findings. Besides different prospection techniques like field surveys, geophysical methods or remote sensing techniques Geographic Information Systems (GIS) can play an important
role in analysing known sites and also in identifying evidence for previously unknown sites.
It is often possible to multiply the number of known sites by focused archaeological prospection. GIS-based modelling of site occurrence probabilities, commonly known as predictive modelling, can be an important means to improve the archaeological record by focusing surveys on areas with a high probability of meeting with traces of human settlement. In this context two fundamental approaches for assignment of site probabilities can be differentiated, one of which bases on
deductive reasoning, the other one on inductive reasoning. No matter which approach is being selected, archaeological predictive models usually lack consideration of data fuzziness and uncertainty of comprehensive knowledge about human behaviour and natural processes (Canning, 2005). One way to cope with such uncertainties is utilization of probability theory based methods like Bayes Theorem or Dempster-Shafer-Theory (Dempster, 1968, Shafer, 1976). These techniques incorporate uncertainty by combining various weights of evidence for defined variables, and in that way enable us to estimate the probability for supporting specific hypotheses (in our case the hypotheses presence or absence of a site). In the field of Cultural Heritage Management (CHM) these approaches considering vagueness of data are very well suited, because it becomes evident that the models are based on several untested hypotheses and it will hardly be possible to identify all factors influencing human choice of settlement sites.
2. PREDICTIVE MODELLING
2.1 Methodology
Archaeological Predictive Modelling is a methodology, which was developed in the late 1970ies in the USA in context with governmental land management projects (Clarke, 1977). This technique bases upon the assumption, that the choice of settlement formation and burial grounds of former societies is closely associated with natural factors and the influence of socio-cultural aspects. The objective of Predictive Modelling bases on this hypothesis by considering the influence of such factors and enables in that way assigning areas a specified probability for locating archaeological remains. Predictive Modelling can be conducted by use of certain methods, in a wide range of complexity from simple additive methods up to multivariate regression analysis (Deeben et. al., 2002). Presently methods of Fuzzy Logic (Bailey et. al., 2009) or probabilistic approaches (Canning, 2005, Ducke et. al., 2009) are increasingly used in the field of archaeological predictive modelling. They allow for incorporating uncertainty or fuzzy knowledge about human behaviour in the model. For modelling historic settlement processes considered in this study the algorithm of Dempster-Shafer is used.
2.2 Dempster-Shafer’s Theory of Uncertainty
The Dempster–Shafer theory (Dempster, 1968, Shafer, 1976) is a mathematical theory, which uses evidences instead of probabilities for modelling uncertainty. The quintessence of Dempster-Shafer’s theory can be summarized in a way, that each domain of knowledge implies uncertainty and that the complement of a hypothesis must not automatically be assigned to its negation, but has to be allocated to the factor uncertainty. An aggregation rule is used to include numerous pieces of information (evidence) with varying weight into a decision making process thus supporting or excluding defined hypothesis. A model based on Dempster-Shafer’s theory can be expressed mathematically in the following way:
• The model is composed of a set of hypothesis H = h1…n, which comprises all possible and mutual excluding outcomes and all of their combinations. This set is called Frame of Discernment (Ω).
• The theory of evidence assigns a belief mass m(A) (also called Basic Probability Assignment -> BPA) to each
element of a set of interest A, which is a given member of the Frame of Discernment, and expresses the proportion of all relevant and available evidence that supports the claimthat the actual state belongs to A but to no particular subset of A. The BPA fulfils the following two conditions:
( )
Ø
=
0
spaces, which are consistent with a specific hypothesis:∑
The difference between belief and plausibility is another important quantity of the Dempster-Shafer formalism and is referred to as belief interval. It represents in this way the range of maximum uncertainty.
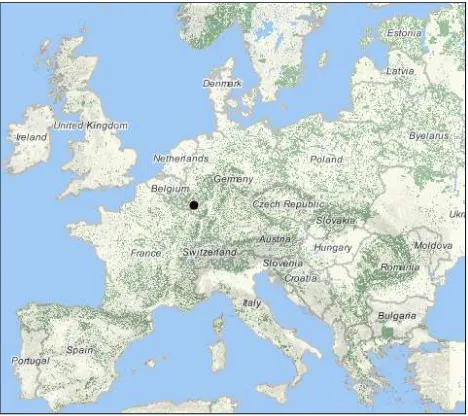
By use of Dempster’s Rule of aggregation the single belief sets X and Y can be combined pairwise and in that way it is possible (Figure 1) in the low mountain range “Hunsrueck”, is examined regarding its outstanding prominence in Celtic times. Besides the monumental construction of the oppidum, which is nowadays still reflected in its northern wall, preserved up to a height of 10 m, various sources indicate that the region used to be a centre of supra-regional importance in Celtic times (Wiegert, 2002). Several campaigns of archaeological and geophysical prospection in the region helped to extend our knowledge on archaeological sites in the region. Due to a wide range of important monuments and sites from both Celtic and Roman times, the area around the Hunnenring has long played a prominent part in outlining models of social and economic development.
Figure 1. Location of the study area (Source : www.osm-wms.de)
For our study an area of about 50 km² size (Figure 2), situated 4 km northwest of the Hunnenring, serves as test area for applying the model. The area is characterized by a relatively high number of predominantly Roman settlement finds and a multiplicity of graves dating to Roman and Celtic times.
Figure 2. Distribution of finds in the study area
4. DEVELOPMENT OF THE MODEL
4.1 Modelling Assumptions and Input Parameters
Modelling settlement strategies of Roman and Celtic people concentrates on typical forms of open settlements like small farms or villages (Hornung, 2008). Fortified settlements cannot be considered because we are still lacking knowledge on their precise function. For the same reasons their existence cannot be predicted with certainty. Due to the natural characteristics of the low mountain range position of our study area it can be assumed, that motivation for a choice of site hardly differed between Celtic and Roman times. For this reason and due to
the limited number of known Celtic sites a diachrone approach seemed reasonable. Easily recognisable stone-built Roman settlements also offer a possibility to test the results of our predictive modelling for the Celtic period. Data processing and modelling using the concept of Dempster-Shafer was conducted in a GIS. For building the model the data basis was composed of a historic map (used for reconstruction of the historical road network), a Geological Map and a Digital Elevation Model (DEM) with a resolution of 50 cm, both latter ones available for the whole State, provided by state agencies. These data sources served for derivation of a significant part of the model parameters. Official documents on archaeological finds from the region and several publications helped assemble a database, comprising all known finds. The elements of the database were consulted for parameterisation of the degrees of belief according to equation (3) and served as input parameters for the final evaluation of the model.
4.2 Modelling
In compliance with the theory of Dempster-Shafer the Frame of Discernment of the predictive model has to test the hypothesis {Presence of site} and {Absence of site} as well as the hypothesis {Presence of site, Absence of site}, which expresses uncertainty about presence or absence of a site. Figure 3 shows the Frame of Discernment comprising these hypothesis and all variables, which were used in the model and which support one of the hypothesis.
Figure 3. Frame of Discernment with the single hypothesis and their supporting variables
Quantification of the single variables was carried out on the basis of a statistical analysis of known sites in the study area but also incorporated estimations by archaeological experts and their knowledge on settlement strategies in Celtic and Roman times. In the following section the single variables, which serve as input parameters for equation (5) and their influence on the model are described.
4.2.1 Variables, which support the hypothesis {Presence of site}
• Slope
Soils in our study area are characterized by nutrient poorness and stagnant moisture. Thus it can be assumed that slightly sloped areas should have been preferred for settlement activities, whereas flat locations and also distinct slopes would have been avoided by settlements. Statistical analysis of the known sites confirms this estimation, because 80 % of the sites are located in a slope
range between 2 – 4°, 15 % in a range of 4 – 6° and only 5 % on flat or steep slopes.
• Landform
Slope as single criterion for characterization of the landscape does not reveal much about the actual topography. In this context a classification of the landscape in characteristic landforms appears reasonable. For this purpose a raster based algorithm for identifying slope positions and characterization of the landscape was used (Weiss, 2001). The algorithm enables us to classify 10 different types of landform, from which 5 classes can be found in our study area. Analysis of the find distribution in comparison with these classes shows that nearly all settlement finds are located in the two landform classes ‘wide open valleys’ and ‘elevated plains’.
• Distance to rivers
To model this influence for each raster cell the distance (unit: minutes of walking time to the next river) was calculated by use of an Anisotropic Cost-Distance analysis, which incorporates Tobler’s hiking function (Tobler, 1993) for modelling a slope dependant hiking velocity. Belief in the hypothesis {Presence of site} decreases with increasing distance to the river network and is modelled by use of a sigmoidal monotonically decreasing Fuzzy membership function. This function helps to express the degree of membership of elements of a given set (also called Fuzzy set) without using sharp boundaries and is characterized by a fuzzy membership grade that ranges from 0.0 to 1.0, indicating a continuous increase from non-membership to complete membership. The most commonly used membership function is the Sigmoidal ("s-shaped") Membership function, which is produced using a cosine function.
4.2.2 Variables, which support the hypothesis {Absence of site}
• Geology
In conjunction with evaluation of natural resources for agricultural use geologic substrate plays an important role as basic material for pedogenesis. Some substrates indicate poor resources, which are reflected in nutrient poorness or loamy material and which also appear in today’s utilization as predominately forested area. Moreover holocene floodplains should have been avoided as settlement places due to temporary flooding. For these reasons some areas can be identified as unfavourable areas for the formation of settlements thus supporting the hypothesis {Absence of site}.
• Distance to road system
In Celtic as well as in Roman times the formation of settlements and their associated burial grounds is reflected in rule based distances concerning their relative position to the road system. Settlements were usually established at a minimum distance of 100 m to a main road whereas burial grounds are located in the immediate vicinity of the main roads. Due to our restricted knowledge on the exact course of pre- and protohistoric roads a Least Cost Path analysis, which is a common GIS analysis technique, was used for
calculating an ideal road network for our area of study. Connections between known burial grounds were calculated by taking into account that the course of Roman and Celtic roads principally followed the mountain ridges. For reconstruction of the former road network the result was associated with a historical map and a map of the known Roman road network (Haffner, 1976). For calculating the BPA for this variable a buffer of 100 m around the roads was built and assigned a low probability for finding a settlement. Furthermore a sigmoidal monotonically increasing Fuzzy membership function in a range of 100 m – 800 m represents the increasing probability for finding a settlement with cumulative distance to roads. For distances greater than 800 m to the road network again a low probability was assigned.
• Distance to graves
The spatial relation between burial grounds and their surrounding settlements shows consistency for both epochs and is reflected in a minimum distance of 150 m between burial grounds and the nearest settlement. In context with modelling based on Dempster-Shafer’s theory the hypothesis {Absence of site} is supported for a distance < 150 m between burial ground and related settlement. Quantification in terms of belief is expressed with an assignment of a BPA of 0.9 for all raster cells with a distance < 150 m and a BPA of 0.1 for those raster cells which are located farther.
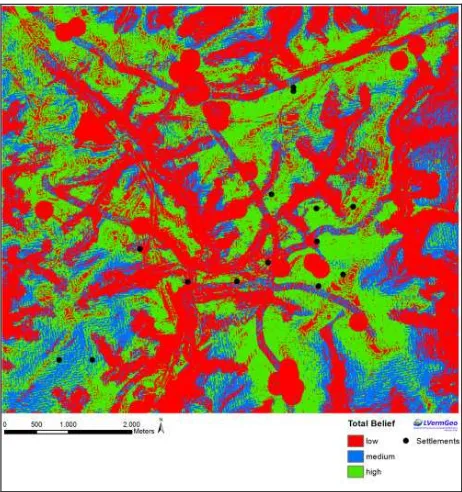
5. RESULTS AND DISCUSSION OF MODELLING Dempster’s Rule of aggregation (5) was used to combine the single BPA’s obtained for the variables ‘slope’, ‘landform’, ‘distance to rivers’, ‘geology’, ‘distance to road system’, ‘distance to graves’ (see Figure 3) to a final result which represents a likelihood value for every single cell of being a site or a non-site. Figure 4 shows the total belief for the hypothesis {Presence of site} in conjunction with all known settlement finds in the study area.
Figure 4. Total Belief of the hypothesis „Presence of site
The result was grouped into three equidistant classes, which in their entirety represent the suitability of a certain location for settlement activity by attaching a gradient value between 0 and 1 to it. The Figure clearly shows line shaped corridors of low belief along the river network and the predicted road course network. Circular shaped areas of low belief can be observed at the existing burial mounds. It can be pointed out, that 14.3 % of the finds are located in areas of low suitability for settlement, 7,1 % are situated in the medium area and 78.6 %, respectively, can be found in areas of high potential for settlement.
A common quantity for assessing the performance of archaeological predictive modelling is Kvamme’s gain statistic (Kvamme, 1988), defined as
gain = 1 – (area (%) / known sites (%)) (6)
Hence a good predictive model should place a maximum amount of sites in a minimum area of high potential (Whitley, 2005) and should be as close to 1 as possible. Likewise sites located in “low” belief areas represent failures of the predictive model and are therefore a direct measurement of the model’s practical reliability (Ducke et al., 2009). The medium area range is an expression of model inconsistencies and for this reason its proportion should be as small as possible. From an archaeological point of view field work in the medium areas should get a particular focus, because an analysis of the landscape in these areas could help to find previously unconsidered model parameters and in that way contribute to improve the model’s performance by adding new evidences. Table 1 shows the performance results for the model. For our site data set site statistics are shown that relate the dataset to the predicted areas of “low”, “medium” and “high” respectively. The column “sites (%)” shows the percentage of sites located in each belief range, whereas the column “area (%)” represents which proportion of the total study area is covered by each of the belief ranges. In the last column gain factors calculated according to equation (6) are given.
Belief Class sites (%) area (%) gain Low belief (‘site’) 14.3 45.2 --- Medium belief (‘site’) 7.1 19.7 --- High belief (‘site’) 78.6 35.1 0.55
Table 1. Performance of the predictive model
The gain factor of 0.55 for sites allocated to areas of high belief may be considered satisfying, but provides potential for improvement of the model. A similar situation can be stated for the degree of model selectivity. The major parts of the total area are allocated to areas of low belief (45.2 %) and to areas of high belief (35.1 %). Still, a reduction of the area proportion in the medium range areas (19.7 %) would be desirable.
5.1 Model improvement
For the purpose of improving our model’s gain we decided to consider ‘wind direction’ as an additional influencing factor on former settlement choices. Posluschny (2002) was able to show for a study area located about 150 km to the east of our study area, that celtic settlements were preferably located in the wind shadow zones of the west, southwest and northwest winds prevailing in the Western and Central European region. In a GIS this factor can be modelled by calculating the slope aspect
of a DEM. Hence for calculating the BPA for the factor ‘wind direction’ we assigned slope exposures of eastern, south-eastern and north-eastern orientation, which means an orientation opposite to the prevailing wind directions, a BPA of 0.8 for the hypothesis {Presence of site} and the remaining slope orientations a BPA of 0.2.
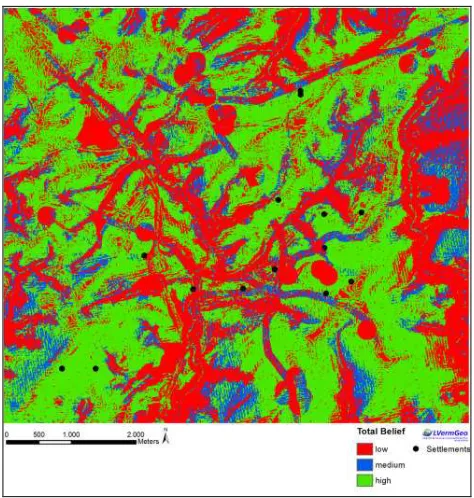
Table 2 shows the performance of our model after incorporation of the factor ‘wind direction’ realized by considering slope aspects in our model. Figure 5 shows the corresponding visual representation of the modelling result.
Belief Class sites (%) area (%) gain Low belief (‘site’) 0 51.5 --- Medium belief (‘site’) 0 17.1 --- High belief (‘site’) 100 31.4 0.69
Table 2. Performance of the predictive model after incorporation of the parameter ’wind direction’
As compared with the results obtained from the original model (see Table 1) the results show a significant improvement. Introducing the factor ‘wind direction’ leads to a reduction of the proportion of areas with high potential while simultaneously increasing the proportion of finds in this area to 100 %. Consequently the gain factor increases to an amount of 0.69. This result, for instance, meets well the project goals of Mn/Model, a large long-term project for the State of Minnesota, USA, which in its final stage aims to develop models with a minimum gain statistic of 0.61 (Gibbon, 1998, Minnesota Department of Transport, 2000). As a further positive impact it can be stated, that the proportion of the medium potential area was slightly reduced from 19.7 % to 17.1 %, which provides a positive contribution to the model assessment.
Figure 5. Total Belief of the hypothesis „Presence of site“ after incorporation of the factor ‘wind direction’
6. OUTLOOK
In this study we confirmed the applicability of Dempster-Shafer theory in the context of archaeological prospection planning. We identified a number of significant variables by which presence or absence of archaeological sites in the investigated study area can be predicted in a reasonably reliable way. Model development took place in several steps. Starting with a number of variables which were obtained from archaeological knowledge the model was improved by incorporating wind direction as an additional factor. In that way the Dempster Shafer approach proved to be successful as a base for the development of flexible tools in the context of archaeological site prediction. One possible application of the model based upon the identified variables is to provide planning and management agencies with valuable information on areas of archaeological sensitivity, for instance.
Further work should concentrate on field work to confirm the results of modelling and, vice versa, should contribute to the refinement of the modelling process by improving the model’s parameterization. Additional support for planning both general or targeted prospection campaigns and improvement of their success rate should be achieved by consideration of the results in context with erosion processes. Further potential for the clarification of our results lies in a more precise reconstruction of the ancient road network and in considering archaeological visibility. From an archaeological point of view erosion causes unearthing of finds and effects in that way the destruction of archaeological remains by weather influences, whereas deposition of soil material contributes to conservation of archaeological remains by covering the remains. Mitas and Mitasova (1998) developed an algorithm, which allows for calculating the spatial distribution of erosion and deposition rates of a specific area. The application of this algorithm could help to exclude specific areas with high erosion- or deposition rates and in that way allow a more differentiated evaluation of the results of the predictive model with regard to targeted archaeological and other prospection.
Acknowledgment
The authors thank the Earth System Research Centre Geocycles, Mainz (Germany) which supported this research.
7. REFERENCES
Bailey, K., Davis, D., Grossardt, T.H., Hixon, J., Mink, P., Ripy, J., Shields, C., 2009. Predictive Archaeological Modeling using GIS-Based Fuzzy Set Estimation: A Case Study in Woddford County, Kentucky, In: Proceedings of the Transportation Research Board 88th Annual Meeting, Washington.
Canning, S., 2005. 'BELIEF' in the past: Dempster Shafer theory, GIS and archaeological predictive modeling. Australian Archaeology 60, pp. 6 - 15.
Clarke, D.L., 1977. Spatial Archaeology, 397 pp. Academic Press Inc, First Edition, London.
Deeben, J.H.C., Halleas, D.P., Maarlevelt, T.J., 2002. Predictive Modeling in archaeological heritage management of the Netherlands: The indicative map of archaeological values (2nd generation). In: Berichten ROB 45, pp. 9 – 56.
Dempster, A. P., 1968. A Generalization of Bayesian Inference, In: Journal of Royal Statistical Society, Series B 38, pp. 205 – 247.
Ducke, B., van Leusen, M., Millard, A.R., 2009. Dealing with uncertainty in archaeological prediction. In: Kamermans, H., van Leusen, P. Verhagen (eds): Archaeological Prediction and Risk Management. Alternatives to current practice , pp. 123 – 160.
Gibbon, G., 1998. Archaeological predictive modelling: An overview. In Mn/Model: A Predictive Model of Pre-contact Archaeological Site Location for the State of Minnesota. St. Paul: Minnesota Department of Transport.
Haffner, A., 1976. Die westliche Hunsrück-Eifel-Kultur, In: Röm.-German. Forsch. 36. In German.
Hornung, S., 2008. Die südöstliche Hunsrück-Eifel-Kultur. Studien zur Späthallstatt- und Frühlatenezeit in der deutschen Mittelgebirgsregion, Universitätsforsch. Prähist. Arch. 153, Bonn. In German.
Kvamme, K.L. 1988: Development and Testing of Quantitative Models, In: J. Judge / L. Sebastian (Hrsg.), Quantifying the Present and Predicting the past: Theory, Method, and Application of Archaeological Predictive Modelling, pp 325-428.
Minnesota Department of Transport, 2000. History of the Mn/Model Project Minnesota Department of Transport, On-Line Report at
http://www.mnmodel.dot.state.mn.us/pages/history.html. (20.12.2011)
Mitas, L., Mitasova, H., 1998. Distributed erosion modeling for effective erosion prevention. In: Water Resources Research Vol. 34, No. 3 , pp. 505-516.
Posluschny, A., 2002. Die hallstattzeitliche Besiedlung im Maindreieck – GIS-gestützte Fundstellenanalysen. BAR Internat. Ser. 1077, Oxford. In German.
Shafer, G., 1976. A Mathematical Theory of Evidence, 314 pp, Princeton University Press.
Shennan, S., 1997. Quantifying Archaeology, 433 pages. Edinburgh University Press; Subsequent edition.
Tobler, W. 1993. Three Presentations on Geographical Analysis and Modeling, Technical Report 93-1. National Center for Geographic Information and Analysis.
Weiss, A., 2001. Topographic Position and Landforms Analysis, The Nature Conservancy.
http://www.jennessent.com/downloads/TPI-Poster- TNC_18x22.pdf (20.12.2011)
Wiegert, M., 2002. Der “Hunnenring” von Otzenhausen, Lkr. St. Wendel. Die Siedlungsfunde und Bebauungsstrukturen einer spätlatenezeitlichen Höhenbefestigung im Saarland, Internat. Arch. 65, Rahden. In German.
Whitley, T.G., 2005. A brief outline of causality-based cognitive archaeologic probabilistic modelling, In: van Leusen, M. and Kamermans, H. (eds): Predictive Modelling for Archaeological Heritage Management: A research agenda. Nederlandse Archeologische Rapporten 29, pp. 123 -137.