H
istorically, Florida’s Everglades encom-passed about 3 million acres that stretched from Lake Okeechobee to Florida Bay, and its sawgrass plains, wetlands, ridges, sloughs, and tree islands supported a rich array of plant and animal life. However, over the past century the ecosystem has been greatly altered by an extensive water control infrastructure designed to provide lood control and water supply for urban and agricultural development. Today, the remnants of the original Everglades compete for vital water with urban and agricultural interests and are impaired by contaminated runoff from these two activities.The Comprehensive Everglades
Restoration Project (CERP), a joint effort led by the state of Florida and the federal govern-ment, was launched in 2000. The project was originally envisioned as a 30- to 40-year, $8-billion effort to restore the hydrologic characteristics of the Everglades and create a water system that serves the needs of both the natural and the human systems of South Florida. This report is the fourth in a series of biennial National Research Council reports that review the Comprehensive Everglades Restoration Project’s progress toward restoring the natural system.
Restoration Progress
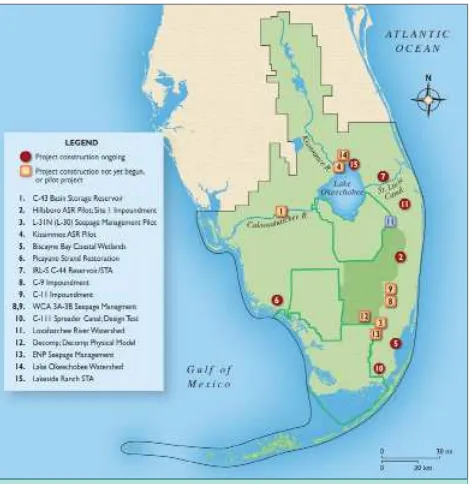
Over the past two years, notable progress has been made in launching CERP restoration projects, with eight projects now under construction. However, little progress has
been made on CERP projects that would beneit the core of the Everglades ecosystem—specii -cally, the Water Conservation Areas and Everglades National Park (see Figure 1).
Stormwater treatment areas and the imple-mentation of best management practices have helped reduce the loads of phosphorus lowing into the central Everglades, and the state and federal governments have recently agreed upon additional efforts to meet Everglades water Twelve years into the Comprehensive Everglades Restoration Project, little progress has been made in restoring the core of the remaining Everglades ecosystem; instead, most project construction so far has occurred along its periphery. To reverse ongoing ecosystem declines, it will be necessary to expedite restoration projects that target the central Everglades, and to improve both the quality and quantity of the water in the ecosystem. The new Central Everglades Planning Project offers an innovative approach to this challenge, although addi-tional analyses are needed at the interface of water quality and water quantity to maximize
restoration beneits within existing legal constraints.
Progress Toward Restoring the Everglades:
The Fourth Biennial Review, 2012
quality standards. However, there has been minimal progress in restoring hydrology in the remnant Everglades—that is, restoring the water low volumes and velocities, depth, and duration that sustain the distinctive terrain of the Everglades, including ridge and slough topography, tree
islands, and the peat that under-lies much of the system (see Box 1).
Recent state budget cuts, combined with inancial responsi -bilities associated with new water quality projects, threaten to slow hydrologic restoration progress even further. As a result, the federal government is likely to bear increased responsibility for maintaining the pace of CERP progress in the near term. To date, the state has vastly outspent the federal government on Everglades restoration projects and associated land acquisition. Additional Congressional autho-rizations will be needed to oficially credit the state for much of this spending.
Assessing Ecosystem
Attributes
To better understand the potential implications of the current slow pace of progress and project sequencing that focuses
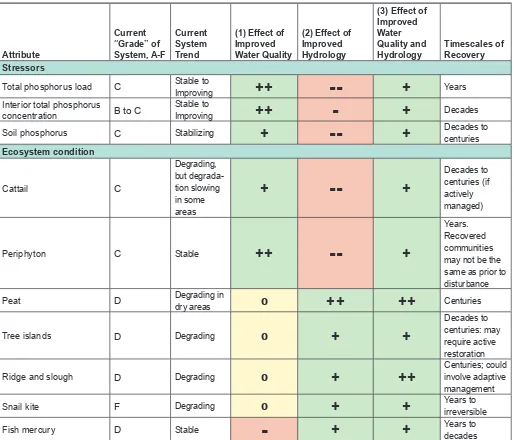
on water quality at the expense of water quantity, or vice versa, the report’s authoring committee assessed ten ecosystem attributes of the remnant Everglades. Three stressors (total phosphorus loads, interior phosphorus concentrations, and soil phosphorus levels) were considered along with seven attributes relecting ecosystem conditions (cattail, periphyton, ish mercury concentrations, peat, ridge and slough topography, tree islands, and snail kites; see Box 2). The committee assigned a letter grade to each attribute based on its current state relative to the pre-drainage Everglades ecosystem and described its current trend. The committee also assessed the future trajectory of each ecosystem attribute under three restoration scenarios: improved water quality, improved hydrology, and improvements to both water quality and hydrology (see Table 1). For most attributes, grades ranged from C (degraded) to D (signiicantly degraded), but the snail kite received a grade of F (near irreversible damage). The grades are not intended to prioritize restoration of a single attribute to the detriment of others, but to highlight the urgency of restoration actions that could beneit a wide range of ecosystem attributes and demonstrate the cost of inaction.
Box 1. Challenges at the Interface of Water Quality and Water Quantity
Ecosystem problems in the Everglades stem from altered hydrology and impaired water quality. Changes in hydrology make some areas often too dry and others too wet. The slow low of water that characterized the original Everglades ecosystem now occurs only in some areas, when suficient water is avail -able. Some areas of the ecosystem have become isolated (compartmentalized), limiting the water low that is necessary to support historical landscape features.
At the same time, water quality issues resulting from runoff from agricultural and urban areas disrupt the ecosystem, raising phosphorus and nitrogen levels far above historical levels. In recognition of these impacts, a phosphorus criterion of 10 parts per billion was established for water quality in the Everglades. Increasing the volume of water low into the Everglades, or even redistributing existing water, before water quality is improved risks introducing contaminants that could have signiicant impacts on the ecosystem and possibly exceed legal limits.
Box 2. Everglades Ecosystem Attributes
•
Cattails are plants that grow in freshwater wetland ecosystems. The extent of cattail cover in the Everglades is expanding at the expense of other native plants due to water inlows with elevated phosphorus levels.•
Periphyton is a mixture of algae and bacteria found in most aquatic ecosystems that serves as food for invertebrates, ish, and tadpoles. Once abundant throughout the Everglades, high phosphorus levels have reduced periphyton.•
Fish mercury concentrations are an indicator of mercury and sulfate contamina-tion in Everglades waters. Mercury contaminacontamina-tion originates from atmospheric emissions, and under elevated sulfate levels, mercury is converted to methyl mercury, which accumulates up the food chain.•
Peat soil is a natural feature of the Everglades, but as the landscape dries out due to overdrainage, the depth of peat is decreasing.•
Ridge and slough topography, with parallel sawgrass-covered ridges and sloughs that nearly always contained water under historical conditions, once covered about 1.5 million acres and helped sustain ish, alligators, and wading birds. Reduced water depths and compartmentalization that has reduced or eliminated sheet low, have degraded the ridge and slough topography.•
Tree islands are small forested islands of slightly raised topography scattered irregularly throughout the ridge and slough landscape that provide habitat for a range of wildlife. Changes in hydrology and the ire regime have led to the loss of many tree islands.Table 1. In a new analysis, the report’s authoring committee provided “grades” on current ecosystem conditions relative to pre-drainage conditions, and assessed current trends. Additionally, the committee compared the consequences of three restoration scenarios—(1) improved water quality with no increase in low, (2) improved hydrology, with no additional water quality treatment, and (3) both improved hydrology and water quality. The table is, by necessity, a simpliication of complex ecosystem responses.
Key: “Grades” are based on an assessment of the current level of impairment of that ecosystem attribute relative to a pre-drainage state. A: No signiicant degradation; B: Evidence of degradation; C: Degraded; D: Seriously degraded; F: Near irreversible degradation. The following relect responses to the three scenarios relative to the current system trend:
++
: Major improvement in trend;+
: Minor to moderate improvement in trend; 0:No change;-
:Minor to moderate decline in trend;- -
:Major degradation in decline in trend.Understanding Ecosystem Trajectories
The committee’s analyses demonstrate that a scenario focused only on improving the quality of existing water lows would reduce the spread of cattails and enhance periphyton recovery. Peat loss, however, would continue in over-drained areas, and tree islands and ridge and slough topography would continue to decline. Most of these losses would require decades to centuries to recover, even under ideal conditions.In contrast, if restoration projects focus only on hydrology, minor to moderate improvements could be expected for the trajectories of ridge and slough, tree islands, ish mercury, and snail kites, and major improvements for peat accumulations. However, these improvements would be accompanied by major expansions in cattails and the continued accumulation of soil phosphorus. These conditions could persist for decades to centuries, because high soil phosphorus levels will continue to impact vegetation—even if Attribute
Current “Grade” of System, A-F
Current System Trend
(1) Effect of Improved Water Quality
(2) Effect of Improved Hydrology
(3) Effect of Improved Water Quality and Hydrology
Timescales of Recovery Stressors
Total phosphorus load C Stable to
Improving
--
YearsInterior total phosphorus
concentration B to C
Stable to
Improving
-
DecadesSoil phosphorus C Stabilizing
--
Decades to centuries Ecosystem conditionCattail C
Degrading, but degrada-tion slowing in some areas
--
Decades to centuries (if actively managed)
Periphyton C Stable
--
Years. Recovered communities may not be the same as prior to disturbance
Peat D Degrading in
dry areas 0 Centuries
Tree islands D Degrading 0
Decades to centuries: may require active restoration
Ridge and slough D Degrading 0
Centuries; could involve adaptive management
Snail kite F Degrading 0 Years to
irreversible
Fish mercury D Stable
-
Years toCommittee on Independent Scientiic Review of Everglades Restoration Progress: William G. Boggess (Chair), Oregon State University, Corvallis; Mary Jane Angelo, University of Florida, Gainesville; David B. Ashley, University of Nevada, Las Vegas; Charles T. Driscoll, Syracuse University; William L. Graf; University of South Carolina, Columbia; Wendy D. Graham, University of Florida, Gainesville; Samuel N. Luoma, University of California, Davis; David R. Maidment, University of Texas, Austin; David H. Moreau, University of North Carolina, Chapel Hill; Scott W. Nixon, University of Rhode Island, Kingston,
through May 2012; K. Ramesh Reddy, University of Flordia, Gainesville; Helen Regan, University of California, Riverside; Eliska Rejmankova, University of California, Davis; Jeffrey R. Walters, Virgina Polytechnic Institute and State University, Blacksburg; Stephanie E. Johnson (Study Director), David J. Policansky (Scholar), Michael J. Stoever (Research Associate), Sarah E. Brennan (Senior Program Assistant),National Research Council.
The National Academies appointed the above committee of experts to address the speciic task requested by
the Department of the Army, the U.S. Department of the Interior and the South Florida Water Management District.
The members volunteered their time for this activity; their report is peer-reviewed and the inal product signed off by
both the committee members and the National Academies. This report brief was prepared by the National Research Council based on the committee’s report.
For more information, contact the Water Science and Technology Board at (202) 334-3422 or visit http://dels.nas.edu/wstb. Copies of
Progress Toward Restoring the Everglades: The Fourth Biennial Review, 2012 are available from the National Academies Press, 500 Fifth Street, NW, Washington, D.C. 20001; (800) 624-6242; www.nap.edu.
Permission granted to reproduce this brief in its entirety with no additions or alterations. Permission for images/igures must be obtained from their original source.
© 2012 The National Academy of Sciences
Read this report and locate information on related reports at
http://dels.nas.edu/wstb
phosphorus concentrations in inlow waters
improves—until the soils are buried by less contami-nated organic matter.
Improving both water quality and quantity would yield improvements in every ecosystem attribute investigated, but depending on the implementation schedule could take some time to achieve.
Support for Decision Making
Models that integrate hydrology, water quality, and ecology are essential tools to understand and evaluate the beneits and impacts of various restora -tion op-tions. Progress has been made in developing linked hydrologic and ecological models, but no ecological models have been approved for use in beneits analysis for CERP. Water quality models applied to project planning should analyze a range of inlow water quality conditions, including those that exceed targeted levels. Being overly cautious with respect to water quality modeling and analysis could prevent a thorough exploration of restoration options and limit the understanding of water quality
constraints on hydrologic restoration projects. An impressive and growing body of scientiic literature on the Everglades has been published in recent years, and recent science syntheses have helped advance understanding among scientists and decision makers. However, clearer acknowledgement
of conlicts and tradeoffs among the restoration solutions being considered would help increase success.
To further support decision making, a compre-hensive assessment of monitoring efforts is needed to ensure that short- and long-term needs of the CERP restoration program are met, and that critical gaps are addressed in the most cost-effective manner.