TRAINING IN-SERVICE TEACHERS TO DEVELOP STATISTICAL THINKING
Ernesto Sánchez and Ana L. Gómez Blancarte
Centro de Investigación y de Estudios Avanzados del IPN, México [email protected]
This paper describes the acquisition of statistical thinking by five in-service middle school teachers during a professional development course and the difficulties they encountered. The main activities of teachers were to plan, teach and analyze classroom lessons that would promote and enhance their students’ statistical thinking. The question then is: “How do teachers develop statistical thinking by means of designing and implementing classroom activities to promote it in their students?” Teachers attended a three-year professional development project. In the first year, they studied basic concepts of statistics. In the second, they planned and implemented a lesson, with the principal goal of developing their students’ statistical thinking. The topics of the lesson were graphs and arithmetic mean. In the third year, the lesson was reviewed, improved, and implemented again. Wild & Pfannkuch’s (1999) model was used as a guide in this study.
BACKGROUND AND THE PROBLEM
The 2008 ICMI/IASE discussion document remarks that pre-college teachers do not have a specific preparation in statistics education. Such a preparation is necessary for the teachers to improve their statistical content and pedagogical knowledge. The problem then is how to train mathematics teachers (pre- and in-service) to better succeed in statistics discipline.
There is a growing interest in training teachers by the design and implementation of statistical investigations inside the classrooms. For example, Lee and Mojica (2008) reports how teachers’ practices engage students in the process of statistical investigation. Burgess (2008) analyzed four types of statistical knowledge for teaching in relation to the four-dimensions of Wild and Pfannkuch (1999) model. He stated that as most teachers have not experienced the learning of statistics through investigations, they should be immersed in their own investigations. Makar (2008) reports an ongoing study designed for teachers to experience in learning to teach statistical inquiry. She informs that teachers progressed as they became more familiar with the inquiry process.
We report a study that was conducted within the context of a Master of Education for primary and secondary in-service teachers. We inform the learning process of 5 secondary school teachers (whose students are between 12 and 15 years old) who chose a development project related to teaching and learning statistics as a part of the Master program. The main goal of the project was to train teachers to develop statistical thinking by encouraging students to investigate. Thus, the research question is: How do teachers develop statistical thinking by means of designing and implementing classroom activities to promote students’ statistical thinking?
CONCEPTUAL FRAMEWORK
Based on Hiebert, Morris, Berk, and Jansen’s framework (2007) we prepare teachers to learn from teaching. Hiebert et al. suggest teachers should develop two kinds of competences: subject matter knowledge for teaching and analytic skills that enable developing relationships between teaching and learning.
The first kind of competence is necessary to unpack the content learning goals for students. The second one consists of four skills drawn from the daily routines of ordinary classroom teachers as they plan, implement and reflect on classroom lessons: “(a) setting learning goals for students, (b) assessing whether the goals are being achieved during the lesson, (c) specifying hypotheses for why the lesson did or did not work well, and (d) using the hypotheses to revise the lesson” (Hiebert et al., 2007, p. 49).
each of those stages.
Hiebert et al. (2007) consider the ability to specify the learning goal(s) is important in expanding teachers’ subject matter knowledge and in improving their teaching practices. To these authors, putting into play this ability means establishing what counts as evidence of the students’ learning. Stating it allows the teacher to clarify the pedagogical intention of teaching a lesson. It also helps to investigate whether the instruction facilitated or inhibited students’ achievement of the goals; as well as helping the teacher review class instructions to improve students’ learning in future lessons.
A statistical problem is understood as a question in which its answer (an unknown) requires data collection and analysis. The search for that answer results in the investigative cycle (Problem, Plan, Data, Analysis and Conclusions: PPDAC). If we pretend teachers to develop statistical thinking, it is important for them to be familiarized with the notion of statistical problem. Although there are interesting mathematical problems that help to develop a statistical thinking, the adjective statistical should be reserved for those that generate a PPDAC cycle.
Teachers’ instruction consists of teachers’ actions and decisions carried out during the class to create conditions for students to learn specific content as well as attitudes towards statistic. That is, the relationships between statistical content, the planned lesson and the generated activity contribute to create “learning environment that revealed characteristic conflicts, common meanings and intersecting interpretations” (Llinares, 2002, p. 200). Cobb and McClain (2004) introduced the notion of “the classroom activity structure” as one of the five Principles of Instructional Design for Supporting the Development of Student’s Statistical Reasoning. In this classroom activity structure, the teacher introduces “each instructional activity by talking through the data generation process with the students” (p. 385).
The evaluation of learning is related with the specification of the learning goals above mentioned. The main idea is to anticipate students’ answers during the planning lesson and to be aware of them during its implementation. Such answers can be seen as evidence that students either learn or do not. This allows taking a look at the teaching lesson retrospectively in order to search instructional episodes that facilitated or inhibited students’ achievement of the goals as well as to review the lesson to improve it.
In summary, the way the goals are put into practice is mediated by the lesson planned, which is organized around a statistical problem. Apart from indicating how to deliver the statistical content, the planning lesson anticipates and states teachers’ actions in the class. It also serves as an instrument to evaluate students’ learning during and after the implementation of the lesson. The teacher classroom management includes his/her personal style. He/she makes decisions in the class; at the same time he/she observes instructional episodes that will count as evidence about how the lesson goals are reached.
METHODOLOGY
The three-year project was organized in seminars (5 hours each; every two weeks) and it had two periods: Diagnostic and Lessons Study (LS). Five in-service secondary school teachers, three collaborators, and two supervisors (the authors) participated in the project.
The Diagnostic period lasted one year. Several activities to help teachers understand important ideas of statistics and data analysis were carried out during this period. In addition, teachers were engaged in an investigation where they explored students’ thinking by means of administrating questionnaires and analyzing students’ responses. The main goal of diagnostic questionnaires was to recognize students’ difficulties and their intuitive stochastic thinking. These activities were the pathway to the LS period.
The LS is a methodology that has been recently implemented in statistics (Garfield and Ben-Zvi, 2008). It consisted in a cycle of activities in which teachers jointly plan, observe, analyze, and refine actual classroom lessons (Lewis, 2000). It offers an alternative to bring ideas and events from the classroom into the professional development setting.
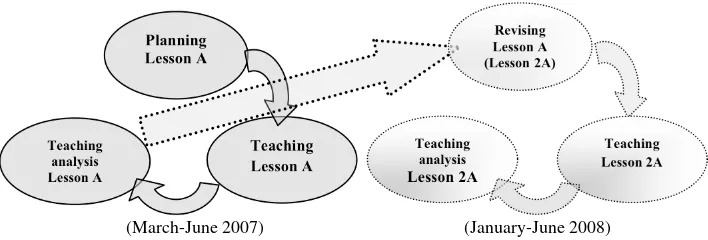
Figure 1. First and Second Lesson A Study Cycles
First cycle. In the Planning Lesson A phase, teachers and collaborators jointly planned a lesson on graphs and average to develop statistical thinking characteristics. After planning Lesson A, each teacher taught it in one of his or her actual classes. The Teaching Lesson A phase was videotaped. Finally, in the Teaching analysis phase, teachers selected excerpts of their teaching to discuss about the effects of their teaching.
Second cycle. Based on experience and evidence, teachers, collaborators and supervisors together reviewed the Lesson A to improve it (Lesson 2A phase). Then Lesson 2A was taught (Teaching Lesson 2A phase) and analyzed (Teaching analysis Lesson 2A phase).
The data collected comes from the videotaped discourses happened during the Teaching and Teaching analysis phases of the two cycles. Following Powell, Francisco and Maher (2003) methodology, the videotapes were viewed several times. Critical events were identified, transcribed and coded.
RESULTS
The learning goal(s)
The changes made in the lesson goals can be seen as an indicator of teachers’ learning. This learning took place in the course of the two cycles. In the first cycle the teachers specified goals to establish statistical processes learning (e. g., to collect, organize, present and analyze data). Teachers did not think about a Problem when they described those goals. This means teachers were particular interested in the third and fourth PPDAC stages.
The specified goals were statements of what students would do when completing a task; for example: Students should collect data and organize it in tables [Excerpt from planning Lesson A].
The teachers relied on the objectives stated in the official syllabus to define lesson goals.
In the second cycle, based on teaching analysis, the goals teachers defined changed from procedural goals to conceptual goals. Explicitly, they considered some statistical thinking elements as learning goals. For example, the general goal they stated was characterized by the inclusion of almost all the stages of PPDAC cycle: Students should, through a problem, carryout activities that involve data estimation, collection, organization, analysis and interpretation that enable them develop statistical thinking [Excerpt from revising Lesson A].The specific goals were concrete to the extent that some types of statistical thinking were mentioned, for example: Students should notice themselves of the necessity of real data to solve the problem; students should discuss the statistical results in relation with the problem [Excerpt from revising Lesson A].
In summary, by comparing the goals of the first cycle and those of the second one it can be noticed that teachers progressed in the way they conceived some statistical thinking elements as part of students’ learning. The progress was evident when the teachers were aware of the relation between the fundamental types of statistical thinking and the investigative stages. The teachers realized that those types of thinking reflect cognitive skill and that students’ learning could be evaluated in terms of students’ thinking rather than students’ actions.
(January-June 2008) (March-June 2007)
Planning Lesson A
Teaching analysis Lesson A
Teaching Lesson A
Teaching analysis Lesson 2A
Teaching Lesson 2A Revising
The investigative problem
Before planning Lesson A, the supervisors asked the teachers to propose an activity related to graph or central tendency measures. The tasks teachers suggested were focused on reading graphs or on solving mathematical problems, for example: 27 students grade list is: (1) 10, (4) 9, (6) 8, (8) 7, (5) 6, and (3) 5. What is the average grade? What is the most frequently grade in the list? In the Planning Lesson A phase, the supervisors made teachers reflect that tasks they proposed did not have a statistical problem. Then, the teachers focused on planning Lesson A. However, they did not bring the problem up during the first 50 minutes of planning. Instead, they argued the statistical processes to be included.
They were aware of the problem when a collaborator asked them to think of the kind of data they were talking about.
Collaborator: (…) What do you mean with collecting data? Teacher 1: (…) For example, to investigate students’ ages (…) Teacher 2: The problem we will present to our students (…)
The Teacher’s 1 answer is a common example of teachers’ statistical classes; they are used to collecting data to teach tables and graphs. However, the example Teacher 1 gave does not have a question to investigate. The Teacher’s 2 answer made the group operate in the first stage of the PPDAC investigative cycle.
Another collaborator suggested a problem: Students that carry a weight upper than 10% of their body weight run the risk to be hurt in the vertebral column. This problem was adapted from Tinker Plots, but teachers did not know it. Discussing this problem enabled teachers to formulate interesting investigative questions: How many children in the classroom are carrying backpacks heavier than the allowed weight? Who between boys and girls carry more than 10% of their body weight? Teachers recognized that both the problem and what it is known about it is what determines the data and the subsequent stages of the PPDAC cycle (see Gómez & Sánchez, 2008 for more details).
Even though the teachers had a statistical problem to investigate (backpacks problem), they missed opportunities to enhance their students’ statistical thinking in the course of the Teaching phase. So, the major challenge in the second cycle was to find ways to do that.
In the Revising Lesson A phase, the supervisors explained the teachers that the use of the interrogative cycle could help students become aware of their own thinking. Thus, teachers modified the lesson tasks in order to provide opportunities for the students to experience with the problem and data. For example, they thought about the following questions: How can we knowif in this group there are students with a backpack weighing more than 10%? How can we collect and organize data? How can we compare the two (boys and girls) data sets?
Teachers’ instruction
Planning a lesson does not only consist in specifying the goals and the statistical problem but also in anticipating the role of the teacher. The teacher should participate in class discussions and share information with the students; however, he/she should allow them to pursue their own ways of thinking. If the goal is to develop students’ statistical thinking, the teachers should know how they should interact with students in order to make this goal be achieved.
In the Planning Lesson A phase, no discussion about teacher classroom management was raised. The teachers designed worksheets for students in which they included all procedures students would follow. So, those worksheets excluded teachers’ instructions during the Teaching Lesson A phase. Thus, teachers’ participations consisted in explaining the procedures to the students. There was no a discussion to interpret the statistical results in relation to the context of the problem.
Although the teachers engaged in helping students understanding statistical processes and concepts, they missed some opportunities for students to analyze graphs.
The evaluation of learning
In the Teaching analysis Lesson A phase, the teachers were asked if the lessons goals were achieved. They responded affirmatively arguing that their students performed the lesson tasks. This means, students’ procedural manifestations served as evidence for teachers rather than students’ thinking.
The teachers took cognizance of their earlier experience and became concerned in creating conditions through which students’ learning could be observed. One of this conditions consisted in promoting group discussions. In this way, teachers could use students’ responses as evidence of students’ learning.
CONCLUSIONS
This study was undertaken as part of a teachers’ professional development program, based on the following four recommendations to:
a) Promote teachers to teach statistics by the use of investigations to develop students’ statistical thinking.
b) Promote teachers to jointly plan a lesson, implement it in their classroom, and take evidence to assess the effectiveness of teaching.
c) Encourage them to do a retrospective analysis of their teaching in order to detect how a particular instance of teaching (task, question, activity, teacher strategies, etc.) facilitates or inhibits a particular kind of learning.
d) Use this analysis to improve their teaching.
At the end of the second cycle teachers made some progress related to at least three major areas: the notion of statistical problem, the teachers’ instruction and the evaluation of students’ learning.
With respect to the notion of a statistical problem, the teachers progressed in the way they conceived it: from giving students routine exercises to giving them a statistical problem that involved a PPDAC cycle. This progress was due to the fact that teachers thought beyond the syllabus. In other words, on the one hand, the teachers comprehended that is possible to teach more than one concept in one lesson; on the other, they realized that statistical procedures they are use to teaching should not only be focused on calculations but also on solving statistical problems.
Teachers’ instruction was also improved. The teachers were aware of the necessity to offer students opportunities to communicate and reflect their statistical ideas as well as to inform the importance of specific statistical concepts.
The teacher’s progress in regard to evaluation students’ learning was possible as they understand the connections between the stages of the investigative cycle and the types of thinking. That is, they related procedural actions with conceptual understanding. Even more, teachers also learned that evaluation of students’ learning could not only take place until the final exam is posed but also during the course.
In conclusion, the four-dimensional framework for statistical thinking in empirical inquiry helped teachers distinguish a statistical problem as well as to organize the lesson tasks. We suggest that training in-service teachers to develop statistical thinking should include a variety of statistical problems that can be solved in the classroom context. The training in-service teachers should also support teachers to develop skills to analyze their teaching in terms of students’ learning.
The Lessons Study activities are a pathway to help teachers learn from their teaching and are a good setting in which teachers can construct common meanings about the characteristics of the statistical thinking.
REFERENCES
Burgess, T. (2008). Teacher knowledge for teaching statistics through investigations. In C. Batanero, G. Burril, C. Reading & A. Rossman (Eds.). Proceedings of the ICMI Study 18 and 2008 IASE Round Table Conference. Monterrey, México.
Cobb, P., & McClain, K. (2004). Principles of instructional design for supporting the development of students’ statistical reasoning. D. Ben-Zvi & J. Garfield (Eds.). The Challenge of Developing Statistical Literacy, Reasoning and Thinking. Dordrecht, The Netherlands: Kluwer Academic Press.
Garfield, J. B., & Ben-Zvi, D. (2008). Developing students’ statistical reasoning. Connecting research and teaching practice. Springer.
Gómez, B. A. L., & Sánchez, S. E. (2008). El pesamiento estadístico en la planificación de lecciones de estadística por profesores de secundaria. In R. Luengo González, B. Gómez Alfonso, M. Camacho Machín, & L. J. Blanco Nieto (Eds.), Memorias del XII Simposio de la Socidad Española de Investigación en Educación Matemática (SEIEM). Badajoz, España. Hiebert, J., Morris, A. K., Berk, D., & Jansen, A. (2007). Preparing teachers to learn from teaching.
Journal of teacher education, 58(1), 47-61.
Lee, H. S., & Mojica, G. F. (2008). Examining how teachers’ practices support statistical investigations. In C. Batanero, G. Burril, C. Reading & A. Rossman (Eds.). Proceedings of the ICMI Study 18 and 2008 IASE Round Table Conference. Monterrey, México.
Lewis, C. (2000). Lesson Study: The core of Japanese professional development. Invited presentation to the Special Interest Group on Research in Mathematics Education at the annual meeting of the American Educational Research Association. New Orleans, L. A. Online: www.lessonresearch.net/aera2000.pdf.
Llinares, S. (2002). Participation and reification in learning to teach: The role of knowledge and beliefs. In G. C. Leder, E. Pehkonen & G. Törner (Eds.), Beliefs: A Hidden Variable in Mathematics Education? Dordrecht, The Netherlands: Kluwer.
Makar, K. (2008). A model of learning to teach statistical inquiry. In C. Batanero, G. Burril, C. Reading & A. Rossman (Eds.). Proceedings of the ICMI Study 18 and 2008 IASE Round Table Conference. Monterrey, México.
Powell, A. B., Francisco, J. M., & Maher, C. A. (2003). An analytical model for studying the development of learners’ mathematical ideas and reasoning using videotape data. Journal of Mathematical Behavior, 22, 405-435.