Crosstabs
teratur membersihkan * Akne Vulgaris
Crosstab
13 2 15
10.6 4.4 15.0
27.1% 10.0% 22.1%
19.1% 2.9% 22.1%
35 18 53
37.4 15.6 53.0
72.9% 90.0% 77.9%
51.5% 26.5% 77.9%
48 20 68
48.0 20.0 68.0
100.0% 100.0% 100.0%
70.6% 29.4% 100.0%
Count
Expected Count % wit hin Akne Vulgaris % of Total
Count
Expected Count % wit hin Akne Vulgaris % of Total
Count
Expected Count % wit hin Akne Vulgaris % of Total
tidak
y a teratur membersihkan
Total
y a tidak
Akne Vulgaris
Total
Chi-Square Tests
2.396b 1 .122
1.506 1 .220
2.685 1 .101
.199 .107
2.361 1 .124
68 Pearson Chi-Square
Continuity Correctiona Likelihood Ratio Fisher's Exact Test Linear-by -Linear Association N of Valid Cases
Value df
Asy mp. Sig. (2-sided)
Exact Sig. (2-sided)
Exact Sig. (1-sided)
Computed only f or a 2x2 table a.
1 cells (25.0%) hav e expected count less than 5. The minimum expected count is 4. 41.
frekuensi <3x * Akne Vulgaris
Crosstab
31 15 46
32.5 13.5 46.0
64.6% 75.0% 67.6%
45.6% 22.1% 67.6%
17 5 22
15.5 6.5 22.0
35.4% 25.0% 32.4%
25.0% 7.4% 32.4%
48 20 68
48.0 20.0 68.0
100.0% 100.0% 100.0% 70.6% 29.4% 100.0% Count
Expected Count % wit hin Akne Vulgaris % of Total
Count
Expected Count % wit hin Akne Vulgaris % of Total
Count
Expected Count % wit hin Akne Vulgaris % of Total
y a
tidak f rekuensi
<3x
Total
y a tidak
Akne Vulgaris
Total
Chi-Square Tests
.700b 1 .403
.305 1 .581
.720 1 .396
.571 .294
.690 1 .406
68 Pearson Chi-Square
Continuity Correctiona Likelihood Ratio Fisher's Exact Test Linear-by -Linear Association N of Valid Cases
Value df
Asy mp. Sig. (2-sided)
Exact Sig. (2-sided)
Exact Sig. (1-sided)
Computed only f or a 2x2 table a.
0 cells (.0%) hav e expected count less than 5. The minimum expected count is 6. 47.
frekuensi >=3x * Akne Vulgaris
Crosstab
34 15 49
34.6 14.4 49.0
70.8% 75.0% 72.1%
50.0% 22.1% 72.1%
14 5 19
13.4 5.6 19.0
29.2% 25.0% 27.9%
20.6% 7.4% 27.9%
48 20 68
48.0 20.0 68.0
100.0% 100.0% 100.0% 70.6% 29.4% 100.0% Count
Expected Count % wit hin Akne Vulgaris % of Total
Count
Expected Count % wit hin Akne Vulgaris % of Total
Count
Expected Count % wit hin Akne Vulgaris % of Total
tidak
y a f rekuensi >=3x
Total
y a tidak
Akne Vulgaris
Total
Chi-Square Tests
.122b 1 .727
.003 1 .958
.123 1 .725
1.000 .487
.120 1 .729
68 Pearson Chi-Square
Continuity Correctiona Likelihood Ratio Fisher's Exact Test Linear-by -Linear Association N of Valid Cases
Value df
Asy mp. Sig. (2-sided)
Exact Sig. (2-sided)
Exact Sig. (1-sided)
Computed only f or a 2x2 table a.
0 cells (.0%) hav e expected count less than 5. The minimum expected count is 5. 59.
pembersih * Akne Vulgaris
Crosstab
7 4 11
7.8 3.2 11.0
14.6% 20.0% 16.2% 10.3% 5.9% 16.2%
39.5 16.5 56.0 83.3% 80.0% 82.4% 58.8% 23.5% 82.4%
48 20 68
48.0 20.0 68.0 100.0% 100.0% 100.0% 70.6% 29.4% 100.0% Count
Expected Count % wit hin Akne Vulgaris % of Total
Count
Expected Count % wit hin Akne Vulgaris % of Total
Count
Expected Count % wit hin Akne Vulgaris % of Total
Count
Expected Count % wit hin Akne Vulgaris % of Total
hany a dengan air
sabun mandi
sabun pembersih wajah pembersih
Total
y a tidak Akne Vulgaris
Total
Chi-Square Tests
.692a 2 .708
.962 2 .618
.195 1 .659
68 Pearson Chi-Square
Likelihood Ratio Linear-by -Linear Association N of Valid Cases
Value df
Asy mp. Sig. (2-sided)
3 cells (50.0%) hav e expected count less t han 5. The minimum expected count is .29.
pembersih dari dokter * Akne Vulgaris
Crosstab
38 19 57
40.2 16.8 57.0
79.2% 95.0% 83.8%
55.9% 27.9% 83.8%
10 1 11
7.8 3.2 11.0
20.8% 5.0% 16.2%
14.7% 1.5% 16.2%
48 20 68
48.0 20.0 68.0
100.0% 100.0% 100.0% 70.6% 29.4% 100.0% Count
Expected Count % wit hin Akne Vulgaris % of Total
Count
Expected Count % wit hin Akne Vulgaris % of Total
Count
Expected Count % wit hin Akne Vulgaris % of Total
tidak
y a pembersih dari dokter
Total
y a tidak
Akne Vulgaris
Total
Chi-Square Tests
2.610b 1 .106
1.573 1 .210
3.124 1 .077
.155 .100
2.572 1 .109
68 Pearson Chi-Square
Continuity Correctiona Likelihood Ratio Fisher's Exact Test Linear-by -Linear Association N of Valid Cases
Value df
Asy mp. Sig. (2-sided)
Exact Sig. (2-sided)
Exact Sig. (1-sided)
Computed only f or a 2x2 table a.
1 cells (25.0%) hav e expected count less than 5. The minimum expected count is 3. 24.
arah membersihkan * Akne Vulgaris
Crosstab
12 5 17
12.0 5.0 17.0
25.0% 25.0% 25.0%
17.6% 7.4% 25.0%
36 15 51
36.0 15.0 51.0
75.0% 75.0% 75.0%
52.9% 22.1% 75.0%
48 20 68
48.0 20.0 68.0
100.0% 100.0% 100.0%
70.6% 29.4% 100.0%
Count
Expected Count % wit hin Akne Vulgaris % of Total
Count
Expected Count % wit hin Akne Vulgaris % of Total
Count
Expected Count % wit hin Akne Vulgaris % of Total
tidak
y a arah membersihkan
Total
y a tidak
Akne Vulgaris
Total
Chi-Square Tests
.000b 1 1.000
.000 1 1.000
.000 1 1.000
1.000 .613
.000 1 1.000
68 Pearson Chi-Square
Continuity Correctiona Likelihood Ratio Fisher's Exact Test Linear-by -Linear Association N of Valid Cases
Value df
Asy mp. Sig. (2-sided)
Exact Sig. (2-sided)
Exact Sig. (1-sided)
Computed only f or a 2x2 table a.
0 cells (.0%) hav e expected count less than 5. The minimum expected count is 5. 00.
waktu membersihkan * Akne Vulgaris
Crosstab
17 8 25
17.6 7.4 25.0
35.4% 40.0% 36.8%
25.0% 11.8% 36.8%
31 12 43
30.4 12.6 43.0
64.6% 60.0% 63.2%
45.6% 17.6% 63.2%
48 20 68
48.0 20.0 68.0
100.0% 100.0% 100.0%
70.6% 29.4% 100.0%
Count
Expected Count % within Akne Vulgaris % of Total
Count
Expected Count % within Akne Vulgaris % of Total
Count
Expected Count % within Akne Vulgaris % of Total
tidak
y a waktu membersihkan
Total
y a tidak
Akne Vulgaris
Total
Chi-Square Tests
.128b 1 .721
.007 1 .935
.127 1 .722
.786 .464
.126 1 .723
68 Pearson Chi-Square
Continuity Correctiona Likelihood Ratio Fisher's Exact Test Linear-by -Linear Association N of Valid Cases
Value df
Asy mp. Sig. (2-sided)
Exact Sig. (2-sided)
Exact Sig. (1-sided)
Computed only f or a 2x2 table a.
0 cells (.0%) hav e expected count less than 5. The minimum expected count is 7. 35.
pengobatan * Akne Vulgaris
Crosstab
36 19 55
38.8 16.2 55.0
75.0% 95.0% 80.9%
52.9% 27.9% 80.9%
12 1 13
9.2 3.8 13.0
25.0% 5.0% 19.1%
17.6% 1.5% 19.1%
48 20 68
48.0 20.0 68.0
100.0% 100.0% 100.0% 70.6% 29.4% 100.0% Count
Expected Count % wit hin Akne Vulgaris % of Total
Count
Expected Count % wit hin Akne Vulgaris % of Total
Count
Expected Count % wit hin Akne Vulgaris % of Total
Akne Vulgaris
Total
Chi-Square Tests
3.652b 1 .056
2.473 1 .116
4.433 1 .035
.089 .051
3.598 1 .058
68 Pearson Chi-Square
Continuity Correctiona Likelihood Ratio Fisher's Exact Test Linear-by -Linear Association N of Valid Cases
Value df
Asy mp. Sig. (2-sided)
Exact Sig. (2-sided)
Exact Sig. (1-sided)
Computed only f or a 2x2 table a.
1 cells (25.0%) hav e expected count less than 5. The minimum expected count is 3. 82.
genetik * Akne Vulgaris
Crosstab
27 3 30
21.2 8.8 30.0
56.3% 15.0% 44.1%
39.7% 4.4% 44.1%
21 17 38
26.8 11.2 38.0
43.8% 85.0% 55.9%
30.9% 25.0% 55.9%
48 20 68
48.0 20.0 68.0
100.0% 100.0% 100.0% 70.6% 29.4% 100.0% Count
Expected Count % wit hin Akne Vulgaris % of Total
Count
Expected Count % wit hin Akne Vulgaris % of Total
Count
Expected Count % wit hin Akne Vulgaris % of Total
Akne Vulgaris
Total
Chi-Square Tests
9.744b 1 .002
8.142 1 .004
10.626 1 .001
.003 .002
9.600 1 .002
68 Pearson Chi-Square
Continuity Correctiona Likelihood Ratio Fisher's Exact Test Linear-by -Linear Association N of Valid Cases
Value df
Asy mp. Sig. (2-sided)
Exact Sig. (2-sided)
Exact Sig. (1-sided)
Computed only f or a 2x2 table a.
0 cells (.0%) hav e expected count less than 5. The minimum expected count is 8. 82.
psikis * Akne Vulgaris
Crosstab
31 6 37
26.1 10.9 37.0
64.6% 30.0% 54.4%
45.6% 8.8% 54.4%
17 14 31
21.9 9.1 31.0
35.4% 70.0% 45.6%
25.0% 20.6% 45.6%
48 20 68
48.0 20.0 68.0
100.0% 100.0% 100.0% 70.6% 29.4% 100.0% Count
Expected Count % wit hin Akne Vulgaris % of Total
Count
Expected Count % wit hin Akne Vulgaris % of Total
Count
Expected Count % wit hin Akne Vulgaris % of Total
Akne Vulgaris
Total
Chi-Square Tests
6.807b 1 .009
5.484 1 .019
6.905 1 .009
.015 .009
6.707 1 .010
68 Pearson Chi-Square
Continuity Correctiona Likelihood Ratio Fisher's Exact Test Linear-by -Linear Association N of Valid Cases
Value df
Asy mp. Sig. (2-sided)
Exact Sig. (2-sided)
Exact Sig. (1-sided)
Computed only f or a 2x2 table a.
0 cells (.0%) hav e expected count less than 5. The minimum expected count is 9. 12.
makanan * Akne Vulgaris
Crosstab
33 6 39
27.5 11.5 39.0
68.8% 30.0% 57.4%
48.5% 8.8% 57.4%
15 14 29
20.5 8.5 29.0
31.3% 70.0% 42.6%
22.1% 20.6% 42.6%
48 20 68
48.0 20.0 68.0
100.0% 100.0% 100.0% 70.6% 29.4% 100.0% Count
Expected Count % wit hin Akne Vulgaris % of Total
Count
Expected Count % wit hin Akne Vulgaris % of Total
Count
Expected Count % wit hin Akne Vulgaris % of Total
Akne Vulgaris
Total
Chi-Square Tests
8.667b 1 .003
7.155 1 .007
8.733 1 .003
.006 .004
8.539 1 .003
68 Pearson Chi-Square
Continuity Correctiona Likelihood Ratio Fisher's Exact Test Linear-by -Linear Association N of Valid Cases
Value df
Asy mp. Sig. (2-sided)
Exact Sig. (2-sided)
Exact Sig. (1-sided)
Computed only f or a 2x2 table a.
0 cells (.0%) hav e expected count less than 5. The minimum expected count is 8. 53.
NPar Tests
Two-Sample Kolmogorov-Smirnov Test
Frequencies
48 20 68 Akne Vulgaris
y a tidak Total pembersih
N
Test Statisticsa
.054 .000 -.054 .204 1.000 Absolute
Positiv e Negativ e Most Extreme
Dif f erences
Kolmogorov -Smirnov Z Asy mp. Sig. (2-tailed)
pembersih
Explore
Usia
Descriptives
19.40 .165
19.06
.312 .343
-.987 .674
20.00 .262
19.45
-.219 .512
-1.147 .992
Mean
Lower Bound Upper Bound 95% Conf idence
Interv al f or Mean
5% Trimmed Mean Median
Interquartile Range Skewness
Kurt osis Mean
Lower Bound Upper Bound 95% Conf idence
Interv al f or Mean
5% Trimmed Mean Median
Interquartile Range Skewness
Kurt osis Akne Vulgaris
y a
tidak Usia
Stat istic Std. Error
Tests of Normal ity
.198 48 .000 .883 48 .000
.254 20 .002 .878 20 .017
Akne Vulgaris y a
tidak Usia
St at ist ic df Sig. St at ist ic df Sig. Kolmogorov -Smirnova Shapiro-Wilk
Akne Vulgaris
tidak ya
Usi
a
22
21
20
19
18
NPar Tests
Mann-Whitney Test
Ranks
48 31.63 1518.00
20 41.40 828.00
68 Akne Vulgaris
y a tidak Total Usia
N Mean Rank Sum of Ranks
Test Statisticsa
342.000 1518.000 -1.916 .055 Mann-Whitney U
Wilcoxon W Z
Asy mp. Sig. (2-tailed)
Usia
Logistic Regression
Case Processing Summary
68 100.0
0 .0
68 100.0
0 .0
68 100.0
Unweighted Casesa
Included in Analy sis Missing Cases Total
Selected Cases
Unselected Cases Total
N Percent
If weight is in ef f ect, see classif ication table f or the total number of cases.
a.
Dependent Vari able Encoding
0 1 Original Value
y a tidak
Internal Value
Block 0: Beginning Block
Classification Tabl ea,b
48 0 100.0
20 0 .0
70.6 Observ ed
y a tidak Akne Vulgaris
Ov erall Percentage Step 0
y a tidak
Akne Vulgaris Percentage Correct Predicted
Constant is included in the model. a.
The cut v alue is .500 b.
Variables in the Equation
-.875 .266 10.820 1 .001 .417
Constant St ep 0
B S. E. Wald df Sig. Exp(B)
Variables not i n the Equation
2.396 1 .122
18.580 6 .005
teratur. bersih pembrsh.dr
Ov erall Statistics Step
0
Block 1: Method = Backward Stepwise (Likelihood Ratio)
Omnibus Tests of Model Coefficients
22.737 6 .001
22.737 6 .001
22.737 6 .001
-.049 1 .824
22.688 5 .000
22.688 5 .000
-1.468 1 .226
21.220 4 .000
21.220 4 .000
-1.399 1 .237
19.821 3 .000
19.821 3 .000
St ep
Chi-square df Sig.
A negat iv e Chi-squares v alue indicates that the Chi-squares v alue has decreased f rom the prev ious step.
a.
Model Summary
59.651a .284 .405 59.700a .284 .404 61.169a .268 .382 62.567b .253 .360 St ep
Cox & Snell R Square
Nagelkerke R Square
Estimation terminat ed at iteration number 6 because parameter est imat es changed by less than .001. a.
Estimation terminat ed at iteration number 5 because parameter est imat es changed by less than .001. b.
Classification Tabl ea
46 2 95.8 Observ ed
y a tidak Akne Vulgaris
Ov erall Percentage y a tidak Akne Vulgaris
Ov erall Percentage y a tidak Akne Vulgaris
Ov erall Percentage y a tidak Akne Vulgaris
Ov erall Percentage Step 1
Step 2
Step 3
Step 4
y a tidak
Akne Vulgaris Percentage Correct Predicted
Variables i n the Equation
1.140 .915 1.552 1 .213 3.126 .520 18.779
-1.352 1.304 1.075 1 .300 .259 .020 3.332
-1.598 1.218 1.722 1 .189 .202 .019 2.200
1.922 .788 5.944 1 .015 6.835 1.458 32.051
1.250 .796 2.466 1 .116 3.490 .733 16.608
.178 .802 .049 1 .824 1.195 .248 5.754
-5.065 2.818 3.231 1 .072 .006
1.148 .912 1.584 1 .208 3.152 .527 18.839
-1.424 1.263 1.271 1 .260 .241 .020 2.864
-1.594 1.215 1.720 1 .190 .203 .019 2.199
1.978 .750 6.961 1 .008 7.231 1.663 31.435
1.348 .666 4.092 1 .043 3.848 1.043 14.200
-4.979 2.786 3.193 1 .074 .007
1.020 .907 1.265 1 .261 2.772 .469 16.388
-1.808 1.155 2.449 1 .118 .164 .017 1.578
1.988 .739 7.229 1 .007 7.299 1.714 31.084
1.310 .648 4.084 1 .043 3.705 1.040 13.192
-6.015 2.605 5.330 1 .021 .002
-1.702 1.147 2.200 1 .138 .182 .019 1.728
2.022 .733 7.619 1 .006 7.554 1.797 31.750
1.423 .637 4.994 1 .025 4.149 1.191 14.451
-4.504 2.111 4.555 1 .033 .011
teratur. bersih pembrsh.dr
teratur. bersih pembrsh.dr
teratur. bersih pengobatan
B S.E. Wald df Sig. Exp(B) Lower Upper
95.0% C.I.f or EXP(B)
Variable(s) entered on st ep 1: teratur. bersih, pembrsh.dr, pengobatan, genetik, psikis, makanan. a.
Model if Term Removed
-30.687 1.724 1 .189
-30.433 1.215 1 .270
-30.883 2.115 1 .146
-33.381 7.111 1 .008
-31.110 2.568 1 .109
-29.850 .049 1 .824
-30.733 1.765 1 .184
-30.584 1.468 1 .226
-30.908 2.116 1 .146
-34.135 8.569 1 .003
-32.046 4.391 1 .036
-31.284 1.399 1 .237
-32.230 3.291 1 .070
-35.057 8.945 1 .003
-32.746 4.324 1 .038
-32.750 2.933 1 .087
-36.053 9.538 1 .002
-33.969 5.371 1 .020
Variable
Likelihood df
Variables not in the Equation
.049 1 .824
.049 1 .824
1.382 1 .240
.307 1 .579
1.437 2 .487
1.324 1 .250
1.032 1 .310
.330 1 .565
2.824 3 .419
makanan Variables
Ov erall Statistics St ep 2a
pembrsh.dr makanan Variables
Ov erall Statistics St ep 3b
teratur.bersih pembrsh.dr makanan Variables
Ov erall Statistics St ep 4c
Score df Sig.
Variable(s) remov ed on step 2: makanan. a.
Variable(s) remov ed on step 3: pembrsh. dr. b.
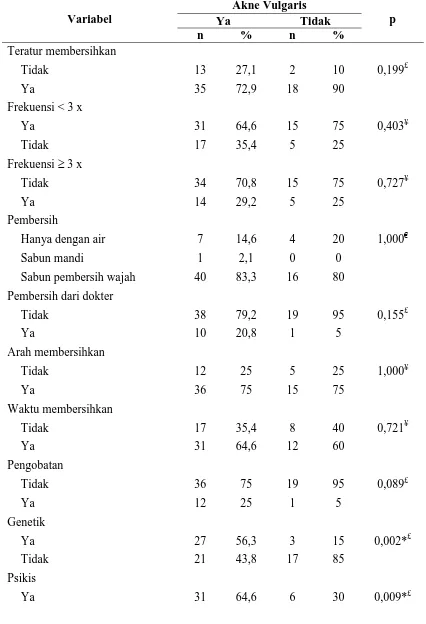
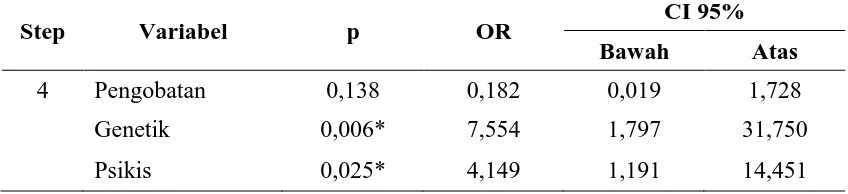
Tabel Hasil Uji Chi Square Berdasarkan Kejadian Akne Vulgaris
Variabel
Akne Vulgaris
p
Ya
Tidak
n
%
n
%
Teratur membersihkan
Tidak
13
27,1
2
10
0,199
£Ya
35
72,9
18
90
Frekuensi < 3 x
Ya
31
64,6
15
75
0,403
¥Tidak
17
35,4
5
25
Frekuensi
3 x
Tidak
34
70,8
15
75
0,727
¥Ya
14
29,2
5
25
Pembersih
Hanya dengan air
7
14,6
4
20
1,000
€Sabun mandi
1
2,1
0
0
Sabun pembersih wajah
40
83,3
16
80
Pembersih dari dokter
Tidak
38
79,2
19
95
0,155
£Ya
10
20,8
1
5
Arah membersihkan
Tidak
12
25
5
25
1,000
¥Ya
36
75
15
75
Waktu membersihkan
Tidak
17
35,4
8
40
0,721
¥Ya
31
64,6
12
60
Pengobatan
Tidak
36
75
19
95
0,089
£Ya
12
25
1
5
Genetik
Ya
27
56,3
3
15
0,002*
£Tidak
21
43,8
17
85
Psikis
Tidak
17
35,4
14
70
Makanan
Ya
33
68,8
6
30
0,003*
£Tidak
15
31,3
14
70
Keterangan :
£
Fisher’s Eacxt Test
¥
Pearson Chi Square Test
€
Kolmogorov Smirnov 2 Sampel
* Signifikan p < 0,05
Tabel Distribusi umur responden terhadap Akne Vulgaris
Akne Vulgaris
Mean
SD
p
Ya
19,40
1,144
0,055
‡Tidak
20,00
1,170
Keterangan :
‡