COMPLEMENTARITIES BETWEEN ORGANISATIONAL
STRATEGIES AND INNOVATION
BRIAN P. COZZARINa,∗and JENNIFER C. PERCIVALb
aDepartment of Management Sciences, University of Waterloo, 200 University Avenue West, Waterloo, ON N2L 3G1, Canada;bFaculty of Business and Information Technology, University of Ontario
Institute of Technology, 2000 Simcoe Street North, Oshawa, ON L1H 7L7, Canada (Received 13 April 2004; Revised 19 April 2005; In final form 17 June 2005)
The purpose of this paper is to determine whether organizational strategies in various manufacturing industries are complementary with innovation. In particular, our interest is to discover which organizational strategies are complementary with major innovations (world-first and Canada-first). Knowledge of complementarity should pave the way for creating sustainable competitive advantage because the use of a complex strategy may be difficult to imitate. In other words, competitive advantage increases as the complexity of the strategy increases (i.e. because the number of strategy combinations follows a power law), which acts as a barrier to potential imitators (Rivkin, J.W. (2000) Imitation of Complex Strategies.Management Science,46(6), 824–844.).
Because of the static nature of our results (productivity and profit are for 1997), their interpretation can only be tentative. Thus, our research is really a first step along the road to understanding the (potential) importance of complementarities among firm strategies. Caveats aside, managers may want to compare their own firm’s emphasis on particular strategies against what is empirically determined to be complementary with innovation and high-performance within their industry. The frequency of complementary pairs that involve innovation range from 40 to 50% depending on whether we are talking about profit, productivity, or strategies. This result is important – as it means that innovation outcomes are statistically significant for both increased productivity and increased profit. Furthermore, innovation was found to be complementary with many organizational strategies. The complementary strategies across industries were quite different, but this was expected to occur.
Keywords: Innovation; Strategy; Complementarity; Supermodular; Submodular
JEL Classification: O31; L25; L60
1 INTRODUCTION
The purpose of this paper is to discover which organizational strategies in 12 manufacturing industries are complementary with innovation. In particular, the question we seek to address is ‘what organizational strategies are complementary with novel innovations (world-first and Canada-first)?’ Knowledge of complementarity should pave the way for creating sustainable competitive advantage because the use of a complex strategy may be difficult to imitate. In other words, competitive advantage must increase as the complexity of a firm’s strategy increases because it acts as a barrier to potential imitators (Rivkin, 2000).
∗Corresponding author. Tel.:+519 888-4567 ext. 3291; E-mail: [email protected]
196 B. P. COZZARIN AND J. C. PERCIVAL
Complementarity and organizational strategies were originally discussed by Learnedet al.
(1961). Sets of activities related to the strategy profile of the firm could lead to sustainable competitive advantage. Furthermore, strategies can behave as substitutes or complements to one another. Within the context of manufacturing, Milgrom and Roberts (1990, 1995a) and Topkis (1978, 1995a, 1995b) argued that supermodularities and complementarities lead to superior profits that contribute to competitiveness.
The existence of strategy-specific activities implies that within an industry, firms could occupy a multitude of strategic positions. Strategic group theory (Caves and Porter, 1977; Cool and Schendel, 1987; Cool and Dierickx, 1993; Fiegenbaum and Thomas, 1995) also emphasizes the same idea. If firms were analysed with respect to their activities, it could provide greater insight into strategies and their interaction with other activities. Once a firm’s strategy-specific activities and the interactions among them have been found, it may be possible to deduce why firms would move from one strategy position to another (Porter, 1996).
2 COMPLEMENTARITY LITERATURE
This section reviews recent literature that seeks to determine complementarity between orga-nizational activities.1We do not consider the traditional continuous variable case, because our
focus is on binary choices. Not only is the use of organizational strategies not a continuous measure, there are no observed input prices for activities such as team work, promoting firm reputation, collaborating with other firms, etc. Without input prices, it is impossible to use a cost or production function to determine complementarity (via an Allen-Uzawa or Morishima elasticity of substitution for instance). Fundamentally, complementarity reveals the benefits of making changes in groups. This implies that implementing a new cost saving measure may result in a negative effect, because the fit between the new method and the existing practice do not mesh. In other words, current practices may be inappropriate for effectively integrating technology or innovations.
Drakeet al.(1999) examined one of the contributing factors to the success of implementing activity-based costing. It was believed that this new costing policy should provide more infor-mation that could lead to an increase in process improvements. To that end, the authors showed complementarity between the activity-based costing and the incentive structure of the firm. If an incentive structure based on cooperation was not in place, then the effect of implementing activity-based costing was negative. Chenhall and Langsfield-Smith (1998) examined the fit between strategic priority (differentiation or low price) and human resource management poli-cies (e.g. quality systems, integration, and team-based structures) using cluster analysis. The study found that different human resource and management policies clustered with different strategic priorities. The results highlighted some management practices that were necessary for either differentiation or low price strategies to be successful.
Complementarity has seen the greatest application in the domain of dynamic capabilities (Teeceet al., 1997). Dynamic capabilities explain how to achieve and allow the firm to maintain a competitive advantage. Teeceet al.(1997) argued that a new market entrant cannot imitate a complex strategy immediately, but it will take time to piece together the strategies required to
match the incumbent. The authors stressed the path dependencies involved in attaining a com-plex strategy where many of the policies are intertwined and complementary to one another. Rivkin (2000) argued that complexity due to a high level of complementarity between strategies and internal routines (of the Nelson and Winter (1982) kind) creates a competitive advantage. He argued that due to the complexity of a problem, there can be no polynomial-time algorithm that a competitor can use to imitate an incumbent’s success. In other words, the problem being considered by the imitator is NP-complete, and all the competitor can do is to iteratively alter his strategy to be more like the incumbent. Using simulation, Rivkin (2000) showed that the majority of firms will become trapped at a local maximum, and subsequently not replicate the strategy set of the incumbent. Even the incumbent may not reach a global maximum in relation to the environment due to the complex nature of the problem (ifN is the number of variables or policies, there are 2Npossible solutions to check for an optimal policy set).
Argyres (1995) examined the success of technology strategy in two case studies involving IBM and GMC. He determined that the firm’s governance structure had to be complementary to the incentive structure in order for the strategy to be successful. The GM case demon-strated that misaligned incentives and governance structures led to failed technology strategies. Conversely, IBM implemented a cooperative structure with team bonus incentives and their technology strategies were a success. Knowledge of the type of governance structure that complements, a given type of incentive policy gave, IBM an advantage over many of its com-petitors. The lack of this knowledge was a major reason for GM’s massive losses that occurred from 1980 to 1987 until the issue was resolved (Argyres, 1995).
Wozniak (1983) examined the adoption of interrelated farming innovations; in particular, the effect of human capital on the adoption of complementary livestock machinery. Wozniak (1983) found that by augmenting the ability to learn and the capacity to adjust to disequilibria, through education and/or training, helped workers to meet the creativity and flexibility requirements of an advanced technology. He also demonstrated that the ability to concep-tualise the performance and suitability of new technology was also enhanced by education. Thus, Wozniak (1983) concluded that many sources of information and the capacity to process that information were complementary with innovation.
Ichniowski and Shaw (1995) examined business practices in production lines within the US steel industry. Their study found that many new innovative work practices were complementary with one another. Some of the complementary policies included: rigorous selection procedures, extensive indoctrination efforts, the establishment of strong norms of behaviour, and regular team meetings. The interaction effects between the various incentives and the work practices were complex and were not considered in the study, only the effect of three common clusters of variables was considered. They also found that firms with new innovative clusters of work practices performed significantly better than those using traditional work practices, and that existing management and unions were barriers to implementing new process innovations.
Athey and Schmutzler (1995) examined the relationship between product flexibility (a long-run variable representing the ability to adapt a product to make it lighter, sturdier, improve its quality, and alter its design) and process flexibility (a long-run variable representing the ability to adapt to different environments, and alter manufacturing organization based on human resource policies, managements styles, and communication channels) in an innovative environment. Using a two-stage game theoretic model, they found that product and process flexibilities were complementary. In particular, they found that implementing an innovation was complementary to increasing a firm’s research capabilities, which subsequently increased the return to both process and product flexibilities.
198 B. P. COZZARIN AND J. C. PERCIVAL
with other firms and technological institutions, legislation, norms, regulations, standards, and taxation) that could possibly be alleviated by government policy. They found that com-plementarity between innovation policies was significant. They also showed that access to qualified labour was the primary obstacle that had to be overcome for a productive innovative environment.
3 LATTICE THEORY
Lattice theory is a branch of mathematics concerning partially ordered sets (Birkoff, 1948) that has been applied by Topkis (1978) and Milgrom and Roberts (1990, 1995a, 1995b) to profit maximization problems. The structure imposed by lattice theory allows for the use of discrete variables in the optimization process, something that is not possible using conventional tools such as calculus. It is important, as it permits clear comparative static results for observed changes in strategies and internal structures of firms as optimizing responses to environmental changes (Milgrom and Roberts, 1995a). This is the underlying theory for our analysis.
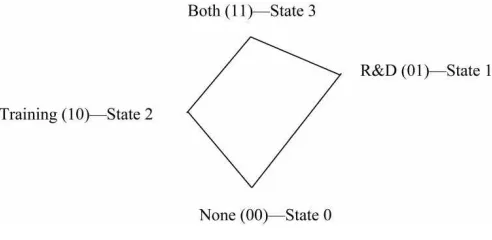
For our purposes, the nodes of the lattice will represent different organizational strategies. Consider a small example with two possible attributes: a firm that engages in training of employees, and also performs research and development. A typical firm could have none, one, or both of these attributes resulting in four possible states. If the two attributes were comple-mentary then doing both simultaneously would be ‘better’ than doing either one individually, and definitely better than doing neither. The lattice for this situation is shown in Figure 1, where vertical height is profit. From this, we can see the optimal path for a firm to follow in order to increase profits. In this example, it would be best to implement research and develop-ment simultaneously. However, if a budget constraint prevented the impledevelop-mentation of both, the optimal path would be to begin a research and development program first followed by employee training later.
Supermodularity is important for determining optimal solutions on a lattice. According to Milgrom and Roberts (1990), a function is supermodular when ‘. . .the sum of the changes in the function when several arguments are increased separately is less than the change resulting from increasing all the arguments together’ (p. 516). In essence, it is a function that exhibits the property of complementarity as increasing one or more inputs raises the return to increasing additional variables. When new technologies are adopted, there is often a mismatch between the existing routines and the structural requirements and those of the new technology (Teece,
et al., 1997). The construction of the lattice demonstrates this result as the effects from initiating change in multiple attributes simultaneously (rather than individually) moves the firm further up the lattice.2
A function is supermodular if for every pair of inputs the function is supermodular in those inputs. The sum of two or more supermodular functions is supermodular but the product is not necessarily supermodular (Topkis, 1978). These theorems are important for the decomposition of complex functions such as the profit function where there are numerous relationships between subsets of variables concerning productivity, internal costs, marketing, and labour. The theorems enable the creation of supermodular functions to demonstrate the effect of
FIGURE 1 Example lattice.
complementarity on output (Topkis, 1978; Milgrom and Roberts, 1990; 1995a; Mohnen and Roller, 2002).
4 RESEARCH DESIGN
We conductedex posthypotheses tests pertaining to innovative activity across all Canadian manufacturing sectors. We attempted to show pair-wise complementarity between a number of organizational strategies to derive an optimal set that would enhance competitive advantage from increased innovative activity.
4.1 Data
Our data came from Statistics Canada’s Survey of Innovation 1999.3 The survey probed
innovative capabilities following the ‘Oslo definition’ (OECD, 1997); firms had to have an innovation from 1997 to 1999 to be considered an ‘innovator,’even though some firms indicated that they had innovations still under development or that they were ultimately unsuccessful. Chief Executive Officers (CEOs) were asked to rate the importance of sixteen organizational strategies for their firms. They were also asked to assess the impact that new (or significantly improved) products or processes had on their firm. The CEOs were asked to describe their firm’s most important innovation and then classify it as world-first, Canada-first, or firm-first. The survey design was a random sample drawn from the population of ‘provincial enter-prises’ (firms) stratified by industry4and province. The proportion (weighted) of small (20–49
employees), medium (50–249 employees) and large (greater than 250 employees) firms was 27, 56, and 17%, respectively (a table of industry proportions is available from the authors). Firms with revenues of less than $250,000 were not included in the population and neither were those with less than 20 employees. The total sample size was 5944 with an overall response rate of 95%. The survey was mandatory, under authority of the Statistics Act (1985, Revised
200 B. P. COZZARIN AND J. C. PERCIVAL
TABLE I Factor analysis of organizational strategies.
Factor 1 – hiring Factor 3 – market Factor 4 – reputation
focus Factor 2 – R&D focus focus
Hiring new graduates
Statutes) thus explaining the high response rate. To obtain economic data, the innovation survey was linked to the plant-level 1997 Annual Survey of Manufactures (ASM). Plant-level variables from the survey of manufactures included – industry code for each firm, value of shipments (sales), total number of employees, total hours worked by production workers, total wages and salaries, total energy cost, and total material cost. The plant-level variables were aggregated to the provincial enterprise level (firm level) to enable a linkage to the innovation survey.
4.2 Variables
The dependent variable for the analysis was either profit or labour productivity. The profit measure (or more formally price-cost margin) was defined as manufacturing value added (total shipments minus the following: electricity and fuel costs, materials costs, wages and salaries) divided by total shipments. Labour productivity was defined as total shipments (in 1997 actual dollars) divided by the number of employees. For the purposes of this analysis, the natural logarithm of labour productivity was used as the dependent variable.
Question two from the survey, called ‘firm success factors’, contained 16 questions related to organizational strategies. To test for complementarity between the strategies, pair-wise comparisons were performed. However, pair-wise comparisons are constrained quickly – using the binomial coefficient, there are n
2
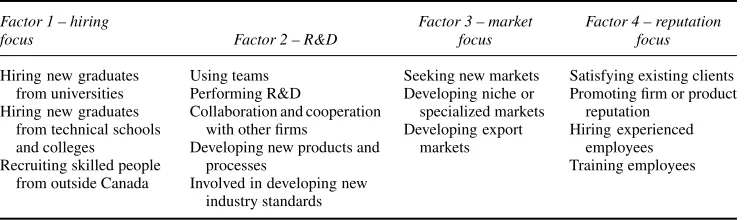
complementarity tests to conduct (wheren is the number of variables) or in our case there would be 120 comparisons. For this reason, as well as similarities between some of the survey questions, we grouped variables together. It turned out that four factors (Tab. I) were required to retain the explanatory power of the 16 variables.5 Factor 1 could be characterized as a ‘hiring focus’ factor, factor 2 as a ‘research
and development’ factor, factor 3 as a ‘market focus’ factor, and factor 4 as a combination of satisfying existing clients, promoting reputation, hiring experienced employees, and training, which we will call ‘reputation focus’ (Tab. I).
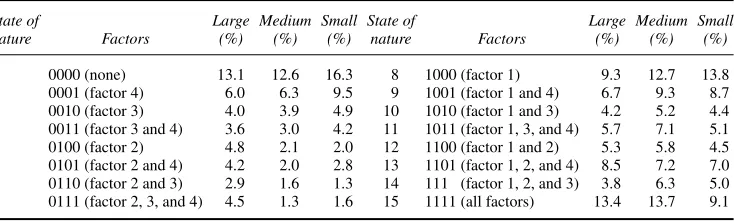
TABLE II Organizational strategies by firm size.6
State of Large Medium Small State of Large Medium Small nature Factors (%) (%) (%) nature Factors (%) (%) (%)
0 0000 (none) 13.1 12.6 16.3 8 1000 (factor 1) 9.3 12.7 13.8
1 0001 (factor 4) 6.0 6.3 9.5 9 1001 (factor 1 and 4) 6.7 9.3 8.7 2 0010 (factor 3) 4.0 3.9 4.9 10 1010 (factor 1 and 3) 4.2 5.2 4.4 3 0011 (factor 3 and 4) 3.6 3.0 4.2 11 1011 (factor 1, 3, and 4) 5.7 7.1 5.1 4 0100 (factor 2) 4.8 2.1 2.0 12 1100 (factor 1 and 2) 5.3 5.8 4.5 5 0101 (factor 2 and 4) 4.2 2.0 2.8 13 1101 (factor 1, 2, and 4) 8.5 7.2 7.0 6 0110 (factor 2 and 3) 2.9 1.6 1.3 14 111 (factor 1, 2, and 3) 3.8 6.3 5.0 7 0111 (factor 2, 3, and 4) 4.5 1.3 1.6 15 1111 (all factors) 13.4 13.7 9.1
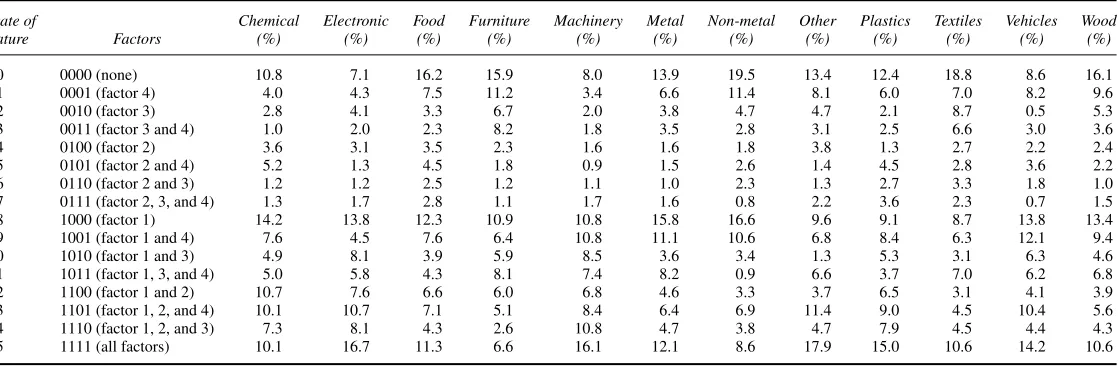
Tables II and III depict the distribution of firms by state relative to size and industry. In Table II, 16.3% of small firms have none of the four factors, whereas 13.4% and 13.7% of the large and medium firms exhibit all the factors, respectively. In Table III, the non-metal industry has the highest proportion of firms (19.5%) with no factors, whereas the other industry has the highest proportion of firms (17.9%) which exhibit all the factors. The vehicles industry is second relative to all the factor states (other than state 15), since 12.1% of firms are reliant on hiring and reputation (factors 1 and 4). The non-metal industry also has the distinction of being most reliant on factor 1 (by itself), hiring focus, and on factor 4 (by itself), reputation focus, than any other industry. The textile industry has the greatest frequency of firms (8.7%) relying solely on the market focus factor (factor 3). The chemical industry has the highest frequency of firms (3.6%) relying on the R&D factor (factor 2).
4.3 Determining Complementarity
Two or more variables are called (Edgeworth) complementary if a higher value in any variable increases the marginal returns to higher values in the remaining variables. Given a real-valued functionf on a lattice X,fis supermodular and its arguments are (Edgeworth) complements if and only if for anyx,yin X,f (x)−f (x∩y)≤f (x∪y)−f (y)wherex∩y, pronounced as ‘xmeety’, is the greatest lower bound betweenxandy, whereasx∪y, pronounced as ‘x joiny’, is the least upper bound betweenxandy(Milgrom and Roberts, 1995a).
Regression methods are the most commonly used technique for determining complementary relationships. The problem with linear regression is that a positive correlation in the unob-servables results in a positive bias in the estimate of the interaction effects (Athey and Stern, 1998). In addition, if practices are complementary in the design phase, then the interaction effect will be understated. A different procedure, and the one used in this paper to determine complementarity, is a parametric method using constrained regression. The method involves proving that the function under consideration is supermodular in each pair of elements. If true, then each pair of elements is complementary. The method is quite different from standard regression and as such does not suffer from the same limitations and possible biases.
The test for complementarity is performed by proving that the data satisfy the set of para-metric equations required for supermodularity. Normally, an assumption about the distribution of the covariance will need to be made (i.e. that it follows a Normal distribution). The com-plementarity hypothesis is then tested using a one-tailedt-test of the inequality constraint.
202
B.
P.
COZZARIN
AND
J.
C.
PERCIV
AL
TABLE III Organizational strategies by industry.7
State of Chemical Electronic Food Furniture Machinery Metal Non-metal Other Plastics Textiles Vehicles Wood nature Factors (%) (%) (%) (%) (%) (%) (%) (%) (%) (%) (%) (%)
0 0000 (none) 10.8 7.1 16.2 15.9 8.0 13.9 19.5 13.4 12.4 18.8 8.6 16.1
1 0001 (factor 4) 4.0 4.3 7.5 11.2 3.4 6.6 11.4 8.1 6.0 7.0 8.2 9.6
2 0010 (factor 3) 2.8 4.1 3.3 6.7 2.0 3.8 4.7 4.7 2.1 8.7 0.5 5.3
3 0011 (factor 3 and 4) 1.0 2.0 2.3 8.2 1.8 3.5 2.8 3.1 2.5 6.6 3.0 3.6
4 0100 (factor 2) 3.6 3.1 3.5 2.3 1.6 1.6 1.8 3.8 1.3 2.7 2.2 2.4
5 0101 (factor 2 and 4) 5.2 1.3 4.5 1.8 0.9 1.5 2.6 1.4 4.5 2.8 3.6 2.2
6 0110 (factor 2 and 3) 1.2 1.2 2.5 1.2 1.1 1.0 2.3 1.3 2.7 3.3 1.8 1.0
7 0111 (factor 2, 3, and 4) 1.3 1.7 2.8 1.1 1.7 1.6 0.8 2.2 3.6 2.3 0.7 1.5
8 1000 (factor 1) 14.2 13.8 12.3 10.9 10.8 15.8 16.6 9.6 9.1 8.7 13.8 13.4
9 1001 (factor 1 and 4) 7.6 4.5 7.6 6.4 10.8 11.1 10.6 6.8 8.4 6.3 12.1 9.4
10 1010 (factor 1 and 3) 4.9 8.1 3.9 5.9 8.5 3.6 3.4 1.3 5.3 3.1 6.3 4.6
11 1011 (factor 1, 3, and 4) 5.0 5.8 4.3 8.1 7.4 8.2 0.9 6.6 3.7 7.0 6.2 6.8
12 1100 (factor 1 and 2) 10.7 7.6 6.6 6.0 6.8 4.6 3.3 3.7 6.5 3.1 4.1 3.9
13 1101 (factor 1, 2, and 4) 10.1 10.7 7.1 5.1 8.4 6.4 6.9 11.4 9.0 4.5 10.4 5.6
14 1110 (factor 1, 2, and 3) 7.3 8.1 4.3 2.6 10.8 4.7 3.8 4.7 7.9 4.5 4.4 4.3
15 1111 (all factors) 10.1 16.7 11.3 6.6 16.1 12.1 8.6 17.9 15.0 10.6 14.2 10.6
However, two null hypotheses should be tested, one with supermodularity of the function as the null hypothesis, to test for complementarity, and one with submodularity as the null hypo-thesis, to test if the elements are substitutes. Complementarity between variables was tested by industry to determine the local industry-specific complementarities (or substitutes) that exist and those that are exhibited across industries. The same method was used by Mohnen and Roller (2002) to determine complementarities between problems associated with innovating and the probability of actually generating an innovation.
It was hypothesised that all of the organizational strategies in our data were pair-wise com-plementary with the exception of the control variables. The profit (productivity) function for a given industryjisPj =2
n−1
i=0 γijsij +εj, wherenis the number of endogenous variables. The variablessij define a set of state dummy variables representing stateiin industryj. The dummy variables are defined using binary algebra convention (e.g. state three of a four variate problem 0011, would be represented bys3j). Using the relevant function, the supermodular-ity constraints were then used as a set of restrictions on the coefficients of the variables. Let us consider an example with four variables – there are then 16 states ranging from 0000 (where none of the variables are implemented) to 1111 (where all variables are imple-mented). The complementarity conditions for the first two elements to be complementary are written as:γ8+s+γ4+s≤γ0+s+γ12+s, wheres=0,1,2,3. We can express the remaining 20 restrictions for the other five pairs of variables in a similar fashion. For the entire set to be complementary, all 24 restrictions must be satisfied. As pair-wise complementarity between any subset of variables implies supermodularity over the subset, this implies the joint testing of four inequality constraints (Mohnen and Roller, 2002). The profit function could be sub-modular, in which case the elements are substitutes. This property was tested by changing the sign of the inequalities.
Overall, two generic kinds of hypothesis tests were conducted. The first tested for strict complementarity between variable pairs by testing for supermodularity of the function as the null hypothesis. The second tested for strict substitutes by testing for submodularity of the function as the null hypothesis. These two tests determined which set of elements should be adopted simultaneously for a firm to obtain the optimal benefits and which set of elements should never be adopted simultaneously.
The first hypothesis has as the null, strict equality and for the alternative a negative inequality. That is for elements 1 and 2 in the example,
H0: −γ0+s+γ4+s+γ8+s−γ12+s =0, for alls=0,1,2,3 H1: −γ0+s+γ4+s+γ8+s−γ12+s <0, for alls=0,1,2,3
The base model was created without any of the complementarity restrictions. A constrained regression model was then estimated for each pair-wise test with the complementarity restric-tions as constraints.8A likelihood ratio (LR) was calculated to obtain the significance of the
test.9
8Note that the constrained regressions were conducted separately for each innovation type. The full sample of 5220 was used in the regressions for world-first innovations, for the Canada-first regressions, world-first innovating firms were removed leaving 4740 observations, and for the firm-first regressions, Canada-first and world-first innovators were removed leaving 3951 observations.
204 B. P. COZZARIN AND J. C. PERCIVAL
Similarly, the second hypothesis had as the null, strict equality and as the alternative a positive inequality. That is for elements 1 and 2 in the example,
H0: −γ0+s+γ4+s+γ8+s−γ12+s=0, for alls=0,1,2,3 H1: −γ0+s+γ4+s+γ8+s−γ12+s>0, for alls=0,1,2,3
This test accepts H1when the constraints are jointly positive, and the elements are therefore
strict substitutes. An LR-test was once again calculated.
There are therefore three alternatives for the relationship between a pair of elements: (i) the elements are strict complements, (ii) the elements are strict substitutes, and (iii) the elements have intermediatep-values for both tests and are neither strict complements nor strict sub-stitutes. Regressions were controlled for industry by estimating a separate model for each. This is important since the type of innovation by industry is very different. By controlling for industry, the potential bias due to the amount of variation in innovative activity and the form of innovations created should be avoided. We also controlled for the size of the firm. Relatively few large firms responded to the survey, but discrepancies due to size could lead to biased results if firm size is not incorporated as a control variable.
5 RESULTS
This section discusses the results from the constrained regressions (the full set of test results are located in Appendix A). Tests for supermodularity (complements) and submodularity (substitutes) were conducted relative to organisational strategies. For the remainder of the paper, the following terminology will be used – any reference to two complementary variables means that the supermodularity hypothesis cannot be rejected but that the submodularity hypothesis is rejected. Similarly, two variables are substitutes if the submodularity hypothesis cannot be rejected but the supermodularity hypothesis is rejected. If both the supermodularity and the submodularity hypotheses are rejected then the variables are independent.
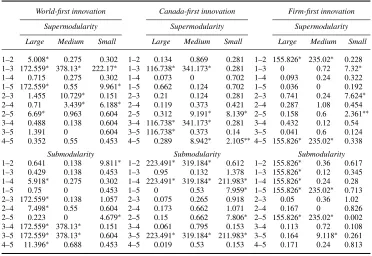
Tables IV and V show the results from the LR-tests for profit and labour productivity by firm size. If we concern ourselves with world-first innovations in Table IV first, we see that the test for submodularity (substitutes) was rejected for 10 pairs of variables. In particular, for large firms pairs 1–4 (hiring–reputation), 2–3 (R&D–market), 2–4 (R&D–reputation), 3–4 (market–world-first innovation), 3–5 (market–world-first innovation), and 4–5 (reputation– world-first innovation), are complements.10What does this mean? For example, if a large firm
exhibits a market focus and also has a world-first innovation, it will be higher on the lattice (i.e. will have higher profits) than a firm that has either one alone. The test for supermodu-larity (complementarity) was rejected 10 times for world-first innovators (Tab. IV). In terms of just large firms, factors 1–2 (hiring–R&D), 1–3 (hiring–market), 1–5 (hiring–world-first innovation), and 2–5 (R&D–world-first innovation) are substitutes. Again, one can ask what do these results mean? For the 1–5 pair-wise comparison, it means that if a firm was engaged in hiring but also produced a world-first innovation, its profits would be lower than another firm that did either one individually (the firm will be higher on the profit lattice). In other words, large firms that engage in relatively high levels of hiring activity should not try and
TABLE IV LR test statistics by size class: profit as dependent variable.11
World-first innovation Canada-first innovation Firm-first innovation
Supermodularity Supermodularity Supermodularity
Large Medium Small Large Medium Small Large Medium Small
1–2 5.008∗ 0.275 0.302 1–2 0.134 0.869 0.281 1–2 155.826∗ 235.02∗ 0.228
1–3 172.559∗ 378.13∗ 222.17∗ 1–3 116.738∗ 341.173∗ 0.281 1–3 0 0.72 7.32∗
1–4 0.715 0.275 0.302 1–4 0.073 0 0.702 1–4 0.093 0.24 0.322
1–5 172.559∗ 0.55 9.961∗ 1–5 0.662 0.124 0.702 1–5 0.036 0 0.192
2–3 1.455 10.729∗ 0.151 2–3 0.21 0.124 0.281 2–3 0.741 0.24 7.624∗
2–4 0.71 3.439∗ 6.188∗ 2–4 0.119 0.373 0.421 2–4 0.287 1.08 0.454
2–5 6.69∗ 0.963 0.604 2–5 0.312 9.191∗ 8.139∗ 2–5 0.158 0.6 2.361∗∗
3–4 0.488 0.138 0.604 3–4 116.738∗ 341.173∗ 0.281 3–4 0.432 0.12 0.54
3–5 1.391 0 0.604 3–5 116.738∗ 0.373 0.14 3–5 0.041 0.6 0.124
4–5 0.352 0.55 0.453 4–5 0.289 8.942∗ 2.105∗∗ 4–5 155.826∗ 235.02∗ 0.338
Submodularity Submodularity Submodularity 1–2 0.641 0.138 9.811∗ 1–2 223.491∗ 319.184∗ 0.612 1–2 155.826∗ 0.36 0.617
1–3 0.429 0.138 0.453 1–3 0.95 0.132 1.378 1–3 155.826∗ 0.12 0.345
1–4 5.918∗ 0.275 0.302 1–4 223.491∗ 319.184∗ 211.983∗ 1–4 155.826∗ 0.24 0.28
1–5 0.75 0 0.453 1–5 0 0.53 7.959∗ 1–5 155.826∗ 235.02∗ 0.713
2–3 172.559∗ 0.138 1.057 2–3 0.075 0.265 0.918 2–3 0.05 0.36 1.02
2–4 7.498∗ 0.55 0.604 2–4 0.173 0.662 1.071 2–4 0.167 0 0.826
2–5 0.223 0 4.679∗ 2–5 0.15 0.662 7.806∗ 2–5 155.826∗ 235.02∗ 0.002
3–4 172.559∗ 378.13∗ 0.151 3–4 0.061 0.795 0.153 3–4 0.113 0.72 0.108
3–5 172.559∗ 378.13∗ 0.604 3–5 223.491∗ 319.184∗ 211.983∗ 3–5 0.164 9.118∗ 0.261
4–5 11.396∗ 0.688 0.453 4–5 0.019 0.53 0.153 4–5 0.171 0.24 0.813
∗
Significance level of test is 1%.12
∗∗
Significance level of test is 5%.12
Source: Authors’ tabulations based on Statistics Canada, Survey of Innovation 1999.
produce a world-first innovation at the same time. The cost of hiring and innovating simul-taneously drains away profits.13Notice for Table IV that in two instances, the pair-wise tests
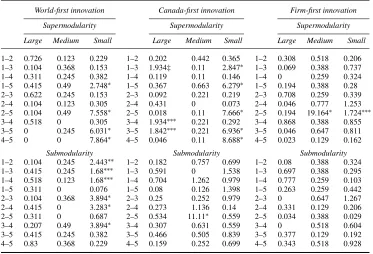
reject both supermodularity and submodularity. These two sets of variables – pairs 3–5 for large firms in the Canada-first innovation category and 1–2 for large firms in the firm-first innovation category are independent. Table V has few complementary pairs when compared with the profit LR-tests (Tab. III). Small firms in the world-first innovation category exhibit six complementary pairs; the only pair common to both profit and productivity tests is 1–2 (hiring–R&D). This complementary pair is important (in terms of statistical significance) to small firms that produce world-first innovations. Apparently, it is unimportant to medium and large firms.
To understand about the pair-wise tests, we did a frequency count of complementarities for all size classes and the three innovation types in Tables IV and V. The pair-wise complements with the highest frequency are 1–4 (hiring–reputation) with six occurrences. The second highest occurrence goes to complement pair 3–5 (market–world-first innovation) with five. Pair-wise complements 1–2 (hiring–R&D) and 2–5 (R&D –world-first innovation) each occur four times. Again, each complement pair indicates that doing activities together correlates with higher profits or profitability than doing either one alone.
11Factor 1, hiring focus; factor 2, research focus; factor 3, market focus; factor 4, reputation focus; factor 5, world-, Canada-, or firm-first innovation. Supermodularity tests for complementarity; Submodularity tests for substitutes.
12The cut off value for 1% is 2.51, for 5% is 1.94, and for 10% is 1.67 for all size classes.
206 B. P. COZZARIN AND J. C. PERCIVAL
TABLE V LR test statistics by size class: labour productivity as dependent variable.14
World-first innovation Canada-first innovation Firm-first innovation
Supermodularity Supermodularity Supermodularity
Large Medium Small Large Medium Small Large Medium Small
1–2 0.726 0.123 0.229 1–2 0.202 0.442 0.365 1–2 0.308 0.518 0.206 1–3 0.104 0.368 0.153 1–3 1.934‡ 0.11 2.847∗ 1–3 0.069 0.388 0.737
1–4 0.311 0.245 0.382 1–4 0.119 0.11 0.146 1–4 0 0.259 0.324
1–5 0.415 0.49 2.748∗ 1–5 0.367 0.663 6.279∗ 1–5 0.194 0.388 0.28
2–3 0.622 0.245 0.153 2–3 0.092 0.221 0.219 2–3 0.708 0.259 0.339
2–4 0.104 0.123 0.305 2–4 0.431 0 0.073 2–4 0.046 0.777 1.253
2–5 0.104 0.49 7.558∗ 2–5 0.018 0.11 7.666∗ 2–5 0.194 19.164∗ 1.724∗∗∗
3–4 0.518 0 0.305 3–4 1.934∗∗∗ 0.221 0.292 3–4 0.868 0.388 0.855
3–5 0 0.245 6.031∗ 3–5 1.842∗∗∗ 0.221 6.936∗ 3–5 0.046 0.647 0.811
4–5 0 0 7.864∗ 4–5 0.046 0.11 8.688∗ 4–5 0.023 0.129 0.162
Submodularity Submodularity Submodularity 1–2 0.104 0.245 2.443∗∗ 1–2 0.182 0.757 0.699 1–2 0.08 0.388 0.324
1–3 0.415 0.245 1.68∗∗∗ 1–3 0.591 0 1.538 1–3 0.697 0.388 0.295
1–4 0.518 0.123 1.68∗∗∗ 1–4 0.704 1.262 0.979 1–4 0.777 0.259 0.103
1–5 0.311 0 0.076 1–5 0.08 0.126 1.398 1–5 0.263 0.259 0.442
2–3 0.104 0.368 3.894∗ 2–3 0.25 0.252 0.979 2–3 0 0.647 1.267
2–4 0.415 0 3.283∗ 2–4 0.273 1.136 0.14 2–4 0.331 0.129 0.206
2–5 0.311 0 0.687 2–5 0.534 11.11∗ 0.559 2–5 0.034 0.388 0.029
3–4 0.207 0.49 3.894∗ 3–4 0.307 0.631 0.559 3–4 0 0.518 0.604
3–5 0.415 0.245 0.382 3–5 0.466 0.505 0.839 3–5 0.377 0.129 0.192 4–5 0.83 0.368 0.229 4–5 0.159 0.252 0.699 4–5 0.343 0.518 0.928
∗Significance level of test in 1%.15
∗∗Significance level of test in 5%.15
∗∗∗
Significance level of test in 10%.15
Source: Authors’ tabulations based on Statistics Canada, Survey of Innovation 1999.
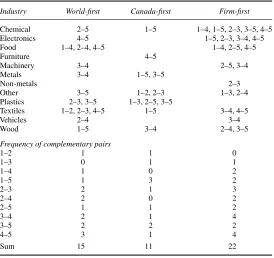
Tables VI and VII summarize the industry tests for a supermodular profit/productivity func-tion relative to the strategy variables (full test results are available in Appendix A). Because world-first innovations are the ‘most important’ from a novelty standpoint to firms (and man-agement), we will concentrate on them. For the chemical industry, we see that the pair 2–5 (R&D–world-first) is statistically significant for profit. For the electronics industry, pair 4–5 (reputation–world-first) leads to higher profit, whereas pair 3–5 (market–world-first) leads to higher labour productivity. There are no complementary pairs for productivity within the food industry, however, for profit pairs 1–4 (hiring–reputation), 2–4 (R&D–reputation), and 4–5 (reputation–world-first) are statistically significant. Variable pair 3–5 (market–world-first) has a positive effect on productivity, and is the only significant finding for the furniture industry. For the machinery industry, pair 2–5 (R&D–world-first) is statistically significant for pro-ductivity, whereas pair 3–4 (market–reputation) is statistically significant for profit. Pair 4–5 (reputation–world-first) is significant for productivity in the metal industry, whereas pair 3–4 (market–reputation) is statistically significant to profit. The only significant pair for the other industry is 3–5 (market–world-first) relative to profit. Pair 4–5 (reputation–world-first) is sig-nificant for productivity, however, pairs 2–3 (R&D–market) and 3–5 (market–world-first) are significant for profit in the plastics industry. The textiles industry contains the most com-plementary pairs of variables in the world-first category. In terms of productivity, pairs 1–2
14Factor 1, hiring; factor 2, research; factor 3, market; factor 4, reputation; factor 5, world-, Canada-, or firm-first innovation.
TABLE VI Profit–strategy complementary pairs by industry.16
Industry World-first Canada-first Firm-first
Chemical 2–5 1–5 1–4, 1–5, 2–3, 3–5, 4–5
Electronics 4–5 1–5, 2–3, 3–4, 4–5
Food 1–4, 2–4, 4–5 1–4, 2–5, 4–5
Furniture 4–5
Machinery 3–4 2–5, 3–4
Metals 3–4 1–5, 3–5
Non-metals 2–3
Other 3–5 1–2, 2–3 1–3, 2–4
Plastics 2–3, 3–5 1–3, 2–5, 3–5
Textiles 1–2, 2–3, 4–5 1–5 3–4, 4–5
Vehicles 2–4 3–4
Wood 1–5 3–4 2–4, 3–5
Frequency of complementary pairs
1–2 1 1 0
1–3 0 1 1
1–4 1 0 2
1–5 1 3 2
2–3 2 1 3
2–4 2 0 2
2–5 1 1 2
3–4 2 1 4
3–5 2 2 2
4–5 3 1 4
Sum 15 11 22
Source: Authors’ tabulations based on Statistics Canada, Survey of Innovation 1999.
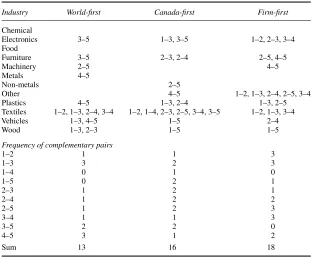
(hiring–R&D), 1–3 (hiring–market), 2–4 (R&D–reputation), and 3–4 (market–reputation) are statistically significant. In terms of profit, pairs 1–2 (hiring–R&D), 2–3 (R&D–market), and 4–5 (reputation–world-first) are crucial. For vehicles, variable pairs 1–3 (hiring–market) and 4–5 (reputation–world-first) impact productivity; pair 2–4 (R&D–reputation) impacts profit. The statistically significant factors for the wood industry include: pairs 1–3 (hiring–market) and 2–3 (R&D–market) for productivity; 1–5 (hiring–world-first) for profit. The most common complementary pair, occurring three times for profit and productivity (please see the bottom of Tabs. IX and X) is 4–5 (reputation–world-first). Pair 1–3 (hiring–market) is statistically significant as well since it was significant three times for productivity.
Upon examination, Tables VI and VII show a wide variation in complements. Yet, some are common to both profit and productivity. In particular, there are eight common pairs – 1–2 (hiring–R&D), 1–3 (hiring–market, occurs three times), 2–3 (R&D–market), 2–4 (R&D–reputation), and 3–4 (market–reputation, occurs twice). Thus, in general, these eight pairs are statistically significant for overall firm performance. Of special importance are the hiring–market focus pair and the market–reputation pair. It should be noted that the ‘reputa-tion’ factor includes satisfying existing clients, promoting firm reputation, hiring experienced employees, and training.
One interesting observation can be gleaned from Tables VI and VII and it relates to the frequency of complementary pairs that involve a new innovation regardless of whether it is a world-, Canada-, or firm-first. The total number of complementary pairs in Table VI is 48, and
208 B. P. COZZARIN AND J. C. PERCIVAL
TABLE VII Labour productivity–strategy complementary pairs by industry.17
Industry World-first Canada-first Firm-first
Chemical
Electronics 3–5 1–3, 3–5 1–2, 2–3, 3–4
Food
Furniture 3–5 2–3, 2–4 2–5, 4–5
Machinery 2–5 4–5
Metals 4–5
Non-metals 2–5
Other 4–5 1–2, 1–3, 2–4, 2–5, 3–4
Plastics 4–5 1–3, 2–4 1–3, 2–5
Textiles 1–2, 1–3, 2–4, 3–4 1–2, 1–4, 2–3, 2–5, 3–4, 3–5 1–2, 1–3, 3–4
Vehicles 1–3, 4–5 1–5 2–4
Wood 1–3, 2–3 1–5 1–5
Frequency of complementary pairs
1–2 1 1 3
1–3 3 2 3
1–4 0 1 0
1–5 0 2 1
2–3 1 2 1
2–4 1 2 2
2–5 1 2 3
3–4 1 1 3
3–5 2 2 0
4–5 3 1 2
Sum 13 16 18
Source: Authors’ tabulations based on Statistics Canada, Survey of Innovation 1999.
in Table VII, it is 47. The frequency of complementary pairs involving innovation are 24 (50%) and 19 (40.4%), respectively. This result shows that innovation outcomes are strongly correlated with higher productivity and higher profits. But, more importantly, innovation is complementary to many of the firm’s organizational strategies. The complementary strategies across industries are quite different and this is to be expected. It is the finding that innovation is correlated with firm performance that is heartening to verify.
According to Milgrom and Roberts (1995a), we would expect that complementarity between advanced manufacturing technologies and high-performance business practices was most prevalent in high-technology industries. This study obviously does not examine the use of advanced manufacturing technologies, but more generic strategies put in place by firms in the normal course of doing business. Although, the survey results are indicative of a fairly high level of innovative activity with 59% of firms reporting that they undertake R&D; interestingly, 20% of non-innovators reported an R&D program, whereas over 90% of world-first innovators did so (Cozzarin, 2004). Furthermore, 8.6% of firms report having a world-first innovation, 15% have a Canada-first innovation, 58% have a firm-first innovation, and 19% report no innovations (Cozzarin, 2004). Still the results of the frequency of pair-wise complementarity, while controlling for industry (Tabs. V and VI), are surprising. Pair-wise complementarity of the organizational strategies (strategies) occurred 20 times for the textile industry. The next highest occurrence was 11 times for the electronics industry.
6 CONCLUSION
Milgrom and Roberts (1995a) made the point that the different characteristics of modern manufacturing, are often highly complementary. This complementarity, coupled with the nat-ural tendency to change organizational attributes one at a time, makes the transition from one paradigm to another particularly difficult. Strong complementarities imply that to be suc-cessful, change must be implemented simultaneously along a number of related dimensions. Organizations that adopt only one or two key components of a new organizational paradigm may fail simply by virtue of this complementarity. Therrien and Leonard (2003) also argued that using several human resource management practices helps to overcome potential prob-lems that one practice could not prevent on its own. This study is one of only two (known to the authors) that examine innovation within the context of complementary strategies, innovation outcomes, and performance.
The frequency of complementary pairs that involve innovation range from 40 to 50% depending on whether we are talking about profit, productivity, or strategies. This result shows that innovation outcomes are correlated with both increased productivity and increased profit. But, more importantly, innovation is complementary to many organizational strate-gies. The complementary strategies across industries are quite different and this is to be expected. It is the finding that innovation is tied to firms’ performance that is robust and meaningful.
Our results indicate that managers may use complementarities to plan the creation and implementation of innovations in their firms and/or of how to gain efficiencies from their current set of product and process innovations. Our study provides empirical insight into why some firms have world-first innovations based on the strategies they follow. Managers could compare their own firm’s emphasis on particular strategies and goals against what was empirically found to be complementary with innovation and high-performance within their industry. However, some caveats are in order. Our results are tentative and probably not quite ‘practitioner ready’, because they are static in nature. This research is really a first step along the road to understanding the (potential) importance of complementarities among firm strategies. A better picture would emerge if longitudinal innovation data were available. This appears unlikely to occur since the latest (2003) innovation survey from Statistics Canada is of the service sector.
Acknowledgements
Seed funding for this research came from Social Sciences and Humanities Research Council of Canada, Standard Research Grant, ‘Advanced Manufacturing Technology and Organizational Complementarity’. Generous financial support was also provided by Marketplace Innovation Division, Industry Canada. Thanks to Science Innovation and Electronic Information Division, Statistics Canada, for granting access to the survey. Thanks as well to Jock McKay and Greg Bennett, Department of Statistics and Actuarial Science, University of Waterloo for brainstorming with us. Can Le, Pierre Therrien, and the staff of SIEID provided helpful comments on an earlier draft of this manuscript. The usual disclaimer applies.
References
Argyres, N.S. (1995) Technology Strategy, Governance Structure and Interdivisional Coordination.Journal of Economic Behavior and Organization,28(3), 337–358.
210 B. P. COZZARIN AND J. C. PERCIVAL
Athey, S. and Schmutzler, A. (1995) Product and Process Flexibility in an Innovative Environment.RAND Journal of Economics,26(4), 557–574.
Birkoff, G. (1948)Lattice Theory.Rhode Island: American Mathematical Society.
Caves, R.E. and Porter, M.E. (1977) From Entry Barriers to Mobility Barriers.Quarterly Journal of Economics,91, 241–261.
Chenhall, R.H. and Langfield-Smith, K. (1998) The Relationship Between Strategic Priorities, Management Tech-niques and Management Accounting: An Empirical Investigation Using a Systems Approach.Accounting Organizations and Society,23(3), 243–264.
Cool, K. and Dierickx, I. (1993) Rivalry, Strategic Groups and Firm Profitability.Strategic Management Journal,14, 47–59.
Cool, K. and Schendel, D.E. (1987) Strategic Group Formation and Performance: The Case of the U.S. Pharmaceutical Industry.Management Science,33, 1102–1124.
Cozzarin, B.P. (2004) Innovation Quality and Manufacturing Firms’ Performance in Canada.Economics of Innovation and New Technology,13(3), 199–216.
Crepon, B., Duguet, E. and Mairesse, J. (1998) Research, Innovation and Productivity: An Econometric Analysis at the Firm Level.Economics of Innovation and New Technology,7, 115–158.
Drake, A.R., Haka, S.F. and Ravenscroft, S.P. (1999) Cost System and Incentive Structure Effects on Innovation, Efficiency and Profitability in Teams.The Accounting Review,74(3), 323–345.
Evangelista, R. (2000). Sectoral Patterns of Technological Change in Services.Economics of Innovation and New Technology,9, 183–221.
Evangelista, R., Perani, G.et al.(1997). Nature and Impact of Innovation in Manufacturing Industry: Some Evidence from the Italian Innovation Survey.Research Policy,26, 521–536.
Fiegenbaum, A. and Thomas, H. (1995) Strategic Groups as Reference Groups: Theory, Modeling and Empirical Examination of Industry and Competitive Strategy.Strategic Management Journal,16, 461–476.
Ichniowski, C. and Shaw, K. (1995) Old Dogs and New Tricks: Determinants of the Adoption of Productivity-Enhancing Work Practices. Brookings Papers: Microeconomics, 1995, 1–55.
Kleinknecht, A. and Mohnen, P. (eds) (2002)Innovation and Firm Performance.Hampshire, UK: Palgrave. Klomp, L. and van Leeuwen, G. (2001). Linking Innovation and Firm Performance: A New Approach.International
Journal of the Economics of Business,8(3), 343–364.
Laursen, K. and Mahnke, V. (2001) Knowledge Strategies, Firm Types, and Complementarity in Human-Resource Practices.Journal of Management and Governance,5(1), 1–27.
Learned, E.P., Christensen, C.R., Andrews, K.R. and Guth, W.D. (1961)Business Policy: Text and Cases.Homewood, IL: Irwin.
Mairesse, J. and Mohnen, P. (2002) Accounting for Innovation and Measuring Innovativeness: An Illustrative Framework and an Application.American Economic Review,92(2), 226–230.
Milgrom, P. and Roberts, J. (1990) The Economics of Modern Manufacturing: Technology, Strategy and Organization. American Economic Review,80(3), 511–528.
Milgrom, P. and Roberts, J. (1995a) Complementarities and Fit: Strategy, Structure, and Organizational-Change in Manufacturing.Journal of Accounting Economics,19(2–3), 179–208.
Milgrom, P. and Roberts, J. (1995b) The Economics of Modern Manufacturing: Reply.American Economic Review, 85(4), 997–999.
Mohnen, P. and Roller, L.H. (2002) Complementarities in Innovation Policy. CIRANO, in press.
Nelson, R.R. and Winter, S.G. (1982)An Evolutionary Theory of Economic Change.Cambridge, MA: Harvard University Press.
OECD (1997) Proposed Guidelines for Collecting and Interpreting Technological Innovation Data. Paris: Oslo Manual.
Porter, M.E. (1996) What is Strategy?Harvard Business Review,74(6): 61–78.
Rivkin, J.W. (2000) Imitation of Complex Strategies.Management Science,46(6), 824–844.
Soni, P.K., Lilien, G.L. and Wilson, D.T. (1993) Industrial Innovation and Firm Performance: A Re-conceptualization and Exploratory Structural Equation Analysis. International Journal of Research in Marketing, 10(4), 365–380.
Stockdale, B. (2002) UK Innovation Survey 2001.Economic Trends,580, 36–42.
Teece, D.J., Pisano, G. and Shuen, A. (1997) Dynamic Capabilities and Strategic Management.Strategic Management Journal,18(7), 509–533.
Therrien, P. and Leonard, A. (2003) Empowering Employees: A Route to Innovation, Statistics Canada, Human Resources Development Canada. August, Catalogue no. 71–584-MIE.
Topkis, D.M. (1978) Minimizing a Submodular Function on a Lattice. Operations Research, 26(2), 305–321.
Topkis, D.M. (1995a) Comparative Statics of the Firm.Journal of Economic Theory,67(2), 370–401.
Topkis, D.M. (1995b) The Economics of Modern Manufacturing: A Comment.American Economic Review,85(4), 991–996.
APPENDIX A: DESCRIPTION OF LR TESTS FOR SUBMODULARITY AND SUPERMODULARITY
212
B.
P.
COZZARIN
AND
J.
C.
PERCIV
AL
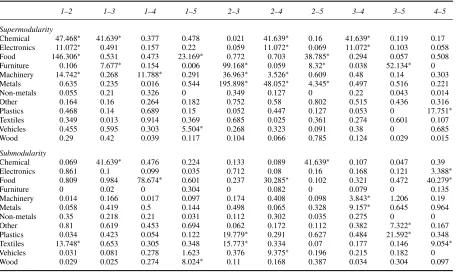
TABLE A1 LR test statistics world-first innovation by industry: profit as dependent variable.18
1–2 1–3 1–4 1–5 2–3 2–4 2–5 3–4 3–5 4–5
Supermodularity
Chemical 47.468∗ 41.639∗ 0.377 0.478 0.021 41.639∗ 0.16 41.639∗ 0.119 0.17
Electronics 11.072∗ 0.491 0.157 0.22 0.059 11.072∗ 0.069 11.072∗ 0.103 0.058
Food 146.306∗ 0.531 0.473 23.169∗ 0.772 0.703 38.785∗ 0.294 0.057 0.508
Furniture 0.106 7.677∗ 0.154 0.006 99.168∗ 0.059 8.32∗ 0.038 52.134∗ 0
Machinery 14.742∗ 0.268 11.788∗ 0.291 36.963∗ 3.526∗ 0.609 0.48 0.14 0.303
Metals 0.635 0.235 0.016 0.544 195.898∗ 48.052∗ 4.345∗ 0.497 0.516 0.221
Non-metals 0.055 0.21 0.326 0 0.349 0.127 0 0.22 0.043 0.014
Other 0.164 0.16 0.264 0.182 0.752 0.58 0.802 0.515 0.436 0.316
Plastics 0.468 0.14 0.689 0.15 0.052 0.447 0.127 0.053 0 17.751∗
Textiles 0.349 0.013 0.914 0.369 0.685 0.025 0.361 0.274 0.601 0.107
Vehicles 0.455 0.595 0.303 5.504∗ 0.268 0.323 0.091 0.38 0 0.685
Wood 0.29 0.42 0.039 0.117 0.104 0.066 0.785 0.124 0.029 0.015
Submodularity
Chemical 0.069 41.639∗ 0.476 0.224 0.133 0.089 41.639∗ 0.107 0.047 0.39
Electronics 0.861 0.1 0.099 0.035 0.712 0.08 0.16 0.168 0.121 3.388∗
Food 0.809 0.984 78.674∗ 0.601 0.237 30.285∗ 0.102 0.321 0.472 40.279∗
Furniture 0 0.02 0 0.304 0 0.082 0 0.079 0 0.135
Machinery 0.014 0.166 0.017 0.097 0.174 0.408 0.098 3.843∗ 1.206 0.19
Metals 0.058 0.419 0.5 0.144 0.498 0.065 0.328 9.157∗ 0.645 0.964
Non-metals 0.35 0.218 0.21 0.031 0.112 0.302 0.035 0.275 0 0
Other 0.81 0.619 0.453 0.694 0.062 0.172 0.112 0.382 7.322∗ 0.167
Plastics 0.034 0.423 0.054 0.122 19.779∗ 0.291 0.627 0.484 21.592∗ 0.348
Textiles 13.748∗ 0.653 0.305 0.348 15.773∗ 0.334 0.07 0.177 0.146 9.054∗
Vehicles 0.031 0.081 0.278 1.623 0.376 9.375∗ 0.196 0.215 0.182 0
Wood 0.029 0.025 0.274 8.024∗ 0.11 0.168 0.387 0.034 0.304 0.097
∗Denotes level of significance is 1%.
†Denotes level of significance is 5%. ‡Denotes level of significance is 10%.
Source: Authors’ tabulations based on Statistics Canada, Survey of Innovation 1999.
ORGANISA
TION
AL
STRA
TEGIES
AND
INNO
V
A
TION
213
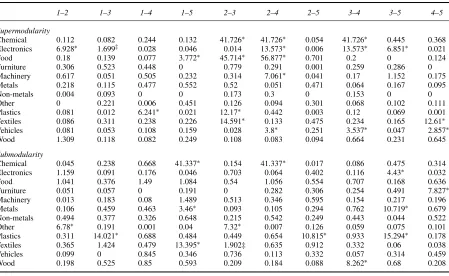
1–2 1–3 1–4 1–5 2–3 2–4 2–5 3–4 3–5 4–5
Supermodularity
Chemical 0.112 0.082 0.244 0.132 41.726∗ 41.726∗ 0.054 41.726∗ 0.445 0.368
Electronics 6.928∗ 1.699‡ 0.028 0.046 0.014 13.573∗ 0.006 13.573∗ 6.851∗ 0.021
Food 0.18 0.139 0.077 3.772∗ 45.714∗ 56.877∗ 0.701 0.2 0 0.124
Furniture 0.306 0.523 0.448 0 0.779 0.291 0.001 0.259 0.286 0
Machinery 0.617 0.051 0.505 0.232 0.314 7.061∗ 0.041 0.17 1.152 0.175
Metals 0.218 0.115 0.477 0.552 0.52 0.051 0.471 0.064 0.167 0.095
Non-metals 0.004 0.093 0 0 0.173 0.3 0 0.153 0 0
Other 0 0.221 0.006 0.451 0.126 0.094 0.301 0.068 0.102 0.111
Plastics 0.081 0.012 6.241∗ 0.021 12.17∗ 0.442 0.003 0.12 0.069 0.001
Textiles 0.086 0.311 0.238 0.226 14.591∗ 0.133 0.475 0.234 0.165 12.61∗
Vehicles 0.081 0.053 0.108 0.159 0.028 3.8∗ 0.251 3.537∗ 0.047 2.857∗
Wood 1.309 0.118 0.082 0.249 0.108 0.083 0.094 0.664 0.231 0.645
Submodularity
Chemical 0.045 0.238 0.668 41.337∗ 0.154 41.337∗ 0.017 0.086 0.475 0.314
Electronics 1.159 0.091 0.176 0.046 0.703 0.064 0.402 0.116 4.43∗ 0.032
Food 1.041 0.376 1.49 1.084 0.54 1.056 0.554 0.707 0.168 0.636
Furniture 0.051 0.057 0 0.191 0 0.282 0.306 0.254 0.491 7.827∗
Machinery 0.013 0.183 0.08 1.489 0.513 0.346 0.595 0.154 0.217 0.196
Metals 0.106 0.459 0.463 3.46∗ 0.093 0.105 0.294 0.762 10.719∗ 0.679
Non-metals 0.494 0.377 0.326 0.648 0.215 0.542 0.249 0.443 0.044 0.522
Other 6.78∗ 0.191 0.001 0.04 7.32∗ 0.007 0.126 0.059 0.075 0.101
Plastics 0.311 14.021∗ 0.688 0.484 0.449 0.654 10.815∗ 0.933 15.294∗ 0.178
Textiles 0.365 1.424 0.479 13.395∗ 1.902‡ 0.635 0.912 0.332 0.06 0.038
Vehicles 0.099 0 0.845 0.346 0.736 0.113 0.332 0.057 0.314 0.459
Wood 0.198 0.525 0.85 0.593 0.209 0.184 0.088 8.262∗ 0.68 0.208
∗Denotes level of significance is 1%.
†Denotes level of significance is 5%. ‡Denotes level of significance is 10%.
Source: Authors’ tabulations based on Statistics Canada, Survey of Innovation 1999.
214
B.
P.
COZZARIN
AND
J.
C.
PERCIV
AL
TABLE A3 LR test statistics firm-first innovation by industry: profit as dependent variable.20
1–2 1–3 1–4 1–5 2–3 2–4 2–5 3–4 3–5 4–5
Supermodularity
Chemical 0.138 1.34 0.009 0 0.011 0.03 3.603∗ 0.615 0 0.004
Electronics 0.017 0.445 0.036 0 0.007 0.175 0.054 0 0.062 0.015
Food 0.269 1.556 0.32 0.541 0.725 35.323∗ 0.334 0.613 36.821∗ 0.936
Furniture 0.25 0.019 0.371 0.003 0.102 0.56 0.038 0.41 0.153 0.206
Machinery 1.016 0.129 6.589∗ 1.426 0.432 1.07 0.389 0.117 0.898 0.744
Metals 16.924∗ 22.285∗ 8.615∗ 0.149 0.352 3.445∗ 0.674 0.325 1.001 3.759∗
Non-metals 0.029 0.071 0.297 0.169 0.349 3.196∗ 0.023 0.009 0 0.448
Other 0.316 0.174 0.025 0.034 0.559 0.015 9.649∗ 0.209 0.056 7.464∗
Plastics 14.877∗ 0.02 0.697 0.435 0.045 0.049 0.089 0.118 0.172 0.353
Textiles 0.534 0.046 0.177 0.334 0.476 0.068 0.563 0.535 0.607 0.341
Vehicles 7.376∗ 8.671∗ 0.339 0.3 0.064 0.2 0.191 0.377 0.162 0.108
Wood 0.705 16.463∗ 0.18 0.09 0.262 0.162 0.13 0.05 0.032 12.227∗
Submodularity
Chemical 0.6 0 35.321∗ 35.321∗ 35.321∗ 0.36 0 0.011 2.33† 35.321∗
Electronics 0.661 0.043 0.042 4.823∗ 4.823∗ 0.021 0.054 3.046∗ 0 4.823∗
Food 1.099 0.623 1.765‡ 0.706 0.472 0.555 33.115∗ 1.301 0.52 85.171∗
Furniture 0.007 0.013 0 0.345 0 0.016 0.578 0.017 0.241 0.553
Machinery 0.578 0.363 0.331 0.293 0.375 0.821 1.806‡ 2.688∗ 0.034 1.191
Metals 0.167 0.484 0.552 0.979 0.149 0.074 0.138 1.062 0.265 17.001∗
Non-metals 0.196 0.202 0.092 0 1.943† 0.257 0.194 0.454 0.271 0.158
Other 0.123 9.267∗ 0.021 0.522 0 9.273∗ 0.233 0.711 1.378 9.873∗
Plastics 0.176 0.561 0.028 0.011 0.323 0.465 0.111 0.54 0.615 0.086
Textiles 0.395 1.012 0.615 0.295 0.398 0.567 0.131 12.487∗ 0.49 11.523∗
Vehicles 0.012 0.228 0.301 0.337 0.383 0.048 0.046 2.793∗ 0.202 0.42
Wood 0.376 0.027 0.231 0.897 0.121 10.945∗ 0.718 0.057 10.123∗ 6.605∗
∗
Denotes level of significance is 1%.
†Denotes level of significance is 5%. ‡Denotes level of significance is 10%.
Source: Authors’ tabulations based on Statistics Canada, Survey of Innovation 1999.
ORGANISA
TION
AL
STRA
TEGIES
AND
INNO
V
A
TION
215
1–2 1–3 1–4 1–5 2–3 2–4 2–5 3–4 3–5 4–5
Supermodularity
Chemical 0.418 0.252 0.069 0.321 0.275 0.412 0.412 0.069 0.137 0
Electronics 0.26 0.208 0.052 0.061 0.121 0.121 0.294 0.009 0.069 0.035
Food 0.421 0.181 0 0.12 0.542 0.301 5.539∗ 0.181 0.06 0
Furniture 0.121 0.191 0.217 0.026 0.159 0.191 0.421 0.223 0.121 0
Machinery 0.146 0.291 0.55 0.404 0.113 0.226 0.032 0.016 0.323 0.016
Metals 0.093 0.696 0.209 0.279 0.325 0.418 1.648 0.58 1.439 0.255
Non-metals 0.674 0.846 0.639 0.052 0.639 0.795 0.069 1.106 0.225 0.052
Other 0.054 0.008 0.124 0.129 0.084 0.018 1.901‡ 0.117 1.583 1.533
Plastics 0.032 0.079 0.238 0 0.079 0.079 0 0.032 0.016 0
Textiles 0.095 0 0.38 7.593∗ 0.569 0.19 0.095 0.047 0.332 45.034∗
Vehicles 0.611 0.356 20.562∗ 0.581 0.24 0.298 0.304 0.082 2.771∗ 0.386
Wood 0.322 0.787 33.467∗ 0.072 0.322 0.072 21.525∗ 0.322 0.751 0.501
Submodularity
Chemical 0.235 0.298 0.664 0.137 0.252 0.092 0.023 0.344 0.183 0.229
Electronics 0.095 0.017 0.087 0.606 0.286 0.078 0.113 0.294 10.8∗ 0.268
Food 0.361 0.421 1.024 0.06 0.06 0.12 0.06 0 0 0.301
Furniture 0.102 0.204 0.153 0.51 0.045 0.045 0 0.121 6.491∗ 0
Machinery 0.129 0.728 0.032 0.146 0.307 0.016 1.828‡ 0.485 0.275 0.081
Metals 0.302 0.279 0.789 0.975 0.766 0.023 0.348 0.696 0.255 10.33∗
Non-metals 0.95 0.76 0.967 0.121 0.967 0.846 0 0.449 0 0
Other 0.239 0.161 0.027 0.023 0.82 1.074 0.095 0.638 0.052 0.117
Plastics 0 0.127 0.032 0.143 0.143 0.016 1.156 0.269 0.444 5.956∗
Textiles 2.705∗ 46.03∗ 0.285 0.522 0.047 45.176∗ 0.237 40.336∗ 0.19 0.949
Vehicles 0.189 47.902∗ 0.347 0.018 0.182 0.094 0.201 0.313 0.265 14.814∗
Wood 0.322 34.861∗ 0.072 0.465 21.989∗ 0.215 0.036 0.036 0.036 0.036
∗
Denotes level of significance is 1%.
†Denotes level of significance is 5%. ‡Denotes level of significance is 10%.
Source: Authors’ tabulations based on Statistics Canada, Survey of Innovation 1999.
216
B.
P.
COZZARIN
AND
J.
C.
PERCIV
AL
TABLE A5 LR test statistics Canada-first innovation by industry: labour productivity as dependent variable.22
1–2 1–3 1–4 1–5 2–3 2–4 2–5 3–4 3–5 4–5
Supermodularity
Chemical 0 0.142 0.047 0.024 0 0.024 0.331 0.402 0.521 0.237
Electronics 0.147 0.35 0.147 1.372 0.212 0 0 0.111 0 0
Food 0.415 0.178 0.178 0.119 0.356 0.119 0.119 0.712 0.059 0
Furniture 39.45∗ 0.165 0.14 0 68.396∗ 0.121 0 0.172 70.432∗ 0
Machinery 0.552 0.097 0.049 0.504 0.016 2.973∗ 0.032 0.049 10.982∗ 0.195
Metals 9.2∗ 0.437 1.012 0.345 9.062∗ 0.667 9.568∗ 0.782 0.023 0.207
Non-metals 0 0.158 0.158 0.544 1.683‡ 0.719 0.123 1.841‡ 0.666 0
Other 0 0 0 0.481 0 0.015 0.496 0 0.617 0.286
Plastics 0.835 0 0 0.047 0.047 0.158 0.016 0.095 0.016 0
Textiles 0.715 0.429 0.524 50.591∗ 0.667 0.048 0.429 0.81 0 0.286
Vehicles 17.541∗ 4.791∗ 5.215∗ 0.058 0 6.548∗ 18.571∗ 0.848 0 1.426
Wood 0.475 0.073 16.476∗ 0.146 0.037 0.511 19.544∗ 15.124∗ 1.352 7.452∗
Submodularity
Chemical 0.153 0.153 0.611 0.025 0.153 0.127 0.229 0.153 0.255 0.076
Electronics 0.138 2.694∗ 0.354 0.452 0.59 0.177 0.236 0.354 48.186∗ 0.079
Food 0.378 0.808 0.846 0.173 8.077∗ 0.891 0.282 0.013 0.032 0.442
Furniture 0.18 0.359 0.097 0.56 38.383∗ 64.193∗ 0.152 0.553 1.659 0.256
Machinery 0.097 0.892 0.039 0.485 0.194 14.532∗ 0.504 0.601 10.942∗ 0.155
Metals 0.666 0.384 0.231 0 0.051 0.359 16.418∗ 0.589 1.562 0.128
Non-metals 1.242 0.926 1.458 1.045 1.478 1.498 6.701∗ 0.867 0.099 0.355
Other 0.478 0.067 0 0.015 0.007 0.244 0.355 0.128 0.052 24.577∗
Plastics 0.139 10.633∗ 0.751 0.477 0.034 8.84∗ 0.267 0.954 0.819 0.687
Textiles 37.126∗ 0.206 37.332∗ 0.206 36.561∗ 0.309 9.513∗ 36.406∗ 3.188∗ 0.257
Vehicles 0.196 0.104 1.244 4.642∗ 0.697 0.32 0.859 0.15 0.701 0.266
Wood 0.955 0.688 0.841 1.987† 1.032 0.382 0.268 0.038 0.764 1.376
∗
Denotes level of significance is 1%.
†Denotes level of significance is 5%. ‡Denotes level of significance is 10%.
Source: Authors’ tabulations based on Statistics Canada, Survey of Innovation 1999.