ANALYSIS
Costing an international public good: the case of the Baltic
Sea
Agnieszka Markowska
a,b,*, Tomasz Z
:
ylicz
a aWarsaw Ecological Center,Warsaw Uni6ersity,Warsaw,PolandbMinistry of En6ironment,Warsaw,Poland
Received 17 March 1997; received in revised form 3 November 1998; accepted 2 December 1998
Abstract
The paper discusses an economically efficient and internationally equitable provision of a specific public good. The good in question, the Baltic Sea, satisfies a number of needs, but economic values implied may be different in various countries polluting and using the Sea. The level of eutrophication has been identified as a key characteristic of the Baltic Sea relevant for its value. The Chander – Tulkens model of cost-sharing is used to determine a hypothetical allocation of abatement costs across the countries around the sea. The application of the model is based on estimates of national abatement costs as well as national willingness to pay for reduced eutrophication. Estimating willingness to pay in a collection of countries (some of which undergo a transition from centrally planned systems) has been the main challenge of this study. The results were derived from a coordinated series of contingent valuation surveys in Lithuania, Poland and Sweden, combined with benefit transfer studies to cover the rest of the region. Predictions of cost-sharing schemes obtained from the Chander – Tulkens model are confronted with actual data on abatement expenditures and international assistance. Several recommendations on how to optimize the Baltic-wide programmes conclude the paper. © 1999 Elsevier Science B.V. All rights reserved.
Keywords:Contingent valuation method; Cost-effectiveness; Equity; Eutrophication; Helsinki Convention on the Protection of the Baltic Sea Marine Environment; International cooperation; Public good
1. The Baltic Sea as a public good
The purpose of this paper is to discuss an economically efficient and internationally equi-table provision of a specific public good. To be considered ‘public’, a good has to meet two condi-tions: (1) the non-exclusion, and (2) the non-ri-valry principles. The former holds when it is not
Abbre6iations: CVM, Contingent Valuation Method; DC, dichotomous-choice question in CVM survey (e.g. would you be willing to pay a specified amount?); HELCOM, Helsinki Commission; JCP, Joint Comprehensive Environmental Ac-tion Programme; OE, open-ended format quesAc-tion in CVM survey (e.g. how much would you be willing to pay?); PPP, purchasing power parity.
* Corresponding author.
possible to exclude anyone from using the good once its supply has been provided. The latter holds if using the good by one agent does not preclude using it by another agent. A typical problem with a public good is that agents have incentives not to pay for its supply expecting to benefit from having the good been provided by others. As a result, the good will be undersupplied unless a mechanism is created to let agents reveal their preferences and pay for its provision accordingly.
The Baltic Sea possesses some characteristics of a public good. The benefits derived from the Sea include existence values, the value of services pro-vided by marine ecosystems, as well as direct use values such as recreation and fisheries. All of them depend on the state of the Sea. Simulta-neously, countries may derive benefits from the Sea without interfering with interests of their neighbors, at least for some types of benefits (this certainly does not apply to fisheries). Thus one may expect to observe typical ‘free-riding’ be-haviour with respect to the provision of these benefits, i.e. with respect to the protection of the Sea.
To overcome this market failure countries have sought institutional arrangements for a concerted action to allocate a sufficient effort towards a Baltic clean-up. In 1974 the Helsinki Convention on the Protection of the Marine Environment in the Baltic Sea Area was signed. In 1992, in Helsinki again, the Baltic countries signed a new, enhanced and more stringent convention which will supersede the previous one.
There are ten signatories to the (original) Con-vention presently. Nine of them, Finland, Sweden, Denmark, Germany, Poland, Russia, Lithuania, Latvia and Estonia, are coastal countries with immediate stakes in the improved quality of the Sea (the tenth signatory is the European Union). Norway is interested in the state of the Sea since a part of its southern coast is adjacent to Skager-rak where the Baltic Sea waters meet the North Sea. Four other countries, The Czech Republic, Slovakia, Ukraine and Belarus, belong to the Baltic drainage basin partially, but they are not connected to the Sea and thus may not derive tangible benefits from it.
The state of the Baltic Sea is characterized by many variables, which are shaped by both natural processes and economic activities. Eutrophication, i.e. excessive supply of nutrients such as phospho-rus and nitrogen — originating mainly from inland activities — has been identified as the principal cause of the environmental degradation of the Baltic Sea and its coast (Sanden and Rahm, 1991; Wulff and Niemi, 1992). The discharges of phos-phorus (P) and nitrogen (N) had increased until the 1980s when they stabilized at a level several times higher than in the first half of the century. They are decreasing now, although at a pace which — if sustained — can bring visible improve-ments but in a very distant future.
A large margin of uncertainty affects estimates of the total loads entering the Sea. In the first compilation (HELCOM, 1987), 528 000 t N and 48 500 t P were adopted as lower bounds for the early 1980s. The most recent total load estimates (HELCOM, 1996, pp. 20 – 26) are approximately 940 000 t N and 38 000 t P in 1992. Thus nitrogen discharges are still very high (and possibly grow-ing), while those for phosphorus are lower.
‘‘Forward to 1950’’ was suggested as a target for restoring the Baltic to a satisfactory condition. To this end, ‘‘nutrient discharges would have to be reduced to the level they were during the 1930s and 1940s, i.e. around 350 000 tons of nitrogen and 15 000 tons of phosphorus per year. For nitrogen this means a reduction of some 65% (…), based on today’s nutrient loading estimates which are by no means exact’’ (Stockholm Environment Institute, 1990, p. 22). To achieve such nutrient reductions, a massive abatement effort is required. Even a more modest target adopted by HELCOM in 1987, namely to reduce nutrient loads by 50%, requires serious economic commitments.
nitrogen mitigation measures become costly, and when a substantial decrease in the phosphorus load is achieved, the latter will become the limit-ing factor. This means that, in order to achieve a sustainable improvement of the ecological condi-tions of the Baltic Sea, the emphasis may switch from one nutrient to another over time (starting with nitrogen, i.e. the current limiting factor).
Another reason to put emphasis on nitrogen rather than phosphorus is that, according to model studies, even large reductions of the latter are not likely to result in ambient improvements sooner than in a 25-year period due to a long residence period. In contrast, it would take only (!) 10 years for nitrogen concentrations to achieve reductions commensurate with the discharge re-duction rate (Turner et al., 1995). In other words, it is possible to significantly reduce the eutrophi-cation of the marine ecosystems now by con-trolling nitrogen rather than phosphorus. In the remainder of the paper we will thus treat the former as a key environmental characteristic of the Baltic Sea.
In our analyses we make a simplifying assump-tion that an ecosystem responds in a predictable way to a gradual reduction in pressure from hu-man activities. Although ecologists provide hu-many examples where this is not the case, modelling studies of the Baltic Sea suggest that — given the current level of their degradation — the sea ecosys-tems will respond by moving towards less eu-trophic conditions and, eventually, a recovery.
By the very end of the second decade of the Helsinki Convention, in April 1992, its signatories committed themselves to the Joint Comprehensive (Environmental Action) Programme (JCP). The Programme lists priority investment projects (HELCOM, 1993a,b (No. 46)). However, it fails to create an effective mechanism for these projects to be undertaken. Some of them have already been launched, but some clearly need an addi-tional stimulus to be carried out.
It has been recognized that countries need to create a basin-wide compensation mechanism to implement the JCP. Indeed some transfers be-tween the wealthy northwestern and less economi-cally developed southeastern parts of the drainage basin have taken place since 1990. Nevertheless it
is doubtful whether the absolute amount of these transfers and their breakdown by donors and recipients is consistent with any conscious policy to optimize the Baltic environmental recovery.
2. The Chander – Tulkens model
This section is based on the conceptual frame-work and notation introduced in Chander and Tulkens (1992). Their model of cost sharing can be summarized as follows.
There is a set Nof n countries sharing a com-mon resource. The function ui(xi,z) denotes the
ith country’s preferences over the consumption of a single private good xi]0 and a single ambient
characteristic z50 of the common resource (be-ing thus a public bad). The number
pi=#ui/#z:#ui/#xi]0
is the country’s marginal willingness to pay (WTP) for an improvement in environmental quality. The equation
fi(yi,pi)=0
defines the country’s production function, link-ing its output yi]0 of the private good with its
discharges pi]0 of a single factor degrading the
common resource, and such that
#fi/#yi\0
and
#f
i/#pi50.
The number
gi = −#f
i/#pi:#fi/#yi]0
is the country’s marginal cost of reducing its discharges (note that gi= −#fi/#pi: #fi/#yi=#fi/ #(−pi): #fi/#yi, and a positive #(−pi) measures
indeed a reduction, not an increase in pollution). The countries interact with each other (i) through transferring the private good in the amount of Ti
(TiB0 if given away by theith country andTi\0
if received by it); and (ii) by contributing to the degradation of the common resource:
(here and below theS sign denotes summation over the setN).
The transfers have to be consistent with the feasibility condition:
xi=yi+Ti, fori=1,…n, with STi=0.
In a non-cooperative equilibrium of the Nash type (countries maximize their respective func-tionsuisubject to their production functions, with
no transfers, and taking as given the other coun-tries’ discharges) the first-order conditions imply:
pi=gi.
By contrast, a Pareto optimum is characterized by Samuelson-type first-order conditions
pN=gi, wherepN=Spi.
The Chander – Tulkens model takes a non-co-operative equilibrium as the initial condition of a resource allocation process defined in the follow-ing way (% denotes derivative with respect to the time variable which is omitted for brevity; all equations hold for each i):
‘the driving force’ of the
pi%= −(pN−gi),
process: adjustments are made as long as the Pareto optimum conditions are not satisfied;
change in the quality of the
z%= −S pi%,
common resource; production function
re-yi%=gipi%,
sponse to abatement efforts undertaken,
x%i=yi%+Ti%, the private good balance.
Chander and Tulkens have proposed the fol-lowing form of the incremental transfer function:
Ti%= −gipi%+(pi/pN)·Sjgjpj%
countries have fully reimbursed their respective marginal costs of abatement (−gipi%) but at the
same time they give away ((pi/pN)·Sjgjpj%), a share
in the sum of all countries’ marginal costs (− Sjgjpj%) proportional to their marginal WTP
di-vided into the sum of marginal WTPs of all countries (pi/pN).
Under this assumption, the private good bal-ance becomes:
xi%=(pi/pN)·Sjgjpj%
This process has been proved to converge to a Pareto optimum (Chander and Tulkens 1992).
A number of issues need to be addressed be-fore this approach can be applied to the Baltic Sea problem (Z:ylicz, 1993).
2.1. Multiple pollutants and their interaction
The model can be generalized to multiple char-acteristics of the common resource (represented as several different public goods). It can also be generalized to the case of multiple pollutants af-fecting a single characteristic of one common good, e.g. eutrophication of the Baltic Sea caused mainly by two nutrients: phosphorus and nitrogen.
2.2. Stock 6ersus flow pollution
The model assumes that the common good in question is affected by flow pollution, whereas in fact the eutrophication of the Baltic Sea is more adequately described as a stock-type one. One way to deal with the problem (not ad-dressed here) would be to develop a more com-plex modelling framework. Another one would be to treat the eutrophication problem as if it were a flow-type problem on the grounds that for policy (negotiation) purposes current dis-charges are more relevant than the accumulated stock of nutrients in the Sea. A flow model seems to be closer to the issues actually debated at political fora. Moreover it makes it easier to specify production functions fi which actually
depend on flows rather than stocks. (It should be noted, however, that, on the contrary, utility functions ui depend on stocks rather than flows.)
2.3. Numerical estimation of pi and gi
Abatement actions taken by countries are mo-tivated mainly by domestic environmental con-cerns (river and lake clean-up). The most challenging problem is thus to define ‘incremen-tal’ costs or projects undertaken for the sake of the Baltic Sea. The problem is even more com-plicated than that; the clean-up of various parts of the Sea (semi-enclosed bays) can be accom-plished at the expense of increasing the eu-trophication process elsewhere (in the Baltic proper). Such phenomena also point at the ne-cessity of checking which aspects of the Baltic Sea qualify for being considered a public good (both non-exclusion and non-rivalry are violated in the case of semi-enclosed bays). This adds to the complexity of defining what is incremental from the common-good point of view.
2.4. Numerical estimation of pi
This question is embedded in the previous one in a sense that we have to define precisely what is the common good before we can estimate its utility. It is our conjecture that many conven-tional valuation approaches, if applied in the Baltic context, would estimate the value of the sea shore as a local resource rather than a com-mon one.
The approach taken in this paper is the fol-lowing one. We make a simplifying assumption that the Baltic Sea eutrophication problem is caused by nitrogen emissions. We then review the nitrogen abatement measures −pi% and their
costs gi. We then turn to measuring benefits pi
and pN through a series of contingent valuation
method (CVM) surveys. Finally, we look at in-ternational assistance programmes from the point of view of their contribution to the Baltic environmental recovery. The actual international transfers are compared with hypothetical trans-fers derived from the Chander – Tulkens formula:
Ti%= −gipi%+(pi/pN)·Sjgjpj%
3. Estimating abatement cost functions
The Chander – Tulkens model assumes that marginal abatement costs, gi, are known for all
countries concerned. From the construction of the model it follows that gi, in fact, are average
abatement costs incurred by the ith country in period for which Ti%and pi% are computed. In our
analysis here we assume that 1 year is the length of a period for calculating incremental quantities such as Ti% and p%i. In other words, −pi% will
denote an annual reduction in nutrient discharges, and −gipi% is the annual cost of the necessary
measures in the ith country. In this paper, as elsewhere (e.g. Turner et al., 1995), nitrogen dis-charges are chosen as a proxy for the pollution variable pi. This is motivated by the fact that
nitrogen is considered the limiting factor for a major part of the Baltic Sea. Besides, nitrogen abatement measures are roughly an order of mag-nitude more costly than those targeted at phos-phorus. Thus from an economic point of view the former is a key factor determining the interna-tional cooperation process.
Nitrogen abatement costs in the Baltic Sea Drainage Basin have been reviewed and analyzed quite extensively (see, e.g. Z:ylicz, 1994; Gren et al., 1995; Krysanova et al., 1995; Turner et al., 1995). Despite that, there are no definite answers as to what numbers can be best substituted for
−gipi%. There are several reasons for this
ambiguity.
Nitrogen in the Baltic Sea comes from rivers, surface runoff, and from atmospheric deposition. The waterborne nitrogen originates from within the drainage basin. In contrast, the airborne nitro-gen may come virtually from all over Europe: either in the form of nitrogen oxides (mainly from car exhaust gases) or ammonia volatilized from the soil (mainly from agricultural activities). This does not allow us to confine analyses to the drainage basin. We will make, however, another simplifying assumption and disregard the deposi-tions originating from countries other than those surrounding the Sea.
Table 1
Basin-wide cost-effective nitrogen discharge reductionsa 5
Reduction rate (%) 10 15 20 25 30 35 40 45 50
0.1 0.1 0.2 0.3 0.5
Cost (109$/year) B0.1 0.8 1.2 1.9 4.1
aSource: Gren et al. (1995).
discharges there are options ranging from reduced fertilizer use to cultivation of catch crops, to better manure application (the corresponding costs range from 2 to 30 $/kg N); (3) atmospheric depositions of nitrogen oxides originate from car exhaust pipes and power plants. Abatement costs — if related to the quantity actually de-posited in the Sea rather than emitted from a source — are high. They range from 9 to as much 1300 $/kg N depending on a type of a source and its distance to the Sea. In addition, waterborne nitrogen can be abated by means of restoring wetlands as nutrient sinks. The cost of abate-ment — measured as an opportunity cost of the land thus diverted from other uses — is estimated at 1 to 9 $/kg N (Gren et al., 1995).
Both nutrients (phosphorus and nitrogen) re-sponsible for the eutrophication reveal a high degree of technological complementarity in abate-ment processes. At low to moderate levels of abatement both nutrients are removed simulta-neously, the abatement costs are relatively low, and it does not take much effort to reduce nitro-gen discharge if phosphorus is removed and vice versa. The pattern changes at higher levels of abatement. Not only do the overall costs grow, but it costs much more now to remove nitrogen even if phosphorus has been removed. Basin-wide marginal abatement costs for nitrogen grow expo-nentially hitting $4 billion per year once the re-duction rate approaches 50% (see Table 1). These costs are indicative only, as they are affected by a wide margin of uncertainty.
There is no doubt that a part of any abatement effort is motivated by purely domestic concerns. By reducing nitrogen discharges countries serve their own needs by upgrading their private good production functions, as well as positively affect-ing their utility functions. This aspect is not ex-plicitly dealt with in the Chander – Tulkens model.
Any abatement effort should be considered net of what would have been undertaken anyway, irre-spective of the impact on the Baltic Sea, but there are no convincing methods of a priori separating these two motives, and no studies have been carried out to solve the issue empirically.
We assume further that the costs of nitrogen reductions in transition economies will be similar to those estimated using econometric techniques in Finland, Sweden, Denmark and Germany. By so doing we possibly overestimate these costs, since economies in transition may have some not-yet-harnessed potential for improving efficiency. To illustrate the scope of potential low-cost or no-cost nitrogen reduction options, one may refer to the Polish experience after the collapse of the central planning mechanism. Between 1989 and 1994 the fertilizer consumption fell by almost two-thirds from 195 to 71 kg NPK per hectare (in 1992 it plummeted to 62 kg/ha) without propor-tional losses in yields of major crops. These fell by approximately 20%, at least a part of which has been attributed to adverse climatic factors. Until 1998 no further adverse effects on crops were observed despite the continued low application of fertilizers. This is an example of an abatement measure whose opportunity cost is minimal if at all positive. It is widely held that examples like this are common in economies in transition.
model which allocated abatement tasks among the Baltic countries so as to jointly meet the 50% target, at least cost (Gren et al., 1995). Investment costs were annualized (at 7% discount rate) and averaged over the 20-year period corresponding to the JCP time horizon.
4. Measuring benefits from reduced eutrophication
Estimation of benefits that may be attributed to pollution abatement in the region seems to be an even more troublesome task than measuring the costs of pollution abatement. The CVM is consid-ered to be the only economic method of natural resource valuation capable of capturing non-use value components. The methodology of CVM has improved significantly over approximately 30 years of its development. Nevertheless the method itself, its validity and reliability, are still a source of controversy. Moreover, as evident from the recent discussion in Ecological Economics on the global environment valuation exercise (Costanza et al., 1998), there are still unresolved problems even more fundamental than just valuation techniques.
According to Whitehead et al. (1995)technical reliabilityof WTP estimations is defined in terms of the extent to which the WTP measure is im-plied by nonrandom sources and the stability of the measure over time.Validity is the extent that the measured value corresponds to the theoretical
definition of value. Different biases may affect both validity and reliability of the WTP estimates. Such biases were tested in some experiments: see, e.g. Hanemann (1994) for well-known experi-ments with strawberries; Cummings and Harrison (1994) for a test on the strategic bias; Niewijk (1994) for an embedding bias. It is difficult to draw one conclusion based on these experi-ments — some studies tend to praise CVM while others deny its reliability.
In spite of the controversies regarding biases, the values produced in CVM experiments have been accepted by many researchers as well as by some policy-makers. One of the most recent hand-books devoted to environmental economics states: ‘‘The WTP (…) measures of economic value can be used as restrictions to guide policy or can be included, with caution, in the bottom-line cost – benefit analysis used to support public policy’’ (Hanley et al., 1997).
In the US, CVM has been adopted for practical use in several instances. The Department of Inte-rior accepted CVM as the best available proce-dure for assessing monetary damages to resources. This decision was challenged by the State of Ohio in a Federal District Court in 1986, but the court affirmed it (Cummings and Harrison, 1994).
In 1994, National Oceanic and Atmospheric Administration (NOAA) recommended using CVM in oil spills damage assessments. NOAA’s decision has been taken after a panel of scientists had analyzed the usefulness and reliability of CVM in evaluating non-use values. Also EPA has begun to use CVM studies in cost – benefit evalua-tions of its regulaevalua-tions (Niewijk, 1994).
The NOAA panel report (Arrow et al., 1993) sets guidelines for researchers who undertake CVM studies. Compliance with its requirements is likely to alleviate biases, leading to higher reliabil-ity. It should be noted here that the CVM surveys described in the latter part of the paper conform to the rules set in the NOAA panel report.
Three Baltic countries, Poland, Lithuania and Sweden, have been the subjects of empirical stud-ies aimed at eliciting aggregate national WTP for improvement of the quality of the Baltic Sea. The researchers’ additional task then was to extrapo-late the results of empirical valuation from these
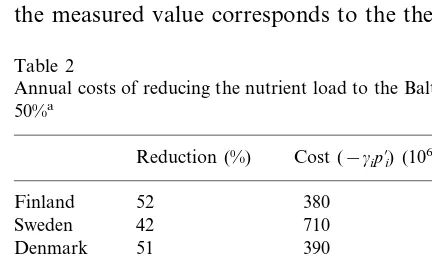
Table 2
Annual costs of reducing the nutrient load to the Baltic Sea by 50%a
three countries to the whole Baltic region using a benefit transfer approach. According to Bergland et al. (1995) there are generally three types of benefit transfer approaches: (1) transferring mean unit values; (2) transferring adjusted unit values; and (3) transferring demand functions.
Often benefit transfer methods are not a reliable tool. It is not the purpose of this section to test reliability and validity of benefit transfers, al-though the empirical data collected provide quite a good starting point for a future work on this subject. What we try to achieve here is to compile empirical CVM results in such a way that both methodological discrepancies and country-specific factors may be accounted for as much as possible. We will present findings obtained from five empirical CVM studies on country-wide samples: three from Poland, one from Sweden and one from Lithuania. All studies deal with the same problem, i.e. measuring benefits from reduced eu-trophication of the Baltic Sea. The three Polish studies vary in methodology — the first, prelimi-nary, survey employs an open-ended (OE) WTP question, while the other two studies use a di-chotomous choice (DC) type of question. The last of the Polish studies was carried out as a mail survey, while the first two were carried out as face-to-face interviews. Yet another CVM study was carried out at the Polish Baltic Sea coast (see Z:ylicz et al. (1995) for the results). However, being aware of a bias resulting from a specific type of the sample (beach users), we will skip this one in our analysis.
4.1. Analysis of empirical results
The two surveys presented in this paper are fully comparable. The Lithuanian survey carried out on 10 – 18 October 1994 was based on the earlier Polish pilot study implemented on 21 – 28 July of the same year. Both surveys were carried out by professional polling agencies of the respec-tive countries on representarespec-tive, country-wide samples. The Polish sample consisted of 1166 respondents and the Lithuanian one of 1002.)
The Polish pilot sur6eywas the first in the series
of CVM experiments. It was designed as a preparatory work before other surveys. The main
purpose of the pilot study was to check the ade-quacy of the valuation scenario and questions, as well as to estimate the range of initial bids to be used in the next surveys. The questionnaire was short and consisted of a scenario and three questions.
The question about support for a ‘Baltic tax’ was answered positively by 60% of respondents and negatively by 39.2%. A mere 0.9% of the respondents stated that it was difficult to say if they would or would not support the tax (ten cases). Those who gave a positive answer to the first question or said they did not know were subsequently asked about their opinion on an appropriate value of the Baltic tax (an open-ended question). Those who would not support the introduction of such a tax were asked about the reasons of refusal.
How to estimate mean WTP in situations where a significant number of the respondents do not answer the valuation question? Different authors take different approaches here: some (e.g. Lang-ford and Bateman, 1993) tend to focus on positive respondents only while others (e.g. Gren et al., 1995) assume zero value for non-respondents.
An interesting approach was proposed by Berg-land et al. (1995). Respondents who rejected the idea of payment are divided into two groups: ‘legitimate zero bidders’, who did not value the resource in question or could not afford to pay, and ‘protest bidders’, who viewed the idea of payments as not being their responsibility. We have followed this approach by making a distinc-tion between protest and zero bidders according to different reasons for payment refusal.
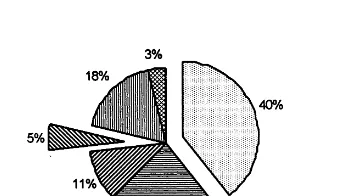
Fig. 1 shows the breakdown of reasons for rejecting the idea of the Baltic tax. In the group of zero bidders we decided to place those who can-not afford to pay as well as those who think that there are other, more important goals to be financed. Assigning zero values to these categories does not necessarily mean that those respondents do not value the Baltic Sea or its recovery. Their WTP in the situation described in the valuation scenario, however, can be considered zero.
Baltic Sea (14.3%). Those who answered the first question positively or said that they did not know were asked about their WTP. As before, in the breakdown of reasons for refusing to pay we make the distinction between zero and protest bidders.
As can be seen from Fig. 2, the option ‘‘I cannot afford to pay’’ has been chosen less fre-quently relative to the Polish study. The mean and median were calculated as WTPLithuania=27.92
LIT:$7 (at exchange rate 4 LIT/$), MLithuania=
10 LIT:$2.5; N=697. Regression models re-vealed no significant factors except for household income.
Except for the Polish pilot and Lithuanian ex-periments, all other Baltic CVM studies employ a DC-type of WTP question, which is preferred by many authors as more natural and resembling situation at real markets. Below the results of two other Polish CVM studies are summarized for comparison and discussion of the most reliable, approximate value of WTP for the Baltic Sea recovery.
Themain Polish studywas carried out on 25 – 29 November 1994 on a representative all-Poland sample of 1162 respondents, as a part of a larger sociological survey. Valuation scenario gave a short description of eutrophication effects
ob-Fig. 1. Zero bidders (exploded) versus protest bidders in the Polish pilot study. (1) I cannot afford to pay but I would do so otherwise; (2) I think I pay too much in taxes already; (3) I do not believe that my contribution will lead to any improve-ment; (4) I do not think that this is the most important problem in our country; there are other, more important goals; (5) I do not feel responsible for the condition of the Baltic Sea; let the responsible parties pay; (6) other reasons.
responsible for the state of the Baltic Sea, let others, who are responsible, pay’’, indicate that respondents have a particular reason for refusal, not connected with the value of payment. This is why we decided to exclude this group of respon-dents from WTP calculation (Fig. 1).
The mean value of WTPPilot including zero
bidders simply as zero values and protest bidders as missing equals 31.98 PLN (:$14 at the
ex-change rate of 2.32 PLN/$ prevailing at the time of the survey), N=820. Median value is 10 PLN (:$4.3).
Let us compare these results with the results from the Lithuanian CVM study, which applied the same scenario and questions. The only differ-ence was that the list of reasons for refusal in the Lithuanian study contains an additional option: ‘‘I am not able to value clean Baltic Sea’’ (for the full menu of other options, see the footnote to the Fig. 2).
The results of the Lithuanian survey are as follows. A total of 44.2% of the sample positively answered the question about support for the Baltic tax, while 41.6% of respondents said that they would not support the proposed action. A relatively high percentage of the sample, com-pared to the Polish study, did not know if they would or would not support a tax levied on all Lithuanians for the sake of protection of the
Fig. 3. Percentages of ‘yes’ and ‘no’ answers to the initial bid in the main Polish study.
For DC responses the mean WTP is given by the area under the cumulative probability (bid) function. This area may be truncated at zero and/or the value of the maximum initial bid. Here we have used a simple, not-truncated model. By allowing negative amounts we admit that we can-not exclude that someone who refused to pay anything would rather withdraw the funds that are already being spent by the economy on pollu-tion abatement in the Baltic Sea. By not truncat-ing the model at the maximum bid value, we take into account that the value accepted by a given respondent is not the maximum value this respon-dent might have accepted. For further discussion of this problem, see Langford and Bateman (1993).
In the linear logistic model integrated over the entire set of real numbers the estimate of mean WTP is the same as the median, since the density function is symmetrical about its mean value. By substituting the definition of a median (PNo=
PYes=0.5) into the linear logit model we can
calculate the median as −a/b. Thus in this special case also the arithmetic mean,
WTP0= −a/b
Based on the model coefficients we got the average value 169.33 PLN (:$73) for positive
bidders (713). According to the same criteria as before, 224 respondents were classified as zero bidders, and 225 as protest bidders. In order to modify the mean/median value by including zero bidders we have multiplied WTP achieved from the model by the factor 713/937 (the ratio of positive bidders to positive and zero bidders). Hence WTPMain=129 PLN (:$55.5).
Yet another CVM study was carried out in Poland in May/April 1995. This timemail sur6eys
were used to compare the results with Swedish studies which employed that method. Unfortu-nately, the method is characterized by a relatively low response rate in Poland. Moreover, overesti-mation may occur resulting from the fact that those who respond are usually more interested in the subject.
In Poland the questionnaires with a Baltic valu-ation scenario were sent to 600 randomly chosen addresses; 304 have been filled out and returned, served in the Baltic Sea and mentioned a
possibil-ity of carrying out an international clean-up ac-tion over the next 10 years. Such an acac-tion would call for collecting financial resources in each Baltic country in the form of an earmarked tax. The respondents were then asked if they would support such an action. A total of 62.5% of respondents said ‘‘yes’’, and 29.8% said ‘‘no’’; 6.7% said they did not know.
A DC question on acceptance/rejection of an initial bid followed. Initial bids and the ratio of acceptance/rejection grouped according to initial bids that were randomly distributed across the sample are displayed in Fig. 3. Numbers displayed in bars represent percentage of yes/no answers in groups of respondents that were given a particular bid.
As expected, the percentage of acceptance falls as initial bids rise. For estimation of mean and median values of WTP, a linear logit model was used. The model with one explanatory variable — an initial bid value — has the following form:
ln(PNo/PYes)=a+b·BID
where PNo and PYes represent the probability
of refusal and acceptance of a given initial bid (BID). The bid level revealed to be highly significant
ln(PNo/PYes)= −1.1345+0.0067 BID
Table 3
CVM studies results: mean WTP values in 1995 US$ (including zero bidders and excluding protest bidders)
Country Lithuania Poland Sweden
Pilot (OE) Main (DC)
Type of empirical study Pilot (OE) Mail (DC) Mail (DC)
WTP 7 14 56 102 458
giving the response rate of 50.7%. The majority of respondents (54.3%) said that they would be willing to contribute part of their income in the form of a special tax for the sake of protection of the Baltic Sea. A linear logit model was esti-mated as:
ln(PNo/PYes)= −1.7787+0.0037 BID
(see Appendix A for statistical details of the equation).
From this we obtain mean WTP0= −a/b=
480.73 PLN (for positive bidders only). Including zero bidders we obtained the value of WTPMail=236.32 PLN (:$102).
The Swedish mail sur6ey with the same DC
type of WTP question was carried out on a 700-respondent sample (response rate 60%). The mean annual WTP reached 5800 SEK when only positive bidders were taken into account (Gren et al., 1995). Using the method of distinguishing zero bidders and protest bidders (based on (So¨derqvist, 1998)) we estimated the mean WTPSweden at 3439 SEK which is equivalent to
$458 at the exchange rate of 7.5 SEK/$.
4.2. WTP estimates and benefit transfers
Table 3 summarizes WTP values obtained from various studies. In the subsequent part of the paper these values will be used to estimate the benefits ratios: proportions of each country’s marginal WTP to the sum of marginal WTPs (pi/pN), and then plugged into the Chander – Tulkens formula.
As we have the results from studies that em-ployed three different methods of estimation, we have used the approach of translating the results from the Lithuanian OE study and Swedish mail DC study into hypothetical DC face-to-face type of study results, using the Polish experience from
all three types of surveys. In other words, the Polish main study results have been used as a common denominator in order to arrive at com-parable estimates. Based on Table 3 we assumed that the coefficient for translating an OE study results into a DC face-to-face study results equals 4, and for translating mail survey results equals 0.55. We have therefore assumed that a hypothetical DC face-to-face survey in Lithuania would have yielded WTP=$28, and in Sweden WTP=$252.
To estimate the WTP for the entire Baltic re-gion we applied the following approach. We have assumed that the three countries that were subject of CVM surveys are representative for three sub-regions: Sweden for Western Europe market economies, Lithuania for the former So-viet Union republics, and Poland (for Poland only).
Table 4
Estimation of mean and total WTP values in countries of the Baltic Regiona GDP per capita at
Nominal GDP per
Country bi, Mean WTP per Aggregate benefitspi
capita (US$)
PPP (US$) (106US$)
capita (US$)
15 483 0.92
Finland 13 954 232 872
16 821 1 252 1615
Germany 18 541 1.10 278 676
4588 1
Poland 1911 56 1460
3632 1
573 28
Lithuania 73
765
Latvia 3058 0.84 24 46
Estonia 956 3823 1.05 29 33
4970 1.37
1147 38
Russia 276
7998 – 110 6048
Drainage Basin 6091
aSource of GDP data: OECD data files. 5. International cooperation
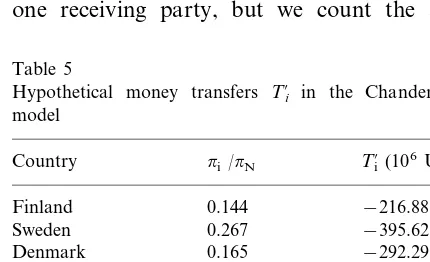
The calibration of the Chander – Tulkens for-mula is given in Table 5. According to the model there is no country within the region that achieves balance without a money transfer with nutrient load reductions shown in Table 2. In four cases (Finland, Sweden, Denmark and Russia) coun-tries should contribute to a ‘common pool’ of money (negative Ti% values), and in five cases
(Germany, Poland, Lithuania, Latvia and Esto-nia) countries should be able to use the ‘common pool’.
The total amount of transfers, i.e. STi%/2 (for
each dollar transferred there is one paying and one receiving party, but we count the amount
only once), equals $947M per year which corre-sponds to 23% of the costs indicated in Table 2 and to 16% of the annual benefits. As one would expect, northwestern countries such as Sweden, Denmark and Finland are net payers owing to the fact that they value the Sea more than implied by their share in abatement expenditures. By the same token, southeastern countries such as Poland, Lithuania, Latvia and Estonia receive in net terms. Quite unexpectedly, two countries, Germany and Russia, end up in ‘wrong’ groups: Russia is a net payer ($109M) while Germany receives a small compensation ($67M).
The German – Russian paradox can be ex-plained by taking under closer scrutiny our esti-mates pi of these countries’ WTP. Only a very
small part of the German population lives in the Baltic drainage basin and was thus considered in the benefits study. For instance, the several-mil-lion population of Berlin living just a 2-h drive from the Baltic coast has been excluded from the benefit aggregation procedure. And yet, if asked, probably they would have revealed a substantial WTP for improving the marine environment. It is therefore likely that the German benefits are greatly underestimated in our study.
At the same time, the Russian WTP was esti-mated by taking into consideration the country’s GDP per capita at purchasing power parity. There is an unusual discrepancy between this estimate (almost $5000) and the nominal GDP ($1147). Hence one may expect that the former is
Table 5
Hypothetical money transfers Ti% in the Chander–Tulkens
but a very disputable measure of wealth of an average Russian. It is likely that he or she could be inclined to relate the WTP for an international public good such as the Baltic Sea by looking at nominally priced private goods rather than by considering his or her purchasing power in real terms. As a result, the Russian WTP estimated in our study could have been overestimated.
6. Discussion and policy conclusions
Our study indicates that there exists an essential asymmetry in the distribution of costs of, and benefits from, the reduced eutrophication of the Baltic Sea. The analysis is a simplified one, non-Baltic countries intersecting with the drainage basin on small areas only (Norway, The Czech Republic, Slovakia, Ukraine and Belarus) were excluded from the study.
Germany and Russia are two large Baltic coun-tries whose territories overlap with the drainage basin only partially. Consequently only small parts of their respective populations were consid-ered in the aggregation of the total WTP. Even though the Baltic Sea is not a popular tourist destination worldwide, it may nonetheless be val-ued as a public good also outside its drainage basin. No such ‘geographically external’ values were accounted for in Table 4.
Likewise no abatement expenditures to be borne outside the drainage basin were taken into account in Tables 1 and 2, despite the fact that a significant portion of atmospheric depositions of nitrogen originates externally. Airborne nitrogen is emitted from power plants and car exhaust gases from all over Europe, and its abatement is quite costly. The exclusion of non-drainage basin areas may be particularly problematic in the case of Germany, the region’s largest economy.
Another simplification was to consider coun-tries’ abatement measures as dedicated to the protection of the Baltic Sea, while at least some of these are undertaken in order to protect inland ecosystems or human health directly. Reducing nitrogen discharges in upstream locations, e.g. in Poland — only 20% of which would reach the Sea anyway — is primarily motivated by purely
do-mestic concerns. Thus the Polish costs estimated in Table 2, impressive as they are, may be overes-timated as the country’s contribution towards provision of the public good in question.
A large margin of uncertainty affects our benefit estimates. The series of surveys aimed at valuation of the same public good revealed a fair degree of internal consistency and reliability. All surveys carried out were based on the same valua-tion scenario, i.e. to reduce the eutrophicavalua-tion of the Baltic Sea to a tolerable level defined in terms of reduced algae bloom episodes, eliminated oxy-gen deficit conditions, and re-opened beaches. All surveys referred to the same payment vehicle, i.e. an internationally coordinated earmarked Baltic tax.
As anticipated by the economic theory, we have found that open-ended questions yielded consis-tently lower WTP responses. Likewise, we have found that mail surveys yielded higher WTP re-sponses than face-to-face ones. It is not clear whether this can be attributed to a non-response bias, or to the fact that a written scenario may be perceived by respondents as more comprehensive and/or simply may be better understood. We have finally decided to base our conclusions on a face-to-face survey with a DC WTP question for two reasons. First, this type of survey produced ‘mid-dle’ results. Second, it seemed to provide informa-tion sufficient to define the commodity to be valued without leaving the respondent over-whelmed by the message (as in the case of a long questionnaire received by mail).
equations as representative for the other north-western countries, i.e. Finland, Denmark and Germany, and Lithuanian results for the countries of the former Soviet Union, i.e. Latvia, Estonia and Russia.
Sweden emerges as the single largest beneficiary of the recovery programme, with almost 27% share in total benefits. It is followed by Poland (24%) and Denmark (16%). The Baltic republics are located at the bottom of this list enjoying collectively less than 3% of the total benefits. Thus more than two-thirds of all benefits accrue to Sweden, Denmark and Poland, either because of the high average WTP (the first two cases) or because of the large population affected (the third case). It therefore comes as no surprise that these three countries have been most active in promot-ing coordinated, basin-wide approach to the prob-lem at various Helsinki Commission fora.
Another important observation emerging from our analyses is that the total benefitspN($6048M per year) outweigh the costs −Sjgjpj% ($4140M
per year) by a factor of approximately 1.5. Let us also note here that cost estimates, taken from Gren et al. (1995), refer to average levels annual-ized over a 20-year period. They are higher than costs to be born in the first few years of the JCP, but lower than those to be born towards the end of the Programme.
A rough calibration of the Chander – Tulkens model allowed us to compute hypothetical money transfers Ti% required to motivate countries to
participate in the JCP up to the globally efficient level. Only fragmentary evidence of the actual environment-related money transfers is available (Laurson et al., 1995). Since 1989 Poland has attracted more international environmental assis-tance than other countries — approximately $40 – 50M per year. In relative terms, however, this accounted for mere 4 – 5% of the country’s envi-ronmental investment expenditures. Interestingly, Denmark turns out to be the largest single Eu-ropean donor with grants pledged totalling $57.8M over a 7-year period (1990 – 1996). Swe-den pledged $24.2M, and Finland $16.9M. Ger-many considered pledging $42.3M, but only $0.1M were actually spent by 1994 (Ochrona,
1995). The Polish case is rather typical for the region except for Estonia. The latter has received substantial Finnish assistance totalling almost a half of its environmental expenditures in the early 1990s.
Sweden — the single most generous interna-tional donor (in per capita terms) with a strong interest in the region — committed $140M per an-num (in 1993 – 95) to projects in Central and Eastern Europe. However, only a minor fraction of these funds was to be spent on the environment which competed with a number of other (political, educational, cultural, medical, and commercial) objectives (Ministry of Finance, 1992).
It is clear from these examples that actual transfers between the Baltic drainage basin coun-tries are at least by one order of magnitude lower than those derived from the Chander – Tulkens model. Nevertheless some signs of emerging coop-eration may be traced. First of all, the countries of the region are involved in a number of eco-nomic, social and political issues that are far more complicated than the Baltic question. It can thus happen that ‘issue linkage’ occurs, and other forms of incentives or pressures substitute for direct transfers. In addition, cost estimates that were taken as the basis for further modelling represent an approximate average level required until the year 2010 (the time horizon of the JCP). Given the steepness of the underlying abatement cost curves, the largest effort is yet to be under-taken. So far, countries have not left the relatively flat portions of their marginal cost curves. Hence it is likely that the actual level of transfers in the early 1990s was not very far from the hypotheti-cally efficient one.
though the proposals were very modest (corre-sponding to mere 5% of abatement costs), they did not gain political support. This casts serious
References
Arrow, K., Solow, R., Portney, P.R., Leamer, E.E., Radner, R., Schuman, H., 1993. Report of the NOAA Panel on Contingent Valuation, Resources for the Future, Washing-ton, DC.
Bergland, O., Magnussen, K., Navrud, S., 1995. Benefit trans-fer: testing for accuracy and reliability, NLH Discussion Paper cD-03/1995, Agricultural University of Norway, A,s.
Costanza, R., d’Arge, R., de Groot, R., Farber, S., Grasso, M., Hannon, B., Limburg, K., Naeem, S., O’Neill, R.V., Paruelo, J., Raskin, R.G., Sutton, P., van den Belt, M., 1998. The value of the world’s ecosystem ser-vices and natural capital. Ecol. Economics 25 (1) 3 – 15.
doubts on whether the signatories of the Helsinki Convention are ready to cost their public good adequately.
Appendix A
(1) Linear logistic regression coefficients based on the main Polish study
R
Sig df
Wald
Variable b S.E.
0.0067 0.0007
BID 97.1678 1 0.0000 0.308
0.0000 Constant −1.1345 0.1106 105.1476 1
−2 log likelihood, 730.432; goodness of fit, 1689.327.
x2 df Significance
Model x2 268.871 1 0.0000
Percent of correct predictions, 77.84%.
(2) Linear logistic regression coefficients based on the mail Polish study
Sig
Variable b S.E. Wald df R
0.3726 0.0000
1 29.9593
BID 0.0037 0.0007
0.0000 Constant −1.7787 0.2513 50.0771 1
−2 log likelihood, 158.315; goodness of fit, 160.993.
x2 df Significance
1
43.118 0.0000
Model x2
Percent of correct predictions, 79.52%
Cummings, R., Harrison, G.W., 1994. Was the Ohio Court well informed in its assessment of the accuracy of the Contingent Valuation Method? Nat. Res. J. 34, 1 – 36 (Winter).
Chander, P., Tulkens, H., 1992. Theoretical foundations of negotiations and cost sharing in transfrontier pollution problems. Eur. Economic Rev. 36, 388 – 398.
Germain, M., Toint, P.L., Tulkens, H., 1996. International negotiations on acid rains in Northern Europe: a discrete time iterative process. In: Xepapadeas, A. (Ed.), Economic Policy for the Environment and Natural Resources. Ed-ward Elgar Publishing, London.
Hanemann, M., 1994.Valuing the environment through con-tingent valuation, J. Economic Perspect. 8, 19 – 43. Hanley, N., Shogren, J.F., White, B., 1997. Environmental
Economics in Theory and Practice. Oxford University Press, p. 358.
HELCOM, 1987, First Baltic Sea Pollution Load Compila-tion, Baltic Sea Environment Proceedings, No. 20, Helsinki.
HELCOM, 1993a, Summaries of the Pre-feasibility Studies, Baltic Sea Environment Proceedings, No. 46, Helsinki. HELCOM, 1993b, The Baltic Sea Joint Comprehensive
Envi-ronmental Action Programme, Baltic Sea Environment Proceedings No. 48, Helsinki.
HELCOM, 1996, Third Periodic Assessment of the State of the Marine Environment of the Baltic Sea, 1989 – 1993, Background document. Baltic Sea Environment Proceed-ings, No. 64B, Helsinki Commission.
Krysanova, V., Gornaja, L., Vasilyev, A., 1995. Baltic Drainage Basin Project. Progress Report from the Esto-nian Team. Institute of Economics, EstoEsto-nian Academy of Sciences, Tallin.
Langford, I., Bateman, I., 1993. Welfare Measures for Contin-gent Valuation Studies: Estimation and Reliability. CSERGE Working Paper GEC 93-04.
Laurson, P., Melzer, A., Z:ylicz, T., 1995, A Strategy to Enhance Partnerships in Project Financing for Environ-mental Investments in Central and Eastern Europe, Report for the EBRD, London.
Ministry of Finance, 1992, The Swedish Budget 1992/93, Allma¨nna Fo¨rlaget, Stockholm.
Niewijk, R.K., 1994. Misleading quantification: the contingent valuation method of the environmental quality. Regulation No. 1, 60 – 71.
Ochrona, S., 1995, Central Statistical Office, Warsaw (Envi-ronmental Statistics Yearbook).
Rocznik, S., 1995, Central Statistical Office, Warsaw (Statisti-cal Yearbook 1995).
Sanden, P., Rahm, L., 1991. Nutrient trends in the Baltic Sea. Environmetrics 4 (1), 75 – 103.
So¨derqvist, T., 1998. Why give up money for the Baltic Sea? Motives for people’s willingness (or reluctance) to pay, Environ. Resource Economics, 12 (2), 249 – 254.
Stockholm Environment Institute, 1990. Forward to 1950: Policy considerations for the Baltic environment, Ambio Special Report 7, 21 – 24.
Sweitzer, J., Langaas, S., Folke, C., 1995, Land Use and Population Density in the Baltic Sea Drainage Basin: A GIS Database, Beijer Discussion Papers No. 63. The Beijer Institute, The Royal Swedish Academy of Sciences, Stock-holm.
Turner, R.K. et al., 1995, The Baltic Drainage Basin Report: EV5V-CT-92-0183. Final Report of the Project, Norwich, University of East Anglia.
Whitehead, J., Bloomquist, G.C., Hoban, T.J., Clifford, W.B., 1995. Assessing the validity and reliability of contingent values: a comparison of on-site users, off-site users, and non-users, J. Environ. Economics Management, Septem-ber, 1995, 238 – 251.
Wulff, F., Niemi, A., 1992. Priorities for the restoration of the Baltic Sea — a scientific perspective. Ambio 21 (2), 193 – 195.
Z:ylicz, T., 1993. The ecological economics of the Baltic Sea. Eur. Rev. 1 (4), 329 – 335.
Z:ylicz, T., 1994. A survey of the cost-effectiveness of in-vestment projects co-financed by the Polish National Fund for Environmental Protection, Mimeo, Warsaw Uni-versity.
Z:ylicz, T., Bateman, I., Georgiou, S., Markowska, A., Dziegielewska, D., Turner, R.K., Graham, A., Langford, I., 1995. Contingent Valuation of Eutrophication Damage in the Baltic Sea Region, CSERGE Working Paper GEC 95-03, Norwich, University of East Anglia.