*Corresponding author. Tel.:#301-77-23-570; fax:# 301-77-23-571.
E-mail address:[email protected] (I.P. Tatsiopoulos)
The integration of activity based costing and enterprise
modeling for reengineering purposes
I.P. Tatsiopoulos
*
, N. Panayiotou
National Technical University of Athens, Mechanical Engineering Department, 15780 Zografos, Athens, Greece
Received 28 February 1997; accepted 23 June 1999
Abstract
This paper describes an approach to integrate the Activity Based Costing (ABC) technique within the framework of GRAI Integrated Methodology (GIM) in order to assist business process reengineering justi"cation and evaluation. The
"rst step of integration is to have ABC adopt cost pools and lists of activities derived from GIM process modeling. Further on ABC is involved in two stages of the methodology: (a) ABC adds to the ECOGRAI method of performance modeling by supporting the determination of the right performance indicators that are responsible for business process costs. (b) ABC is a sound approach to translate operational performance indicators not found in accounting ledgers into
"nancial terms and the company's pro"t bottom line. The approach has been developed during the Esprit research project REALMS and implementation results from two industrial partners are presented. ( 2000 Elsevier Science B.V. All rights reserved.
Keywords: Reengineering; Benchmarking; Activity based costing; Enterprise modeling
1. Introduction
The 1990s can be characterized as the decade of change. The struggle to gain or even sustain com-petitive advantage in a global market, in most of times, has led many companies to alter the com-plexion of many businesses. As a result, the direct cost of products and services become shorter and shorter. All the above a!ect critically the cost struc-ture of the enterprises. The increase of overheads in comparison to direct costs is outstanding in the manufacturing sector [1] and a need for an
alloca-tion in a more equitable manner among dissimilar products and customers is identi"ed [2,12,24]. It is worth saying that the extremely demanding market calls for products of higher quality and lower prices. The slogan`the customer pays for only the services he getsaclearly depicts the market pressure [3]. The new economic and competitive realities, as businesses evolve into the 1990s a!ect the manage-ment as well. The organization must adapt to the changing environment in order to survive and the role of management information is fundamental to a more long-term development of management capability [4].
Management information must re#ect reality, be predictive, embody strategy, explain cause and e!ect, re#ect the customer's perspective, determine the relative pro"tability of both products and
customers, relate to the business processes, be in the language of management.
Enterprise modeling and Activity Based Costing (ABC) try to satisfy the above needs, having the objective of improving business performance and sustaining this improvement in the future. A lot of success stories have been reported [5,6] trying to de"ne the most appropriate implementation in a company. Information Technology (IT) has de" -nitely been an enabler of ABC [7] and has helped its extensive use in Business Process Reengineering (BPR) projects [8].
It is well recognized in the literature that one of the most di$cult tasks in the development of an activity-based cost system is the identi"cation and design of the activities that should be included in the processes. Many modeling tools are available nowadays, whether for incremental (TQM) or radical enterprise system analysis, redesign and improvement (BPR). Enterprise modeling is an im-portant prerequisite for a successful BPR project [9]. Many di!erent methodologies exist, such as SADT, NIAM [10] or ARIS [11], all of them having the same purposes:
f to handle the complexity of the real world,
f to precisely model the business processes with sophisticated mapping techniques,
f to be understandable,#exible and descriptive.
The integration of enterprise modeling with an activity-based cost system is recently been studied, the most popular approach being this of IDEF-0 modeling with ABC. Many di!erent soft-ware programs, such as Activa, EasyABC, TRM/ACM, Pro"t Manager, DaCapo Process Manager [12}14] combine modeling techniques, activity based costing and/or simulation. However, this kind of integration has not always been successful.
ABC was treated as an accounting approach in the context of strategic management accounting that can help the company in planning, control, decision measuring and performance evaluation. No systematic search for the activities to reengineer or for the appropriate performance indicators and related cost drivers is included in the above soft-ware products.
In the following paragraphs, an account of work done within the ESPRIT project REALMS (REen-gineering AppLication using Modeling & Simula-tion) will be presented. This project's goal was to prove that the integration of enterprise modeling, activity based costing (ABC) and simulation to support reengineering is feasible and would lead to considerable bene"ts for the industrial pilot users. The long-term goal of the project is the develop-ment of an integrated methodology and software tool to support business process reengineering and benchmarking in mid-sized European companies. No similar integrated tool existed up to now that combines di!erent scienti"c disciplines (Systems Analysis, Simulation, Cost Accounting, Engineering Economics, Management Consulting).
2. Approach
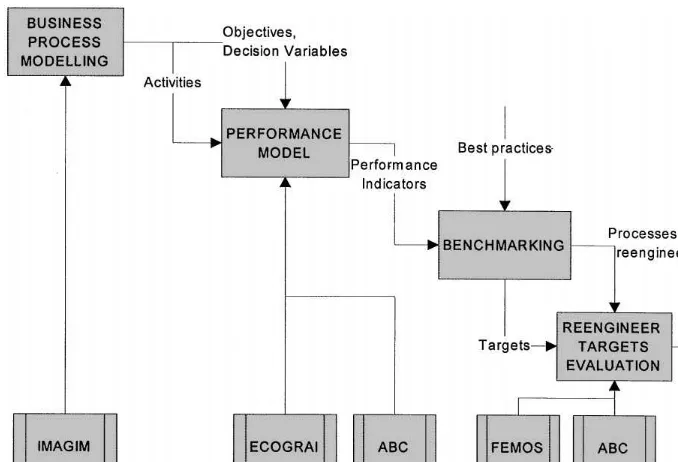
The methodological steps followed in the REALMS project that combine enterprise modeling and ABC for reengineering purposes are the following (Fig. 1). The main di$culty in this kind of project is to detect the activities that need reengineering.
1. Model a pilot users+critical business process. The modeling tools used are those of GRAI Integ-rated Methodology (GIM) [15], i.e. IDEF-0 for the physical and functional views of the business process, GRAI-grids and GRAI-nets for the de-cisional views. Those tools are included in the software product IMAGIM.
2. Develop a performance model for the selected business process. The performance measurement tool used is the ECOGRAI methodology [16] to de"ne performance drivers (time, quality, cost/productivity) in relation to the objectives and the decision variables of the business pro-cess. Activity based costing (ABC) is added here to the ECOGRAI approach in order to support the determination of the right performance indi-cators that are responsible for the business pro-cess costs (cost drivers).
Fig. 1. Overview of the approach.
performance indicators and set targets to be pursued by the reengineering actions.
4. Evaluate reengineering targets. Those targets set in step 3 are usually expressed in the form of operational indicators (e.g. lead times, inventory levels, etc.). Those indicators need to be trans-lated in "nancial terms, a task which is almost impossible to be handled by traditional cost accounting systems. Two di!erent stages are de-"ned at this point: (a) evaluation of the proposed improvement and (b) evaluation during the imple-mentation phase. Activity Based Costing (ABC) seems to be here the ideal approach to calculate Return On Investment (ROI) coming from the improvement of such operational indicators.
A more detailed description of those parts of the above approach that require the integration of Activ-ity Based Costing is presented in the next paragraphs.
2.1. Model a pilot users' critical business process
Among the possible set of processes that repres-ent material/information#ows across the logistics chain, the Customer Order Flow [17] has been chosen in this project as being the most critical
from the pilot users'point of view, in order to be the subject of business modeling and reengineering.
The customer order#ow involves and cuts across the sales, costing, product development, production planning and shipping/distributionfunctions of both pilot industrial users. The two pilots are absolutely complementary across the value chain in the speci-"c user sector of semi-processing of non-ferrous metals. ELVAL (GR) is a producer and supplier of semi-processed aluminum products, while TUBU-SMETALL (D) is a wholesaler of non-ferrous prod-ucts and a producer of components using semi-processed raw materials (Fig. 2). For both of them the customer order#ow is of utter importance due to the vast number of product varieties according to customer requirements.
The processing of customer orders considers the logistics chain from the customer's request to the delivery of the product. The"rst step is to calculate the costs and the delivery date for a customer request concerning the capacity resources, the costs of raw material, etc. Further on, the price which will be proposed to the customer has to be calculated based on the estimated costs.
Fig. 2. The logistics chain of the two pilot users.
with the company. If the negotiation was successful, the negotiated delivery date and price will be"xed in the customer order. After the realization of the customer order the company can post-calculate the costs and the"nal delivery date is known.
2.2. Develop a performance model for the selected business process
The performance model includes a system of key indicators:
1. Operational indicators concerning time-based and process quality (reliability) performance measurement. For the business process and its critical activities chosen in this project (customer order #ow and delivery date/price assignment decisions) this translates into indicators having to do with delivery lead times (time-based) and their deviations (process quality). Another class of quality indicators is thereliability of cost and price estimations used to respond to customer requests.
2. Cost drivers and their reciprocal cost rates de-veloped using the activity based costing (ABC) technique. The activities of ABC coincide to the activities of the activity model developed with GIM, thus making easier communication and integration of the key indicators model. For the customer order#ow process, the ABC technique leads to a more fair distribution ofoverhead costs to customer orders that either require special products/customers or small batch quantities, compared to whatever is considered a standard
product or a normal batch quantity ordered. This permits a better assignment of product prices.
3. Productivity-driven indicesof the customer order
#ow process help to evaluate changes in sales output caused by accepted customer orders and changes in productivity caused by the treatment of those customer orders (e.g. manufacturing or outsourcing) using a pro"tability-based modeling approach. Those indices are based on variable cost calculations that help to de"ne product pro"t contributions and pro"table cus-tomer orders,and therefore they are com-plementary to the ABC cost drivers that deal with the distribution of "xed costs in pricing decisions [3,15,18,19,25].
Fig. 3. A1-level, to create a customer order (activity 1).(REALMS Consortium of WP2 [20].
Fig. 4. GRAI net, to"nd a way to satisfy the request (activity 1.2),(REALMS Consortium of WP3 [3].
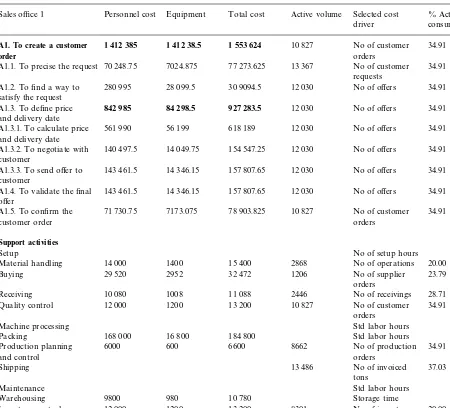
2.2.1. Activity based costing (ABC)
Table 1
The data collection form for activity based costing
Sales o$ce 1 Personnel cost Equipment Total cost Active volume Selected cost driver
% Activity consump.
A1. To create a customer order
1 412 385 1 412 38.5 1 553 624 10 827 No of customer
orders
34.91 A1.1. To precise the request 70 248.75 7024.875 77 273.625 13 367 No of customer
requests
A1.3.1. To calculate price and delivery date
561 990 56 199 618 189 12 030 No of o!ers 34.91
A1.3.2. To negotiate with customer
140 497.5 14 049.75 154 547.25 12 030 No of o!ers 34.91
A1.3.3. To send o!er to customer
143 461.5 14 346.15 157 807.65 12 030 No of o!ers 34.91
A1.4. To validate the"nal o!er
143 461.5 14 346.15 157 807.65 12 030 No of o!ers 34.91
A1.5. To con"rm the customer order
71 730.75 7173.075 78 903.825 10 827 No of customer
orders
34.91
Support activities
Setup No of setup hours
Material handling 14 000 1400 15 400 2868 No of operations 20.00
Buying 29 520 2952 32 472 1206 No of supplier
orders
23.79
Receiving 10 080 1008 11 088 2446 No of receivings 28.71
Quality control 12 000 1200 13 200 10 827 No of customer
orders
34.91
Machine processing Std labor hours
Packing 168 000 16 800 184 800 Std labor hours
Production planning and control
6000 600 6600 8662 No of production
orders
34.91
Shipping 13 486 No of invoiced
tons
37.03
Maintenance Std labor hours
Warehousing 9800 980 10 780 Storage time
Inventory control 12 000 1200 13 200 8301 No of invent.
transactions
20.00
Business process information is enhanced by using a measure of the volume of each activity (or cost driver) to generate a cost rate which could be used not only to cost production but also as a performance measurefor the activity concerned.
2.2.2. Internal cost drivers and induced cost drivers in a manufacturing environment
The customer order promising process (delivery date and price assignment) includes a mix of
execu-tional and decisional activities. Those activities consume internal process resources, mainly of ad-ministrative nature (salaries and other equipment and operational overhead expenses of the sales dept., costing dept. and engineering dept.).
However, the characteristic of the decisional activities of the order promising process in manu-facturing is that they seriously inyuence the factory overhead expenses and the cost drivers of factory support activities. For example order promising decisions to accept special products in-#uence the product sustaining activities, and deci-sions to accept small orders in#uence thebatch level activities. Consequently, we de"ne the so-called in-duced cost drivers of factory support activities (Table 1).
2.3. Target evaluation
This part of the approach follows benchmarking, where examples of best practices have been detec-ted and compared to the existing performance indi-cators of the industrial users. The outcome of benchmarking is a set of processes to reengineer with their associated targets expressed in perfor-mance values.
The component productivity measures that evaluate the performance of a single activity or a relatively small organizational unit (indicators) assist"rst-line managers in improving productivity. Goals are established for the productive use of resources, and actual performance is compared to the predetermined objectives. New thoughts on this subject in relation to advanced manufacturing envi-ronments [21] claim that traditional summary measures of local performance } purchase price variances, direct labor and machine e$ciencies, ra-tios of indirect to direct labor, volume variances }are harmful and probably should be eliminated, since they con#ict with attempts to improve qual-ity, reduce inventories, and increase #exibility. Moreover, direct measurement is needed for qual-ity, process times, delivery performance, and any other operating performance criterion that com-panies want to improve [22].
However, these operational measurements have somehow to show ability to integrate with xnancial measurements in order to support the improvement of the company's bottom line. What is needed is a trans-latorof operational (or logistics) performance indi-cators into "nancial terms having to do with the pro"ts bottom line of the company. The role of this translator is played in our approach by ABC. The
sequence of reengineering targets evaluation during the REALMS project is as follows:
f Performance evaluation compares the documented targets expressed in the form of performance indicators to the actual perfor-mance of the two pilot users during the project. The improvement of performance indicators is measured at the pre-implementation phases by simulation using the FEMOS system [22] and during actual implementation in speci"c time-phased data collection steps. The performance indicators include logistics measures as well as cost/productivity measures.
f Activity based costing is used to translate logis-tics measures into "nancial measures. It is the only accounting method to measure and evalu-ate inventory and lead time policy costs usually not present in the formal cost accounting ledgers. f Economic evaluation will provide "nancial measures at the enterprise level that in#uence the "nancial results of the pilot users' companies. This is the ROI (Return on Investment) of the solutions implemented during the REALMS project.
2.3.1. Proxtability modeling based on overhead costs (ABC)
Fig. 5 shows the basic pro"tability model used. The main di!erence from traditional engineering economics models is that products do not consume resources (production factors) directly (at the unit level). Instead, they consume resources through activities [26]. In our example the Customer Order promising process (A1. to create a Customer Order (C.O.),A12. toxnd ways to satisfy the request, A13. to dexne delivery date&priceaccording to the GIM activity model) should guide the companyto accept customer orders that increase proxtability.
Fig. 5. Pro"tability model.
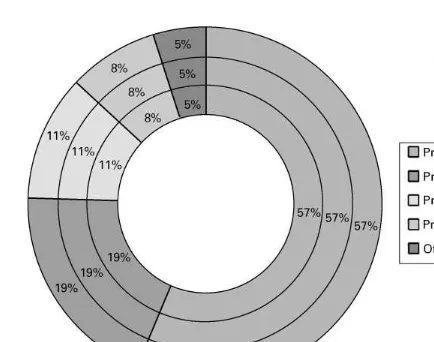
Fig. 6. Percentage activity consumption for ELVAL (GR) in activity A1, to create a customer order.
overhead resources and lower prices to more com-petitive levels for high-volume standard products. With this repricing strategy the company should arrive at a new customer order mix that either makes fewer demands on its resources or generates more revenues for the same consumption of re-sourcesa.
3. Sample analysis and results
A sample analysis was carried out in a six month period for the two pilot users of the REALMS project. In both companies, ELVAL (GR) and TUBUSMETALL (D), the "ve most important product families were identi"ed and information was attained for all of them. For these product groups, the internal and induced cost drivers have been determined. Their volume as well as the rela-tive consumption and costs of the activities have been calculated. These costs are necessary in a fu-ture stage of the project in order to evaluate the following reengineering actions:
f calculate the "nancial impact changing perfor-mance indicators' values,
f reduce the number of activities of the business process (e!ectiveness),
f reduce resource consumption per activity of the business process (e$ciency),
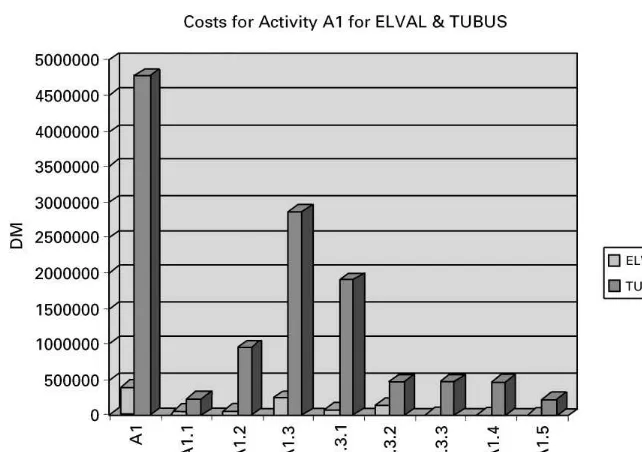
Fig. 8. Comparative results between TUBUS (D) and ELVAL (GR) for the costs in Activity A1: To create a customer order. Fig. 7. Percentage activity consumption for TUBUS (D) in activity A1, to create a customer order.
3.1. Collection of relevant information
With the use of GIM (GRAI Integrated Meth-odology), all the customer order#ow activities were identi"ed. Based on the results of the above meth-odology, we generated a questionnaire form which was suitable for both companies. Questionnaires were given to employees, they were"lled with data and then were returned. It was understandable that some of the necessary information was not avail-able in the databases of the companies in the past, so estimations had to be taken into account. As a result, a"ne-balance should be found between the "lled pre-formatted questionnaires and some face-to-face personal interviews with key employees of the pilot users. Wherever possible, estimations were cross-checked to minimize errors. Con#icting data were not used at all.
3.2. Results
Results are illustrated in the following diagrams, concerning the Activity `to create a customer orderaand the most important support activities.
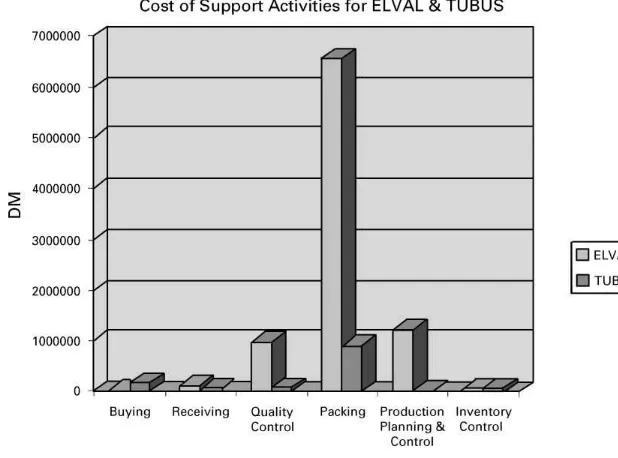
Fig. 9. Comparative results between TUBUS (D) and ELVAL (GR) for the costs in selected support activities.
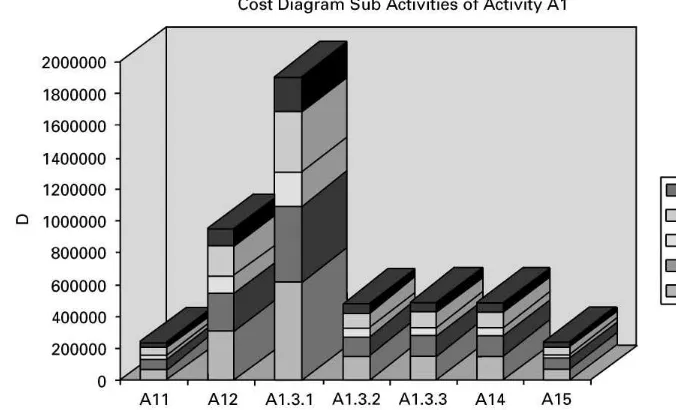
Fig. 10. Costs for sub-activities of activity A1 (to create a customer order) for the 5 di!erent products in ELVAL (GR).
The outcomes of the analysis highlighted many important issues connected with the creation of the customer order for the two companies:
Fig. 11. Costs for sub-activities of activity A1 (to create a customer order) for the 5 di!erent products in TUBUS (D).
activity based management saying that cost can be reduced where cost occurs.
f The cost was allocated to di!erent products and activities. This helped the organization to create a clearer picture of the cost per product sold (Figs. 10 and 11).
f The cost of creation of one customer o!er and order could be calculated (using information from Table 1), giving a good productivity indica-tion of the process. This analysis could not be easily carried out with a di!erent approach. f The cause of cost in each activity was found with
the analysis of di!erent cost drivers for every activity and product (Figs. 6 and 7).
f Finally, the di!erentiation of the two companies could be explained by the generation of benchmarking analyses per product in an activ-ity level, for the creation of the customer order process.
References
[1] G. Perrin, Murphy, Accounting for Managers, Chapman & Hall, London, 1994.
[2] J. Innes, F. Mitchell, Activity Based Costing. A Review with Case Studies, CIMA, 1990.
[3] REALMS Consortium, WP3}A Benchmarking Model, 1996.
[4] J. Bellis, N. Develin, Activity based cost management, Accounting Digest 281 (1992).
[5] T.N. Mangan, Integrating an activity-based cost system, Journal of Cost Management 8 (4) (1995) 5}13.
[6] A.W. Rupp, ABC: A pilot approach, Management Accounting (1995) (January) 50}55.
[7] T.R. Compton, Using activity-based costing in your organization}Part 2, Journal of Systems Management (1994) (April) 36}39.
[8] G. Cokins, Finding the crossroad to change, Bobbin (1994) (August) 50}55.
[9] J. Brown, D. O'Sullivan, Reengineering the Enterprise, Chapman & Hall, London, 1995.
[10] M. Zgorzelski, P. Zeno, Flowcharts, Data#ows, SADT, IDEF0 and NIAM for Enterprise Engineering, IFIP, 1995.
[11] M. Daneva, M. Krumker, ARIS-based Framework for Enhancing Reference Models: Experience in Simultaneous Bid Preparation, IFIP, 1995.
[12] R. Cooper, R.S. Kaplan, The Design of Cost Management Systems, Text, Cases, and Readings, Prentice-Hall, Engle-wood Cli!s, NJ, 1992.
[13] J.P. Borden, Activity-based management software, Journal of Cost Management 7 (4) (1994) 39}47.
[14] T.G. Greenwood, M. Reeve, Process cost management, Journal of Cost Management 7 (4) (1994) 4}19.
[16] G. Doumeingts, F. Clave, Y. Ducq, ECOGRAI
} A method to design and to implement performance measurement systems for industrial organizations, in: A. Rolstadas (Ed.), Benchmarking } Theory and Practice, Chapman & Hall, London, 1995.
[17] A. Rolstadas, Manufacturing industry benchmarking, in: I. Pappas, I.P. Tatsiopoulos (Eds.), Advances in Production Management Systems, North-Holland, Amsterdam, 1993. [18] S. Eilon, G. Cosmetatos, A pro"tability model for tactical
planning, Omega 5 (6) (1977).
[19] G. Cosmetatos, S. Eilon, Analysis of unit cost}A model-ling approach, in: P. Falster, A. Rolstadas (Eds.), Produc-tion Management Systems, IFIP, North-Holland, Amsterdam, 1981, pp. 167}178.
[20] REALMS Consortium, WP2}Modelling a Critical Busi-ness Process, ELVAL SA, Athens, 1996.
[21] R.S. Kaplan, Measures of Manufacturing Excellence, Harvard Business School Press, Boston, MA, 1990.
[22] G. Zuelch, Th. Grobel, U. Jonsson, Indicators for the evaluation of organizational performance, in: A. Rolstadas (Ed.), Benchmarking}Theory and Practice, Chapman and Hall, London, 1995.
[23] R. Cooper, R.S. Kaplan, Pro"t priorities from activity-based costing, Harvard Business Review (May/June) (1991).
[24] C. Berliner, J.A. Brimson (Eds.), Cost Management for Today's Advanced Manufacturing, The CAM-I Con-ceptual Design, Harvard Business School Press, Boston, 1989.
[25] G. Cosmetatos, S. Eilon, E!ects of productivity de"nition and measurement on performance evaluation, European Journal of Operational Research 14 (1983) 31}35. [26] J.A. Theeuwes, J.K. Adriaansen, Towards an integrated

![Fig. 3. A1-level, to create a customer order (activity 1). � REALMS Consortium of WP2 [20].](https://thumb-ap.123doks.com/thumbv2/123dok/3116419.1378567/5.544.30.244.342.591/fig-level-create-customer-order-activity-realms-consortium.webp)