A Method to Select Coherence Window Size for forest height estimation using PolInSAR Data
Sh. Sharifi Hashjin a,*, S. Khazaei b, A. Sadeghi a
a
PhD student, Dept. of Remote Sensing and GIS, Geography Faculty, University of Tehran, Iran - [email protected]
b
Dept. of Civil Engineering, Engineering Faculty, University of Imam Hussein, Tehran, Iran - [email protected]
KEY WORDS: Coherence, PolInSAR, RVOG, Tree height estimation, Window size
ABSTRACT:
Estimating the height of trees is one of the most important applications of polarimetrc interferometric synthetic aperture Radar (PolInSAR). PolInSAR requires an appropriate estimation of the interferogram coherence for obtaining the best results. Actually, the coherence estimation has a great impact on PolInSAR results for estimating the height of trees. Generally, the random volume over ground (RVOG) model is used for forest height estimation. In the ROVG, interferogram coherence entered as one of the observations. For coherence estimation, selecting the best window size conventionally is done by the coherence bias and convergence (CBC) method, which requires user experience and visual analysis. This study presents a fast and straightforward method to calculate the best value of the window size without affecting the user experience and visual analysis. In this study, we compare the performance of tree height estimation for the CBC and the proposed method on three simulated PolInSAR data in a forestry region. Experimental results obtained for estimating the height of trees show that, the window size values obtained by the proposed method are the same as those values obtained by the CBC method. Moreover, results suggest that the proposed method is faster and more stability than the CBC method.
1. INTRODUCTION
Polarimetric interferometric synthetic aperture Radar (PolInSAR) [Cloude, 1998] is a well-developed multidimensional SAR technique that provides the ability to use information of different polarization channels to investigate the object structure and perpendicular layers of scatters. PolInSAR data contain of two images from two different viewing angles obtained in different polarization channels. Estimating the height of trees is one of the most important applications of PolInSAR. Estimating the height of trees is one of the most important applications of PolInSAR. This application has an important role in modern forestry and natural resource management. PolInSAR requires an appropriate estimation of the interferogram coherence for achieving the best results. Actually, the coherence estimation has a great impact on PolInSAR results for estimating the height of trees. Also, to obtain the highest quality information from each channel, the optimal interferogram coherence estimation is required.
In general, forest height estimation is done using Random Volume Over Ground (RVOG) model [Treuhaft, 2005,. Papathanassiou, 2000]. In this model, interferogram coherence entered as one of the observations [Papathanassiou, 2000]. The coherence which is defined as the phase noise is, in fact, the cross-correlation coefficient of an interferometric SAR image pair estimated over a few pixels within a window with a specific size. The magnitude of coherence values ranges from zero to one, where zero means that the interferometric phase is just noise and one represents the complete absence of phase noise [Ruescas et el. 2009]. In practice, the window size can affect the coherence value obtained so that large or too small windows generally resulting in meaningless estimated coherence values. This clearly demonstrates the importance of choosing window size.
The conventional method for choosing the window size in forest areas is the coherence bias and convergence (CBC) method [Cloude, 2005]. The CBC is a visual method on coherence histogram plotted for different values of window size. Hence, choosing the best value for the window size may be difficult and sometimes impossible. To overcome this problem, this study presents a straightforward method to calculate the best value of the window size without affecting the user experience and visual analysis. Due to the lack of real PolInSAR data sets, in this study, we compare the performance of tree height estimation for the CBC and the proposed method on three simulated fully polarimetric airborne InSAR data sets in a forestry region.
In the rest of paper, section 2 provides materials used in this study, including an overview on the coherence estimation, CBC method, and used data set. Section 3 presents the proposed method for choosing the window size using DEM differencing and RVOG model. Experimental results are given in section 4, and finally concluding remarks are provided in section 5.
2. MATERIALS
2.1 Coherence estimation
For each polarization mode, a coherence interferogram can be created between two master and slave images. In fact, complex coherence is the correlation between two complex signals [Born, 1985] and varies from 0 to 1. The empirical complex coherence for ancillary number of samples or pixels can be computed as follows [Abdelfattah, 2001]:
International Archives of the Photogrammetry, Remote Sensing and Spatial Information Sciences, Volume XL-1/W3, 2013 SMPR 2013, 5 – 8 October 2013, Tehran, Iran
= =
Using the maximum-likekihood estimator, the coherence magnitude can be expressed as [Touzi, 1999; Seymour, 1994]:
= =
where ∗ denotes the complex conjugate and L is independent observation that represents the number of pixels surrounding the pixel of interest. It is worthy to note that, selecting a window size determines the value of L.
For forest height estimation, phase and magnitude of the coherence interferogram act similar to height layers. Temporal and volume decorrelation and the noise make difficult building different height layers. Indeed, this problem can be eliminated by optimizing the window size.
Large amount of L cause eliminate partial change in height layer and small amount of L makes reaming effects of noise and time decorrelation. Hence, this study aimed to select the optimized value of L (i.e., the window size) parameter for forming an optimum coherence interferogram in forest height estimation using PolInSAR technique.
However, the magnitude of the normalized complex cross correlation is coherence that is an important interferometric measurement as it provides information about temporal stability and phase difference reliability [Vasile, 2004]. It is possible to compute the empirical coherence on each pixel (x,y) by computing the hermitian product of the complex values of the two images [Prati, 1994]:
e
z
z
(
x
,
y
)
*(
x
,
y
)
=
V
j 21 (3)
where
D
is the coherence, ϕis the phase difference (related to the local altitude of the ground), and Z1and Z2denote the pixels for a pair of polarimetric channels with the different phase and coherence magnitude. The same polarization need to improve coherence estimation arises in order to reduce the estimation bias and variance [Touzi, 1999]. Nevertheless, SAR images are affected, most of the time, by many independent decorrelation factors, such as the Doppler centroid difference, imaging geometry, processing, the thermal noise and so on [Yanjie, 2004]. The overall coherenceH
can then be expressed as a scalar product given by [Ramon, 2001]:process
In fact, in forestry areas for the backscatter structures, volume and temporal decorrelation have more importance. Therefore, choosing a good window size can partially improve the coherent calculation errors caused by these two parameters.
In practice, the window size can affect the coherence value obtained so that large or too small windows generally resulting in meaningless estimated coherence values. This clearly demonstrates the importance of choosing window size.
2.2 The CBC method
The conventional method for choosing the window size is the coherence bias and convergence (CBC) method [Cloude, 2005]. In this method, for difference window sizes, from the lowest possible value (i.e. 1) to a predefined large value (e.g. L=1:15), coherence value is calculated. Afterwards, a coherence histogram is plotted for each window size. As the window size increases a slight overestimation is obtained until for some window size we obtain convergence to an unbiased estimate with variance limited. Then, using user experience, the convergence and the bias of the histogram coherence is evaluated. Finally, a window size that makes a normal coherence histogram (not too stretched or narrowed) with low phase jumping and good convergence is specified visually as the best window size. Since the CBC is a visual method, choosing the best value for the window size may be difficult and sometimes impossible, especially in cases where the histograms are very similar to each other.
2.3 Data set
For tree height estimation in forestry areas, height, species, extinction coefficient, and other parameters are extracted from the ground-based measurements. In this study, for selecting the optimized coherence window just a single ground data plot is required. Phase and the height of trees and ground layers are calculated based on extracted information from these ground truth data. We note that, these two factors are the most important parameters that should be exactly measured in the plot area.
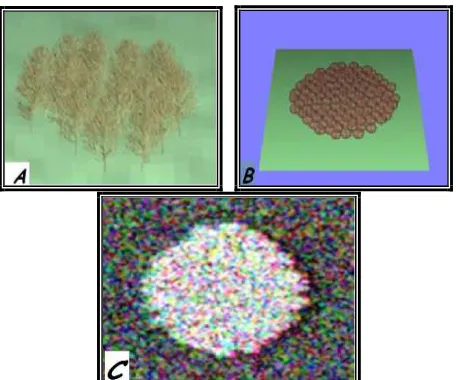
In this study, three simulated terrestrial data are used to create forest plot area. A forestry plot area of 0.5 ha with broadleaf species and dense forest area with a mean height of 10 m is simulated by PolSARPro v.4.0 software [Pottier, 2005] (see figure 1). For this plot, two fully polarimetric master and slave airborne data is simulated. Table 1 shows the characteristics of the simulated images.
Fig.1. Forest species (A), plot density (B), Pauli RGB image (C) International Archives of the Photogrammetry, Remote Sensing and Spatial Information Sciences, Volume XL-1/W3, 2013
SMPR 2013, 5 – 8 October 2013, Tehran, Iran
Table 1: The characteristics of the simulated images
Platform altitude: 3000 m Centre Frequency: 1.30GHz Incidence angle: 45 deg Azimuth Resolution: 1.5 m Horizontal baseline: 10 m Slant range resolution:1.06 m vertical baseline: 1 m
3. THE PROPOSED METHOD
The proposed method determines the best coherence window size using a single ground truth data plot. Afterwards, the height of trees can be estimated for the whole region in the image using the calculated value of L.
In this study, the tree height is calculated using the DEM differencing [Cloude, 2005] between the canopy top and the underlying ground layers. In this way, the height and phase of trees are calculated using the coherence interferogram in HV and HH-VV polarization modes, respectively. This process is accomplished for different values of the window size (L=3:19) and then for each step a different value of the tree height is calculated. As the exact values for these three parameters are available in the plot, at the end of each step the error of each phase layer and the accuracy of estimated tree height are calculated. In this method, choosing the wrong window size directly will be affected on estimated height. By increasing the window size from 3 to a higher value, the accuracy of estimated tree heights and the error value of layers phase are increased. This process continues until the added value of error is greater than the value of improved accuracy. This turning determines the optimal window size for coherence estimation.
4. EXPERIMENTAL RESUALTS
4.1 A demo for the CBC method
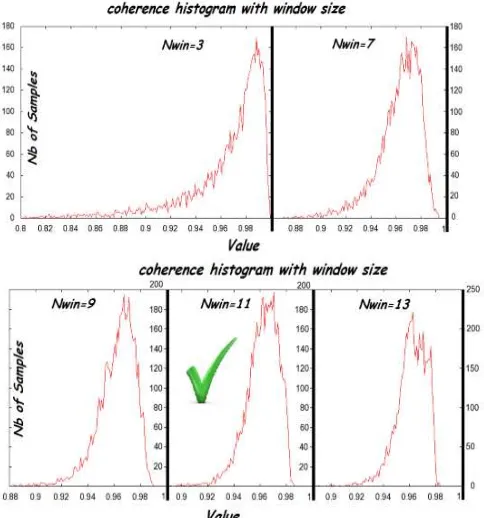
Using the CBC method, coherence histogram is calculated on the study area. Figure 2 shows the best histogram selected. In this figure, coherence histograms for all values of L (i.e., 1:15) are calculated and plotted for L=3, 7, 9, 11, and 13. As can be seen in Fig. 2:
- For L = 3, which the window size is too small, histogram stretching phase jumping and residual bias in the peak of the histogram can be seen.
- For L = 7 a slight improvement is achieved but it is not the optimum value for the window size.
- L= 11 shows convergence and minimum bias.
- For L = 13 and larger window sizes, histogram distribution goes to more narrowing with little change in the peak of the histogram.
- For L= 11, the optimum coherence window size is obtained. - There is a similarity between the histograms for L= 9, 11 and 13. In this case, choosing different value of window size by different user can be effected directly on trees height estimation value.
As a result, personalization, inaccuracy, and the variety of decisions at similar situations are another weakness of the CBC method. Indeed, the selection is more difficult, where the histograms are very similar to each other.
Figure 2. Coherence histograms obtained over the plot for different window sizes (N =3, 7, 9, 11, 13)
4.2 Evaluating the proposed method
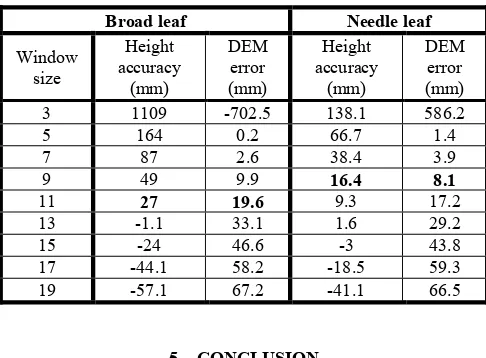
At first, in the plot area the coherence interfrogram is calculated using different window sizes and the average heights of tress. Also, based on the exact phase and height values obtained for the underlying ground and canopy top layers, the accuracy of the trees height and the error of the ground at each step are calculated and evaluated. The relationship between error and accuracy at each stage are shown in Table 2. Highlighted value in this table introduce best value for eliminate noise and phase jumping in coherence interferogram and gives the most accurate center phase of heights layers for achieving priciest calculated tree height.
As shown, in the case of broad leaf, by increasing the window size until L=11 improved accuracy is more than the added error but after that the error is increased. Thus, L=11 is referred to optimal value for the coherence window size. Note that similar to the Figure 2, L=11 is the best window size with this difference that in CBC method, due to the similarity of histograms, there is a probability of selection other window sizes. As a result, the proposed method is not affected by user experience for window size selection and sure us the selected value will lead results to the most accurate value of tree height. Table 3 also shows the results obtained on another region in the area of Pine species with needle leaf where the L= 9 is the best value for the window size. However, in the worst case, compared to CBC the proposed method gives the same results with a higher degree of certainty. Moreover, in critical situations in which selecting the best histogram is very difficult due to a great similarity, the proposed method can easily provide the best window size for achieving the maximum accuracy for the forest height estimation.
International Archives of the Photogrammetry, Remote Sensing and Spatial Information Sciences, Volume XL-1/W3, 2013 SMPR 2013, 5 – 8 October 2013, Tehran, Iran
Table 2: Height accuracy and DEM error obtained in tworegions: broad and needle leaves species
Broad leaf Needle leaf
Window size
Height accuracy
(mm)
DEM error (mm)
Height accuracy
(mm)
DEM error (mm)
3 1109 -702.5 138.1 586.2
5 164 0.2 66.7 1.4
7 87 2.6 38.4 3.9
9 49 9.9 16.4 8.1
11 27 19.6 9.3 17.2
13 -1.1 33.1 1.6 29.2
15 -24 46.6 -3 43.8
17 -44.1 58.2 -18.5 59.3 19 -57.1 67.2 -41.1 66.5
5. CONCLUSION
In this paper, for coherence estimation in forestry areas using PolISAR data a trial and error method for selecting the window size has been proposed. In contrast to the conventional method, called the CBC, the proposed method is ineffective in user experience and visual analysis. The only requirement to use of this method is having the exact ground measurements of a plot in the study area. Experimental results obtained on three simulated fully polarimetric airborne InSAR data sets in a forestry region show that, the window size values obtained by the proposed method are the same as the values achieved by the CBC method. Moreover, the results suggest that the proposed method is faster and more stability than the CBC method for tree height estimation.
REFERENCE
Abdelfattah, R., Nicolas, J.M., Tupin, F., Badredine, B., 2001. InSAR coherence estimation for temporal analysis and phase unwrapping applications. Geoscience and Remote Sensing Symposium. IGARSS '01. IEEE International, Volume: 5, 9-13 Pages: 2292–2294.
Born, M. and Wolf, E., 1985. Principles of Optics: Electromagnetic Theory of Propagation, Interference and Diffraction of Light. Pergamon Press, Elmsford, NJ, USA.
Cloude, S.R., 2005. Pol-InSAR Training Course. AEL Consultants 26 Westfield Avenue, Cupar, Fife, KY15 5AA Scotland, UK.
Cloude, S. R., Papathanassiou, K. P., 1998. Polarimetric SAR Interferometry. IEEE T GEOSCI REMOTE. 36, 1551-1565. Papathanassiou, K.P., Cloude, S.R, Reigber, A., 2000. Single and Multibaseline Polarimetric SAR Interferometry over Forested Terrain, in Proceedings of EUSAR., Munich, Germany.
Papathanassiou, K.P.; Cloude, S.R.; Reigber, A. Boerner, W.M., 2000. Multi-baseline polarimetric SAR interferometry for vegetation parameter estimation. in Proc. INT GEOSCI REMOTE SE. Honolulu, HI, Jul, vol. 6,pp. 2762–2764.
Pottier E., Ferro-Famil L., Cloude S. R., Hajnsek I., Papathanassion K.P., Moreira A., Pearson T., Desnos Y., 2005. PolSARpro v4.0 Software A Versatile Polarimetric SAR Data
Processing and Educational Toolbox. Proceedings of POLinSAR 2005 Symposium,
http://earth.esa.int/workshops/polinsar2005/proceedings.html.
Prati, C., Rocca, F., Guarnieri, A. M. and Pasquali, P., 1994. ERS-1 SAR interferometric techniques and applications. rapp. tech., Politechnico di Milano, ESRIN, Frascati.
Ramon F. H, 2001. Radar Interferometry-Data Interpretation and Error Analysis. Kluwer Academic Publishers.
Ruescas A. B., Delgado J. M., Costantini F., Sarti F. 2010. Change Detection by Interferometric Coherence in Nasca Lines, Peru(1997-2004), Proc. ‘Fringe 2009 Workshop’, Frascati, Italy.
Seymour, M. and Cumming, I., 1994. Maximum Likelihood Estimation for SAR Interferometry. International Geoscience and Remote Sensing Symposium IGARSS’94, Pasadena, volume 4.
Touzi, R., Lopes, A., Bruniquel, J. and Vachon, P.W., 1999. Coherence estimation for SAR imagery. IEEE Transactions on Geoscience and Remote Sensing, 37(1):135–149.
Treuhaft, R.N., Sequeira, P.R., 2000. The Vertical structure of vegetated land surfaces from interferometric and polarimetric radar. RADIO SCI, vol. 35, pp. 141-177.
Vasile, G., Trouve, E., Ciuc, M., Bolon, P. and Buzuloiu, V., 2004. Improving Coherence Estimation f or High-resolution Polarimetric SAR Interferometry. In Geoscience and Remote sensing symposium, IGARSS ’04, Anchorage, USA, volume III, pages 1796-1799.
Yanjie, Z. and Veronique, P., 2004. InSAR Coherence Estimation. IEEE Geosci. Rem.Sens, Proc. IGARSS, pp. 3353-3355.
International Archives of the Photogrammetry, Remote Sensing and Spatial Information Sciences, Volume XL-1/W3, 2013 SMPR 2013, 5 – 8 October 2013, Tehran, Iran