AUTOMATIC NEAR-REAL-TIME IMAGE PROCESSING CHAIN FOR VERY HIGH
RESOLUTION OPTICAL SATELLITE DATA
K. Oštir a, b,
*, K. Čotar a, A. Marsetič b, P. Pehani b, M. Perše c, K. Zakšek d, J. Zaletelj e, T. Rodič a
a
Slovenian Centre of Excellence for Space Sciences and Technologies (SPACE-SI), Aškerčeva 12, 1000 Ljubljana, Slovenia – (kristof.ostir, klemen.cotar, tomaz.rodic)@space.si
b
Research Centre of the Slovenian Academy of Sciences and Arts (ZRC SAZU), Novi trg 2, Ljubljana, Slovenia – (ales.marsetic, peter.pehani)@zrc-sazu.si
c
Sinergise d.o.o., Teslova 30, 1000 Ljubljana, Slovenia – [email protected] d
Institute of Geophysics, University of Hamburg, Bundesstrasse 55, 20146 Hamburg, Germany – [email protected] e
Faculty of Electrical Engineering, University of Ljubljana, Tržaška cesta 25, 1000 Ljubljana, Slovenia – [email protected]
KEY WORDS: Automatic image processing, Geometric corrections, Radiometric corrections, Web mapping, Earth observation
ABSTRACT:
In response to the increasing need for automatic and fast satellite image processing SPACE-SI has developed and implemented a fully automatic image processing chain STORM that performs all processing steps from sensor-corrected optical images (level 1) to web-delivered map-ready images and products without operator's intervention.
Initial development was tailored to high resolution RapidEye images, and all crucial and most challenging parts of the planned full processing chain were developed: module for automatic image orthorectification based on a physical sensor model and supported by the algorithm for automatic detection of ground control points (GCPs); atmospheric correction module, topographic corrections module that combines physical approach with Minnaert method and utilizing anisotropic illumination model; and modules for high level products generation. Various parts of the chain were implemented also for WorldView-2, THEOS, Pleiades, SPOT 6, Landsat 5-8, and PROBA-V. Support of full-frame sensor currently in development by SPACE-SI is in plan.
The proposed paper focuses on the adaptation of the STORM processing chain to very high resolution multispectral images. The development concentrated on the sub-module for automatic detection of GCPs. The initially implemented two-step algorithm that worked only with rasterized vector roads and delivered GCPs with sub-pixel accuracy for the RapidEye images, was improved with the introduction of a third step: super-fine positioning of each GCP based on a reference raster chip. The added step exploits the high spatial resolution of the reference raster to improve the final matching results and to achieve pixel accuracy also on very high resolution optical satellite data.
* Corresponding author.
1. INTRODUCTION
The increasing amount of satellite data coming from large and small Earth observation satellites boosts a need for automatic and fast processing, and opens potential for new and innovative applications.. However, for most end users the main obstacle in using satellite data remains complex and slow processing. Although the steps for satellite image processing are usually known, they are neither automatic nor real-time.
The Slovenian Centre of Excellence for Space Sciences and Technologies (SPACE-SI) developed and implemented a fully automatic image processing chain called STORM that performs all processing steps – from sensor-corrected (usually denoted as level 1; pixel values are at-sensor radiances) optical satellite images to web-delivered map-ready images and products. Individual subtasks were developed by the Research Centre of the Slovenian Academy of Sciences and Arts. The processing chain that works without any operator's intervention currently fully supports RapidEye images of Slovenia and its surroundings. Various parts of the chain were implemented also for WorldView-2, THEOS, Pleiades, SPOT 6, Landsat 5-8, and PROBA-V.
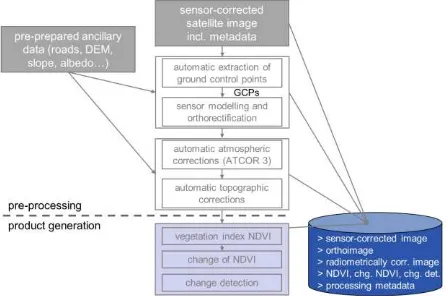
The STORM processing chain (see Fig. 1) includes several automatic steps, which are divided in pre-processing and
product generation parts. Pre-processing is composed by geometric and radiometric corrections, where pixels' locations and values are corrected. The processing part generates thematic products that are aimed to end-users.
There are several output results emerging from a single input image (i.e. orthoimage, radiometrically corrected image, NDVI), all of them stored in the database, along with essential metadata about the processing strategy and parameters (Fig. 1). At the end of the STORM processing chain several interrelated services are delivering data to end-users.
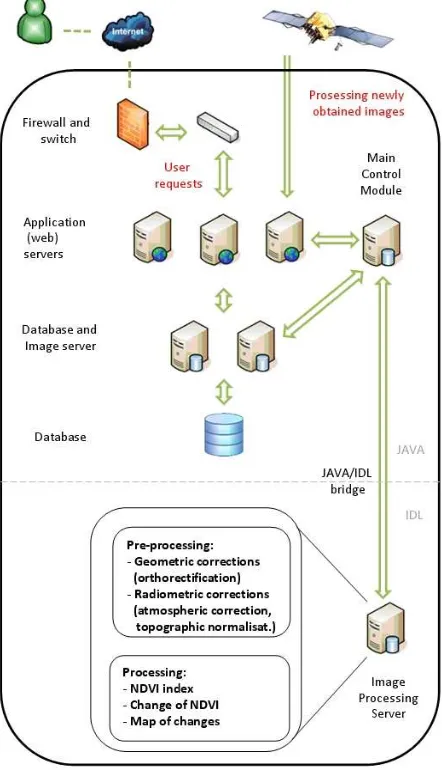
Individual processing steps are prepared as independent IDL or C++ modules and controlled from the Java-based main control module. The Java/IDL Bridge is used to run the individual sub-modules using XML-encoded metadata. The control module is used also to communicate with the web applications and to store/retrieve data to/from the database (see Fig. 2).
During the development so far more effort was dedicated to the pre-processing steps (geometric and radiometric corrections) than to the products generation steps, since an accurate pre-processing is a prerequisite for quality of all thematic products. In the next sections details about the implemented modules are given. Some future plans are outlined in the conclusions.
Figure 2. STORM processing chain system architecture.
2. AUTOMATIC GEOMETRIC CORRECTIONS
The automatic geometric corrections module generates orthorectified satellite images by correcting geometrical distortions of the input image due to relief and imaging geometry.
It is a two-step procedure: first ground control points (GCPs) are automatically extracted, and then the image is automatically orthorectified based on a physical sensor model. This module is of utmost importance, since the whole processing chain depends on the quality of the orthorectified image. Without geometric corrections a remotely sensed image is practically unusable for mapping or spatial analysis with geographic information systems (GIS).
During initial development our goal was to automatically orthorectify sensor-corrected level 1B RapidEye image via the physical sensor model (see Sect. 2.1 and 2.3). In further stages of development – when support to other very high resolution sensors was being added – we had to introduce substantial improvements to GCPs extraction (see Sect. 2.2). Furthermore, a RPC model was also added (see Sect. 2.4), serving as an alternative for the physical sensor model and enabling also orthorectification of input images of higher processing levels (e.g. level 2: ortho-ready images, where additional geometric corrections are already applied), if they are equipped with RPC coefficients.
2.1 Automatic GCP Extraction Using Vector Roads
Automatic extraction of ground control points from multi-temporal and multi-sensor images is an extremely difficult problem, primarily due to temporal variability of objects (Le Moigne et al, 2011.). We have tested several image matching and GCP extraction methods with varying success. Finally, the road network has been proven to present a very stable structure, which can be detected on satellite image with rather straightforward image processing. The automatic GCP extraction algorithm (Zaletelj et al., 2013) performs matching of roads detected on satellite image onto rasterized digital vector road data. Rather than using a single global mapping function we divide satellite image into tiles, which are matched locally. Prerequisite for the method, however, is an accurate reference road layer. We have used the national road database for Slovenia, complemented with the OpenStreetMap for the neighbouring countries.
Figure 3. Workflow of the Automatic GCP Extraction module.
The proposed implementation (Fig. 3) produces up to 10 GCPs for each tile of the satellite image.
processed, where the intensities are somehow inversed (dark roads on bright snowy surroundings).
The obtained image of road candidates is first tiled and rotated by an angle calculated from the satellite image metadata. Then the first step of the matching performs robust estimation of coarse tile translation parameters by minimizing the correlation-based distance between satellite road tiles and the road distance image (i.e. distance from the centre of the road). At the end of this step the matching of tiles, which do not comply to the average transformation parameters or which were not matched at all due to insufficient number of roads, is corrected based on the translation parameters of neighbouring tiles. The second step localizes potential GCPs (we are using significant points such as crossroads) and performs local minimization of matching distances, which results in precise GCPs location in reference coordinate system. The outputs of this sub-module are GCPs equipped with pairs of image pixel coordinates and reference system coordinates, and also with attributes describing their quality.
The algorithm proved to be very robust in respect to the imperfect road detection step. Detection may yield many false positives, e.g. newly built roads that are not yet available in the reference source, or buildings or any other urban structures of similar shape and reflectivity as roads. It may yield also a lot of false negatives – these are all existing roads or parts of the roads that were not detected on the satellite image. However, the overall accuracy is not jeopardised by false positives and false negatives since the number of the detected roads and crossroads is still redundant from the perspective of the algorithm needs.
Figure 4. An example of a GCP matched onto the road distance image. On the left figure dark shades of gray are distances from reference roads; whites are features (possibly roads) extracted from satellite image; yellow cross is the GCP position. On the right figure the same set of features extracted from satellite image (coloured green) is placed over the aerial orthophoto.
Reliability and accuracy of extracted GCPs was tested on a set of fourteen RapidEye level 1B images with spatial resolution of 6.5 m. Thirteen of them present a time series of the same positions were visually inspected and the accuracy of GCPs was evaluated via the bias-corrected RPC model. The root-mean-square error (RMSE) was calculated at 80% best GCPs per image (see Fig. 5). The average of those values of eleven non-winter images is 0.61 pixels. The accuracies of the three non-winter images are notably lower than this average, which is a consequence of greater complexity of image: atmosphere is hazy, landscape is partly covered with snow, shadows are pronounced. The least accurate image (03.02.2011) is so
complex that also manual selection of accurate GPSs was demanding.
The method was found to be robust to imperfect road detection on satellite images as well as to missing roads in map data. Robust image matching was almost entirely successful where digital road data were available and where sufficient part of the road network is visible on a satellite image. The road density derived from available road layers in Slovenia was larger than in the neighbouring counties where OpenStreetMaps were used – in those areas the method yielded smaller (in some cases insufficient) number of GCPs.
Figure 5. Average RMSE in pixels at 80% best extracted GCPs per image, for fourteen RapidEye level 1B images.
2.2 Automatic GCP Extraction for WorldView-2 images
The proposed algorithm for automatic GCP extraction, which yielded good results on RapidEye images, was not delivering comparable results for WorldView-2 multispectral images, which have a very high spatial resolution (VHR) of around 2 m. We have noticed at least two reasons for this. The first reason is deformation of the sensor-corrected satellite images, which is for VHR images very pronounced, probably due to complex imaging geometry (along/across the track viewing angles in combination with asynchronous imaging mode). Imaging geometry deformation hindered the first step, i.e. robust matching of tiles, so that matching of the whole tiles was not possible, if the tile was only subject to affine transformations. It was possible to match the tile locally in one part, but not as a whole.
The second reason lies in the resolution of VHR images itself. In the proposed algorithm roads – more precisely: central lines on the roads – are used as a reference source for matching. Roads' widths are usually 5 to 15 m; this amounts to around one to three pixels in RapidEye resolution, but much more pixels in WorldView-2 resolution. Together with the previously described issues caused by imperfect detection – e.g. false positives such as buildings or urban elements along the roads – which is much more pronounced for the VHR images than for the high resolution images, it is clear that the central line of the road itself is not an appropriate reference source for fine positioning. Last but not least, VHR images have smaller swath, therefore the number of crossroads per image is usually smaller than on a RapidEye image. This substantially smaller redundancy causes problems if some crossroads are not detected well.
The issue with complex imaging geometry deformation was solved by adding coarse image transformation prior to the robust matching. This initial transformation is based on the satellite image corner coordinates obtained from the accompanying metadata file. It is applied prior to all other image matching steps.
To overcome the problem of roads being the source for the fine tuning of GCPs positions, another step was added: super-fine tuning onto the digital aerial orthophotos. Thus, the fine matching onto the roads serves only as a preparatory step for the super-fine matching onto orthophotos. The translation parameters for super-fine matching of the GCP chip are defined by maximising the correlation between image-chip cropped from the perspectively corrected image and image-chip cropped from corresponding aerial orthophoto, where previously both image-chips are subject to the edge filter. Some other methods are still in the testing phase.
Figure 6. Workflow of the Automatic GCP Extraction module, improved for very high resolution WorldView-2 images.
Another important addition to the previous algorithm was the decision to recruit GCPs candidates strictly from the source set of crossroads. This enabled that each GCP candidate was firmly attached onto the crossroad, which during further processing enabled more accurate matching. Moreover, also visual control of the whole process is much easier. The final GCP candidate list includes those crossroads, where detection was successful and matching was accurate. The source crossroads were detected from the reference road images during the pre-processing phase. Each crossroad was equipped with coordinates in the reference coordinate system, and with the attribute numbering the road connections. During the processing the set of used crossroads was reduced depending on the satellite image resolution to reduce the total processing time. Reliability and accuracy of extracted GCPs was tested on a set of nine WorldView-2 images of levels 1B and 2A, acquired in 2010 and 2012. Algorithm with added super-fine positioning step usually extracts more than 100 GCPs per image. The average RMSE at 80% best GCPs of nine images is 0.80 pixels (see Fig. 7). The original 2-step algorithm gives a RMSE of 0.92. The accuracy is thus improved, however, it still does not reach the accuracy of RapidEye images, so the super-fine matching sub-step still requires some further refinements.
Figure 7. Average RMSE in pixels at 80% best extracted GCPs per image, for nine WorldView-2 images of levels 1B and 2A. Blue dots: original 2-step algorithm consisting of robust and fine matching. Red dots: improved 3-step algorithm with the
added super-fine matching step.
2.3 Physical Sensor Model and Orthorectification
The automatic geometric corrections are implemented via two successive procedures: the first one includes the physical sensor modelling, and second one produces GIS-ready image via orthorectification.
Figure 8. Workflow of the Physical Sensor Model and Orthorectification module.
Before the iterative adjustment the GCPs coordinates are corrected for systematic errors, which include Earth curvature and atmospheric refraction.
Model showed to be quite sensitive on the number of available GCPs and their spatial distribution. The best results were achieved with around 100 GPCs per image – however it can provide results also with as little as 6 – which should be spatially distributed as homogeneously as possible.
An extremely important step during sensor modelling is also blunder detection. Because GCP Extraction module delivers some inaccurate GCPs, or GCPs with gross errors, various methods (Robust estimation, RANSAC) for detection and elimination of blunders had to be utilized. The best results were obtained with the combination of both gross error detection methods. First RANSAC is used for the removal of points with big errors, and then the model is optimized with Robust estimation.
Results of the tests for the fourteen RapidEye images can be seen in Table 1. Tests on the images show that the total RMSE at the non-eliminated (i.e. "good") GCPs and RMSE at the independent check points are in most cases far below 1 pixel. The most challenging images were winter images (for the same reasons as stated in the Sect. 2.1), and also the image of the mountainous area from 2013.
Image date
All GCPs
Used GCPs
GCPs RMSE [px]
ICPs RMSE [px]
13.12.2010 55 49 0.79 0.55
27.12.2010 89 81 0.92 1.19
03.02.2011 106 96 1.15 0.94
11.03.2011 329 328 0.74 0.74
03.05.2011 253 246 0.56 0.57
12.05.2011 270 257 0.77 0.64
11.06.2011 327 304 0.57 0.80
07.07.2011 410 401 0.59 0.83
11.08.2011 126 115 0.49 0.47
14.08.2011 369 336 0.67 0.94
15.08.2011 377 347 0.42 0.58
02.09.2011 237 223 0.50 0.56
13.09.2011 269 262 1.04 0.69
01.08.2013 184 166 0.63 1.02
Table 1: RMSE values for fourteen RapidEye level 1B images processed with the physical sensor model. GCPs were reduced by RANSAC and refined by Robust estimation. Independent
check points (ICPs) were manually digitized.
Various iterative steps and controls assure robustness of the model. Nevertheless, robustness remains one of the big challenges of this sub-module. The second challenge is establishing internal model-independent measure for quality of the produced orthoimage.
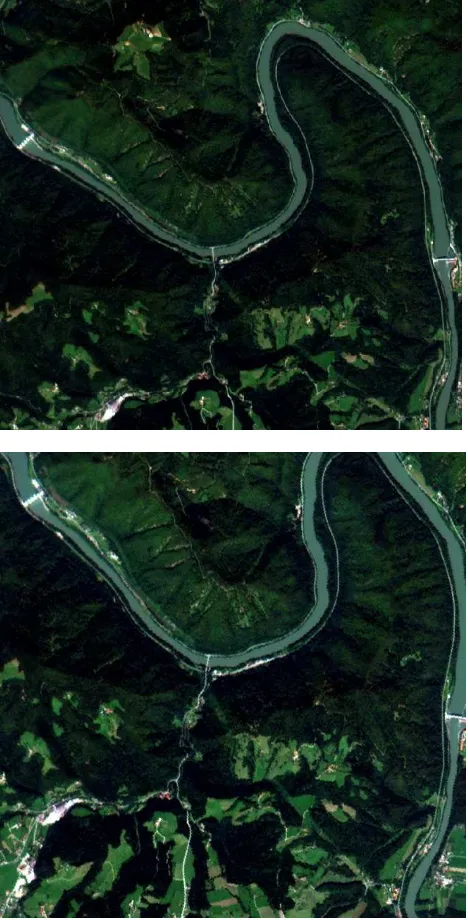
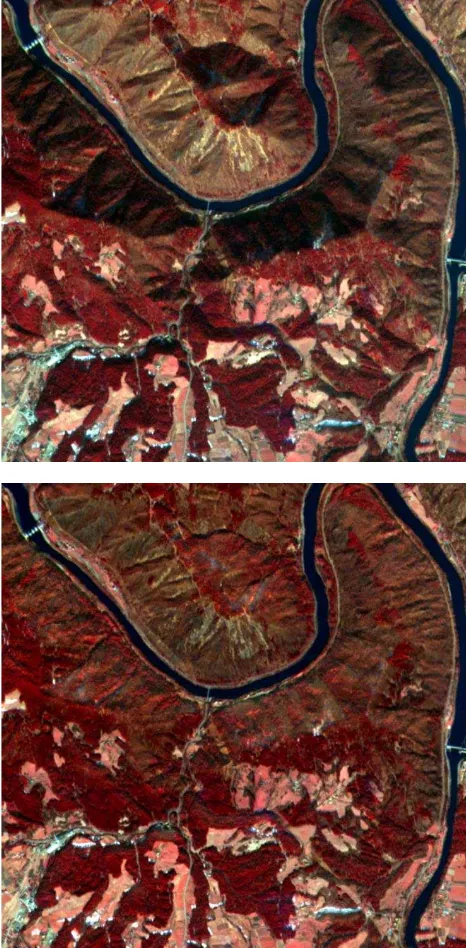
Orthorectification of pushbroom images is done with the indirect method. Relief displacement is corrected pixel by pixel, by computing correct pixel’s position within the orthoimage utilizing a nationwide digital elevation model (DEM) of resolution 12.5 m and the estimated parameters. An orthorectification example can be seen in Fig. 9.
Figure 9. Comparison between RapidEye subsets before (above) and after (below) the orthorectification. On the corrected image
the rotation and translation of the terrain can be noticed.
2.4 RPC Sensor Model
The self-evident requirement for the usage of this model is that the satellite image metadata includes also RPC coefficients, which is not always the case.
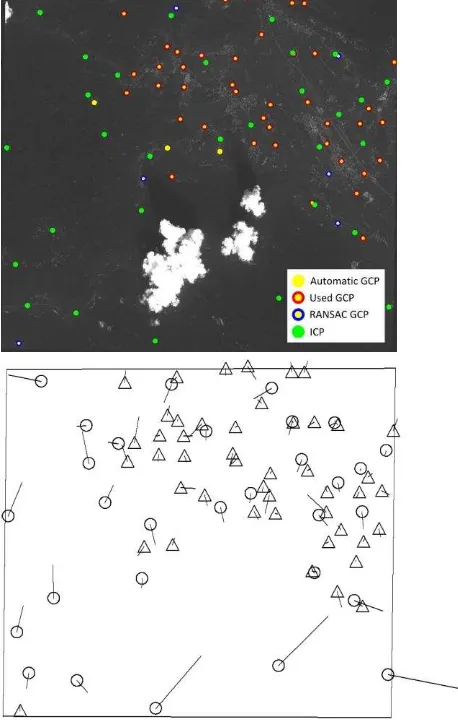
Figure 10. Distribution (above) and residuals (below) of automatically extracted GPCs and of manually digitized ICPs
on the WorldView-2 image, which was processed by the physical sensor model. On the lower image the dependency of the physical sensor model on distribution of the GCPs is clearly
visible – parts of the image without any GCPs (on lower image they are represented as triangles) manifest increased residuals of
ICPs (circles).
Results of the tests for the three WorldView-2 images can be seen in Table 2. Total RMSE at the used non-eliminated (i.e. "good") GCPs and RMSE at ICPs are in most cases at around 1 pixel or slightly larger.
Image location
All GCPs
Used GCPs
GCPs RMSE [px]
ICPs RMSE [px]
Ljubljana L 190 174 1.10 0.91
Ljubljana S 121 110 1.03 1.01
Bled 88 77 1.02 1.20
Table 2: RMSE values for three WorldView-2 level 1B images processed with the RPC model.
3. AUTOMATIC RADIOMETRIC CORRECTIONS
In the STORM processing chain the images are radiometrically corrected in two steps: first atmospheric corrections are applied, followed by topographic normalization.
To eliminate the effects of the atmosphere such as scattering, haze, and to define the extent of clouds and cloud shades, we use the state-of-the-art commercially available ATCOR 3 software package.
On the other hand for the topographic normalization we have developed our own algorithm. For algorithm details and especially evaluation of its results see article titled Topographic Correction Module at Storm (TC@Storm) by K. Zakšek et al., published on the same ISRSE36 conference. Below just the basics of the algorithm are given (Fig. 11).
In general, topographic normalization removes the pseudo-geomorphological errors (which occur due to the shape of the terrain and the angle and time of the observation) with a digital elevation model. It basically eliminates the differences in pixel values due to terrain slope and aspect.
Figure 11. Workflow of the Automatic Topographic Correction module.
The automatic topographic correction module developed by SPACE-SI combines physical approach to topographic correction with Minnaert method (Minnaert, 1941). The total irradiance was modelled as a three-component irradiance: direct irradiance (dependent on incidence angle, sun zenith angle, and slope), diffuse irradiance from the sky (dependent mainly on sky-view factor), and diffuse irradiance reflected from the terrain (dependent on sky-view factor and albedo).
The ratio between diffuse and direct irradiation was estimated using a radiative transfer model. The ratio depends on several factors: wavelength and elevation, the solar zenith angle and atmospheric conditions. To account for all four parameters we prepared look-up tables, with resolution of 1000 m for elevation, 15° for solar zenith angle, 1 nm for wavelength. According to the season we used one of the four standard atmosphere models (tropical, mid-latitude summer/winter and US 1976 standard model).
2012). Since the anisotropy depends on the usually unknown atmospheric conditions, we pre-computed 53 models and from these we estimated the optimal model having the lowest correlation between the simulated illumination and the normalized results.
Shaded versus unshaded parts of the mountainous terrain were not estimated based on geometric relationships, since satellite images may have resolution below 1 m, while topographical data for large areas rarely have resolutions finer than 10 m. In addition, topographical data cannot explain shades caused by the vegetation or urban objects. Therefore the extent of shaded areas was defined through radiometric approach. We utilize histogram thresholding for the ratio between the green and near-infrared band using the Otsu algorithm (Otsu, 1979).
Figure 12. Comparison between false-colour composite image before (above) and after (below) the automatic topographic corrections (detail). On the corrected image the influence of
topography is extensively reduced.
As tests show the shade detection is not always straightforward; if the waters are turbid they may be erroneously flagged as shades. This results in overcorrection of these pixels.
An example of automatic topographic corrections on mixed terrain in north-eastern Slovenia is shown in Fig. 12. Thorough analysis is published in above mentioned article by Zakšek et al.
4. PRODUCTS AND DISSEMINATION
After completing the pre-processing steps end-user products are generated from corrected satellite image. In the STORM processing chain the automatic generation of normalized differential vegetation index (NDVI) is implemented. For RGB-rendering of NDVI fixed colour table is used to enable comparability between the various NDVI products.
Additionally, the administrator can manually trigger the computation of the Change of NDVI product, which compares two sequential overlapping NDVI products, and Change detection product (Veljanovski, 2008), which compares two sequential pre-processed images to define hot-spots of changes between two images.
When processing of individual satellite image is finished, all resulting images and products are immediately served to the end-user via the Java-developed web application, which enables basic web mapping operations, various attribute queries, spatial queries and also downloading of products together with all the processing information and metadata (Fig. 13). In the web viewer all products are displayed as RGB images based on predefined colour schemes or histogram stretch, and are supported by ancillary layers such as aerial images and topographic maps (coming from various sources). Web application includes also an administrative part for control of the processes within the STORM processing chain.
Figure 13. End-user viewer with attribute part (left) and map part (centre and right). For each processed image used GCPs
can also be displayed.
5. CONCLUSIONS
The STORM processing chain was first tailored to RapidEye satellite data. While adding support for the WorldView-2 we were facing many new challenges connected with its very high resolution imagery, especially when adapting the module for geometric corrections. The biggest challenges were: pronounced image deformation due to complex imaging geometry, and image resolution comparable to the resolution of rasterized reference roads.
Various parts of the STORM processing chain support also other pushbroom sensors (THEOS, Pleiades, SPOT 6, Landsat 5-8, and PROBA-V). Support to full-frame sensor of the SPACE-SI small satellite is developed parallel with the satellite development.
Various extensions to the STORM processing chain are being planned. Possible upgrades are: pan-sharpening, image mosaicking, development of specific end-user products (e.g. forestry, agriculture, civil protection, insurance companies), and last but not least support to different regions and coordinate systems.
With quickly accessible satellite products through a web application the end-users will be able to receive data in the office on desktop computers or in the field through mobile devices (smartphones, tablets), which will enable them to make fast decisions based on the most recent data.
ACKNOWLEDGEMENTS
The Slovenian Centre of Excellence for Space Sciences and Technologies (SPACE-SI) was partly financed by the European Union, European Regional Development Fund, and Republic of Slovenia, Ministry of Education, Science and Sport (2010-2013). Research was partly financed by the Slovenian Research Agency project J2-6777.
REFERENCES
Le Moigne, J., Netnyahu, N.S. and Eastman, R.D., 2011. Image Registration for Remote Sensing, Cambridge University Press.
Minnaert, M., 1941. The reciprocity principle in lunar photometry, Astrophys. J., 93, 403, doi:10.1086/144279.
Otsu, N., 1979. A threshold selection method from gray-level histograms. IEEE Trans. Systems Man Cybernet, Vol. 9, pp. 62–66.
Poli, D., 2005. Modelling of Spaceborne Linear Array Sensors, Dissertation, Institute of Geodesy and Photogrammetry, ETH Zurich.
Veljanovski, T., 2008. The problem of false (non-intrinsic) changes in pixel-based change detection on Landsat imagery. Geod. vestn. 52-3.
Zakšek, K., Pehani, P., Oštir, K., Kokalj, Ž. and Pölert, E., 2012. Hill-shading based on anisotropic diffuse illumination, Symposium GIS Ostrava 2012: Surface models for geosciences.