DYNAMIC CONCRETE BEAM DEFORMATION MEASUREMNET WITH 3D RANGE
CAMERAS
Xiaojuan Qi* and Derek Lichti
Dept. of Geomatics Engineering, University of Calgary, 2500 University Dr NW, Calgary, Alberta, T2N 1N4 Canada - (xiqi, ddlichti)@ucalgary.ca
Commission V, WG V/3
KEY WORDS: Close range, Camera, Dynamic, Measurement, Accuracy, Precision
ABSTRACT:
Concrete beams are used to construct bridges and other structures. Due to the traffic overloading or the decaying state of structures, deformation of bridges or other structures occurs frequently. Therefore, the requirement to measure concrete beam deformation, as integral components of structures, is well recognized. Many imaging techniques such as digital cameras, laser scanners and range cameras have been proven to be accurate and cost-effective methods for large-area measurement of deformation under static loading conditions. However, for obtaining useful information about the behaviour of the beams or monitoring real-time bridge deformation, the ability to measurement deformation under dynamic loading conditions is also necessary. This paper presents a relatively low-cost and high accuracy imaging technique to measure the deformation of concrete beams in response to dynamic loading with range cameras. However, due to the range camera measurement principle, target movement could lead to motion artefacts that degrade range measurement accuracy. The results of simulated and real-data investigation into the motion artefacts show that the lower sampling frequency leads to the more significant motion artefact. The results from real data experiments have indicated that periodic deformation can be recovered with sub-millimetre accuracy when the 3 Hz and 4 mm amplitude target motion is sampled at a rate of least 20 Hz and with 31 MHz range camera modulation frequency. When the modulation frequency is 29 MHz, the best sampling frequency is 20 Hz to keep the error under sub-millimetre.
* Corresponding author.
1. INSTRODUCTION
Concrete beams are used to construct bridges and other structures. Due to the traffic overloading or the decaying state of structures, deformation of the bridges or other structures occurs frequently. Therefore, the requirement to measure deformation in concrete beams, as integral components of bridges and other of structures, is well recognized. However, the deformation of the bridge changes because of different traffic loads. In order to monitor the changing deformation, a dynamic imaging technique is necessary to measure an entire structure in situ. The deformation measurements can be used to determine whether the bridges require reinforcement. Different methods can be used to strengthen the old bridges. For example, carbon fibre-reinforced polymer (FRP) composites have been investigated to strengthen existing older bridges and powder actuated fastening systems to attach the FRP strips to the concrete surface was presented by Lamanna et al. (2002). Concrete beams can be strengthened by the addition of steel plates. The efficacy of such methods can be evaluated through fatigue load testing in which cyclic loads are applied to an individual member at laboratory. The laboratory testing also can provide valuable information about a structure’s properties.
Accurate concrete beam dynamic deformation monitoring can be performed with different sensors such as dial gauges, linear-variable differential transformers and laser displacementsensors (LDSs). Maas and Hampel (2006) reported that these sensors provide high geometric precision, accuracy and reliability for measurement deformation. However, the drawbacks are that they are point-wise devices and offer only one-dimensional measurement ability. If two- or three-dimensional measurements are required, those sensors could be useless.
Recently, a great deal of research has been concentrated on deformation measurement with photogrammetric methods in order to obtain large-area and three-dimensional (3D) coverage. Photogrammetric methods comprise terrestrial laser scanning (TLS), traditional photogrammetry with several passive digital cameras and range cameras (RCs). TLS was investigated to measure the deformation of the concrete beam by Gordon and Lichti (2007). However, TLS cannot be used to monitor the dynamic deformation of structures due to its sequential data collection. Traditional photogrammetry can be used to determine dynamic deformation but requires multiple synchronized and oriented images with overlapping fields of view. The RC is an attractive choice for dynamic deformation monitoring for several reasons. First, a single RC can perform video rate 3D measurement of entire surfaces of extended structures such as concrete beams. Second, the RC is compact in size so that they can be mounted easily. Third, the cost of the RC is about an order of magnitude lower than a laser scanner.
Therefore, based on the range camera advantages, Lichti et al. (In press) illustrated how to overcome the range camera drawbacks and obtain high-accuracy static structural deformation measurement. Qi and Lichti (In press) demonstrated that the RCs can be used to monitor the dynamic deformation of a concrete beam subjected to 1 Hz periodic loads with a 10 Hz sampling frequency.
The main purpose of the current research is to measure the deformation of a concrete beam with carbon FRP composites subjected to periodic loads at 3 Hz frequency from a hydraulic actuator using range cameras in a laboratory.
This paper is organized as follows. Section 2 describes the dynamic deformation measurement principle with the range cameras. Section 3 addresses the effect of target motion on the range measurement. Section 4 discusses the fatigue loading experiment conducted on a concrete beam. Section 5 gives the results from both the simulations and the real experiment. Section 6 concludes with the contribution of this research.
2. DYNAMIC DEFORMATION MEASUREMENT PRINCIPLE
2.1 Range imaging measurement principle
Three-dimensional RCs are new generation of active cameras that operate by the time-of-flight principle. A cone of amplitude-modulated near-infrared light signals emitted from a set of integrated light emitting diodes on the camera illuminates the scene to be measured. The reflected light from the scene is focused by the lens onto a solid-state sensor. The received signal is demodulated at each pixel location from the measurement of the cross-correlation function from four successive integration periods (Equations 1-4) to determine the phase difference between the emitted and received signals. And then, the ranges from the RC to the target are derived from the phase differences. For each integration period, the phase of the modulating envelope is shifted by 90°. A detailed description of this principle can be found in Lange and Seitz (2001).
K combination of the four measurements and the range (Equation 6) is derived by scaling the phase difference.
2.2 Deformation measurement from range cameras
The 3D co-ordinates of a point observed by a range camera can be determined by scaling the image point vector by the range point and corrected for systematic errors i = range measurement corrected range errors
Xi, Yi, Zi = object co-ordinates in range camera sensor co-ordinate system
The systematic image point and range errors can be estimated with an integrated bundle adjustment approach to range camera geometric self-calibration (Lichti et al., 2010).
The measurement of beam deformation, the target application described in this paper, can be made from a nadir-looking range camera. The depth (Z) of the target is used to calculate the deformation of the beam (Lichti et al., In press).
3. EFFECT OF THE TARGET MOTION
The range imaging measurement principle assumes that the object is stationary during the four integration periods. However, when the target or the RC is moving during the four integration times, each measurement (Equations 1-4) will contain an additional time-dependent phase shift showed in (Equation 8), which will cause the phase difference to be testing, and the range camera is oriented such that the motion is confined to the radial direction, the periodic change in range is given by Equation (9). Therefore the additional phase shift is
Using Equations 9 and 10, the sampling measurement is thus
The impacts of the target motion on the range measurements are assessed in Sub-section 5.2.
4. EXPERIMENT DESCRIPTION
4.1 Experiment setup
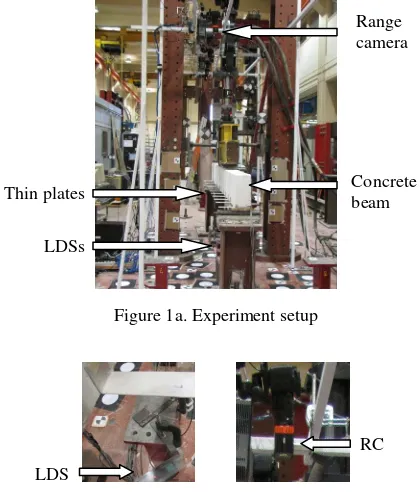
The experiment setup for measuring dynamic concrete beam deformation comprised two RCs, five LDSs and a target system including thirteen thin plates and concrete beam. In addition, a hydraulic-actuator was used to apply the periodically-varying load to the concrete beam through a spreader beam in contact with the top surface of the concrete beam. Figure 1a illustrates the experiment setup for a dynamic fatigue loading deformation experiment which was conducted in the Structural Laboratory at the University of Calgary. Figure 1b shows an LDS and an RC.
Figure 1a. Experiment setup
Figure 1b. LDS and RC
4.1.1 Range cameras
Two SR4000 range cameras developed by MESA Imaging AG were used to capture data for the experiment. They were positioned on each side of the hydraulic actuator with nadir-looking orientation and 1.9 m standoff distance for complete coverage of the concrete beam. The SR4000 has a pixel pitch of 40 µm with a 5.8 mm focal-length lens and the 176 ×144 pixel array size. In addition, it has a non-ambiguity range of 5 m with the default modulation frequency of 30 MHz, though this parameter can be set by the user to one of values (29 MHz, 30 MHz and 31 MHz). The absolute measurement accuracy of the range camera is ±10 mm provided by the manufacturer.
4.1.2 Laser displacement sensors
The deformation measurements were also recorded by five vertically-oriented KEYENCE LKG407 CCD laser displacement sensors positioned directly under the centroid of five of the thin plates. This device measures displacement by active laser triangulation. The manufacturer’s stated linearity and precision for this transducer are 0.05% of the 100 mm measurement range and 2 m, respectively. Therefore, the LDSs were used as a benchmark for assessing the accuracy of the beam deformation measurement with the range cameras.
4.1.3 A target system for measurement
The measurement subject is a 3 m long, white-washed reinforced concrete beam having a 150 mm x 300 mm rectangular cross section. Since most of the top surface of the concrete beam was occluded by the spreader beam, the target system comprised of thirteen white-washed thin aluminum plates (220 mm x 50 mm) were to the side of the beam at an interval of 250 mm along its length.
4.2 Experiment data capture with the range cameras
The periodical loading with 4 mm amplitude (8 mm peak-to-peak displacement) was applied to the concrete beam at a frequency of 3 Hz. Over 36000 load cycles were applied from 24 kN to 96 kN. The range cameras were used to capture the 3D image data.
During the data capture, several quality assurance measures were followed. First, the 3D range cameras had to be warmed up for one hour to obtain stable measurement data. Second
, t
he illumination of the two cameras would interfere with each other if they were operated with the same modulation frequency. Two different modulation frequencies (29 MHz and 31 MHz) were therefore used to prevent light interference. One camera (Cam1) was set 31 MHz modulation frequency and another camera (Cam2) was set 29 MHz modulation frequency. In addition, the integration times for both were set to different values for the data capture: 21 ms, 8.5 ms, 4.4 ms and 2.2 ms for which their corresponding sampling frequencies are 10 Hz, 20 Hz, 30 Hz and 40 Hz respectively. It is also important to note that range measurement to the thin plates were biased by range scattering error (Jamtsho and Lichti, 2010). Since, however, only the relative, periodic motion is desired, the range bias due to scattering at each target location is of no consequence.4.3 Target measurement extraction
Despite the simplicity of the range camera image acquisition,
thin plates bonded to the beam and the top surface of the concrete beam from the RC data requires specialized image processing algorithms. The specialized image processing methods include depth-based classification: Otsu thresholding for amplitude image segmentation (Otsu, 1979), eccentricity classification (Rohs, 2005) and the boundary point removal with image erosion. The specific procedure for target measurement extraction is to refer (Qi and Lichti, In press).
5. RESULTS AND ANALYSIS
5.1 Precision analysis to the range camera measurement
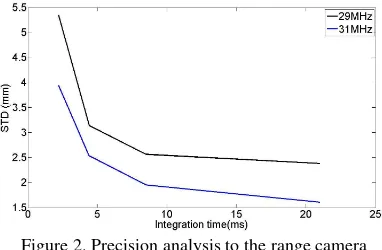
Although the main subject of interest in the point cloud of the range cameras for measuring beam deflection is the thin plates attached to the side of the beam, the top surface of the beam is still useful to analyze the precision of the range camera measurement. The point cloud extraction is based on the procedure mentioned in the Sub-section 4.3. Generally, the top surface is level when the beam is in the zero load state. The standard deviation (STD) of the top surface measurement can be used to evaluate the precision of the RCs. The range camera measurement precision is analyzed with the different modulation frequencies and different integration time.
Figure 2 shows that standard deviation of the beam top surface measurement as a function of integration time and the modulation frequency. As can be seen, the precision of the concrete beam measurement is improved by increasing the integration time under the 29 MHz and 31 MHz. By comparing 2.2 ms and 21 ms the integration time, the range measurement precision improvement is over 55% for both modulation frequencies respectively. In addition, comparing the measurement precision with 29 MHz and 31 MHz at the same integration time, there are significant improvements. The range measurement precision is improved at least 19.3%.
Figure 2. Precision analysis to the range camera
5.2 Target motion effect analysis
The range camera measurement principle presumes that the sensor and the target are stationary. Motion artefacts occur as a result of motion of one or both during the range camera data capture. Therefore, for the dynamic beam experiment, the impact of the motion should be analyzed since the concrete beam was subjected to dynamic loads periodically. Thus, a target experiencing sinusoidal motion with the frequency of 3 Hz and 4 mm amplitude was simulated. The sampling frequencies were set at 10 Hz, 20 Hz, 30 Hz and 40 Hz.
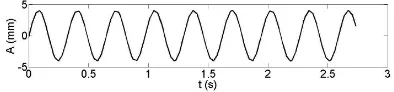
Figures 3a and 3b show the trajectories of the biased signal using the sampling frequencies 10 Hz and 20 Hz. As can be seen, the trajectories of the biased signals are sinusoidal
waveform. However there is a significant trend due to the motion artefacts under 10 Hz sampling frequency. While the sampling frequency is 20 Hz, the trend is small. Figure 4 shows the amplitude differences ( A) and phase difference between the true and estimated target as a function of the frame sampling frequency fs. As can be seen, increasing the sampling frequency results in a reduction of the amplitude error. The maximum difference is -0.53 mm that is 13.6% of the amplitude 4 mm. In addition, when the sampling frequency is 20 Hz, the amplitude difference is -0.14 mm that is 3.43% of the 4 mm amplitude. The phase difference does not affect the amplitude measurement accuracy (Qi and Lichti, In press). So, in order to reduce the motion artefact effect and to keep the deformation measurement error under the sub-millimetre level, the sampling frequency for the range cameras data capture has to be at least 20 Hz when the periodic motion amplitude is 4 mm with 3 Hz frequency.
Figure 3a. Trajectory of the biased signal-10 Hz
Figure 3b. Trajectory of the biased signal-20 Hz
Figure 4. Amplitude and phase differences between true and biased signals
5.3 Trajectory and beam deformation analysis
In this subsection the motion trajectory of the thin plate centroid is evaluated absolutely by comparing the two range cameras and the LDS measurement captured at the same time for one common thin plate. In addition, the maximum beam deformation can be measured by tracking the centroid of the thin plate located at the mid-span of the beam. The evaluation was performed with two RCs using 10 Hz, 20 Hz, 30 Hz and 40 Hz sampling frequencies and an LDS using 300 Hz sampling frequency.
In the beam deformation experiment, the motion of the thin plate centroid is ideally a sinusoidal waveform. The sinusoidal International Archives of the Photogrammetry, Remote Sensing and Spatial Information Sciences, Volume XXXIX-B5, 2012
waveform can be analyzed easily in the frequency domain from which the approximate signal frequency and amplitude can be derived. Therefore, spectral analysis methods were used to analyze the thin plate centroid data. Although, the range camera time series were uniformly sampled, some random drop-outs occurred, which is called the missing data problem. Thus, spectral analysis of the unevenly sampled data was conducted with the Lomb method (Press et al., 1992). Figure 5 shows an example of one thin plate’s motion power spectral density (P) with 30 Hz sampling frequency. As can be seen, there is one dominant peak in the spectrum at the loading frequency. The loading frequency was approximately estimated using the thin plate spectral analysis to be 3.0914 Hz.
Figure 5. Power spectral density of thin plate centroid trajectory with 30 Hz from RC measurement
With the recovered loading frequency, the approximate amplitude of the thin plate trajectory was estimated by the harmonic model (Equation 13) using linear least-squares. Then the amplitude and loading frequency were estimated by the harmonic model with non-linear least squares using the approximate amplitude and loading frequency.
h(t)=Csin2πf0t+Dcos2πf0t+E (13)
Figures 6a, 6b, 6c and 6d show the thin plate centroid trajectories with the four sampling frequencies from Cam1. The trajectories derived from the second camera are similar with the first camera. As can be seen, the thin plate trajectories are the sinusoidal waveform for all different sampling frequencies. However, there is a significant trend in the 10 Hz time series, which is consistent with the simulation data. The trend is small when the sampling frequency is at least 20 Hz.
Figure 6a. Thin plate centroid trajectory-10 Hz
Figure 6b. Thin plate centroid trajectory-20 Hz
Figure 6c. Thin plate centroid trajectory-30 Hz
Figure 6d. Thin plate centroid trajectory-40 Hz
The thin plate trajectory from the LDS measurement was derived using the same procedure as from the RC. Figure 7 shows the same thin plate centroid motion spectral analysis from the LDS. As can be seen, there is one dominant peak in the spectrum at the loading frequency. The loading frequency was approximately estimated to be 3.0781 Hz. Figure 8 illustrates the comparison of the trajectories of the chosen thin plate reconstructed from the 30 Hz sampling frequency RC and LDS data. As can be seen, the estimated trajectories match very well.
Figure 7. Power spectral density of thin plate centroid trajectory LDS measurement
Figure 8. The estimated trajectories of the same thin plate centroid from the RC (30 Hz) and LDS
The amplitudes of the concrete beam deformation have been calculated from the two RCs’ measurements with different sampling frequencies and are reported in Table 1. The estimated maximum deformation and loading frequency derived from the LDS measurements are 4.00 mm and 3.0843 Hz. Table 2 reports the differences to the estimated maximum deformation and loading frequency between the RC and LDS results by the real and simulation data. As can be seen, the biggest amplitude difference is 0.71 mm using 40 Hz sampling frequency for Cam2. The absolute accuracy of the beam deformation with the RC is much smaller than the ±10 mm absolute accuracy reported by the manufacturer. The amplitude differences from both cameras for real data have a similar trend with simulation data. However, for the 30 Hz and 40 Hz Cam2, the amplitude differences are large, which may be due to the poorer data quality as indicated in Figure 2. In addition, for two cameras, International Archives of the Photogrammetry, Remote Sensing and Spatial Information Sciences, Volume XXXIX-B5, 2012
their estimated loading frequency differences are not significant. Therefore, in order to deduct motion artefact effect and to keep the deformation measurement error under sub-millimetre, the sampling frequency for the range cameras data capture has to be at least 20 Hz with the 31 MHz modulation frequency to range camera. And then when the modulation frequency is 29 MHz, the sampling frequency is 20 MHz to keep the error under sub-millimetre.
fs (Hz) 10 20 30 40
Cam1-A (mm) 3.42 3.80 3.86 4.07 Cam2-A (mm) 3.50 3.64 4.51 4.71 Cam1-f0 (Hz) 3.0846 3.0834 3.0853 3.0904 Cam2- f0 (Hz) 3.0841 3.0840 3.0840 3.0845 Table 1. Maximum deformation and estimated loading
frequency from RCs
fs (Hz) 10 20 30 40
Cam1- A -0.58 -0.2 -0.14 0.07
Cam2- A -0.50 -0.36 0.51 0.71
Cam1-STD 2.72 3.18 3.77 5.33 Cam2-STD 3.53 4.13 6.37 11.59
A-predicated -0.53 -0.14 -0.06 -0.04
f0 0.0003 -0.0009 0.001 0.0061
Table 2. Absolute evaluation accuracies by comparing the RC and LDS measurements and simulated amplitude differences
6. CONCLUSIONS
The dynamic concrete beam deformation measurement has been made with sub-millimetre accuracy and precision using two range cameras with different sampling frequencies and different modulation frequencies when the periodic motion is 4 mm amplitude and with 3 Hz frequency. Higher precision the beam deformation measurement is obtained when the range camera is set to a higher modulation frequency. A higher integration time also leads to the higher measurement precision. The paper has shown by simulation and real data of motion artefacts due to the nature of the RC measurement. The motion artefacts were less significant for higher sampling frequencies. The results from real data experiment have indicated that periodic deformation can be recovered with sub-millimetre accuracy when the 3 Hz target motion is sampled at 20 Hz, 30 Hz and 40 Hz with 31 MHz modulation frequency. When the modulation frequency is 29 MHz, the best sampling frequency was 20 Hz to keep the error under sub-millimetre.
ACKNOWLEDGEMENTS
Funding for this research was provided by the Natural Sciences and Engineering Research Council of Canada (NSERC) and the Canada Foundation for Innovation (CFI).
REFERENCES
Elrefai, A., West, S.J. and Soudki, A.K., 2008. Effect of overloading on fatigue performance of reinforced concrete beams strengthened with externally post-tensioned carbon-fibre-reinforced polymer tendons. Canadian Journal of Civil Engineering, 34(11), pp. 1294-1307.
Gordon, S. and Lichti, D., 2007. Modeling terrestrial laser scanner data for precise structural deformation measurement. ASCEJournal of Surveying Engineering, 133(2), pp. 72-80.
Jamtsho, S. and Lichti, D.D., 2010. Modeling scattering distortion of 3D range camera. In: The International Archives of the Photogrammetry, Remote Sensing and Spatial Information Sciences, Newcastle upon Tyne, UK, Vol. XXXVIII, Part 5, pp. 299-304.
Lamanna, A.J., Bank, L.C., Borowicz, D.T., and Arora, D., 2002. Strengthening of concrete beams with mechanically fastened FRP Strips. In: Third International Conference on Composites in Infrastructure, San Francisco, USA.
Lange, R. and Seitz, P., 2001. Solid-state time-of-flight range camera. IEEE Journal of Quantum Electronics, 37(3), pp. 390-397.
Lichti, D.D., Kim, C. and Jamtsho, S., 2010. An integrated bundle adjustment approach to range camera geometric self-calibration. ISPRS Journal of Photogrammetry and Remote Sensing, 65(4), pp. 360-368.
Lichti, D.D., Jamtsho, S., El-Halawany, I.S., Lahamy, H., Chow, J., Chang, T.O. and El-Badry, M., Structural deflection measurement with a range camera. Journal of Surveying Engineering, In press.
Maas, H., and Hampel, U., 2006. Photogrammetric techniques in civil engineering material testing and structure monitoring. Photogrammetric Engineering & Remote Sensing, 72(1), pp. 39-45.
Otsu, N., 1979. A threshold selection method from gray-level histograms. IEEE Transactions on Systems, Man, and Cybernetics, 9(1), pp. 62-66.
Press, H.W., Teukolsky, A.S., Vetterling, T.W., and Flannery, P.B., 1992. Numerical Recipes in C. Cambridge University Press, New York, pp. 575-581.
Qi, X., and Lichti, D., 2012. Monitoring dynamic concrete beam deformation with range cameras. In: FIG Working Week 2012, Knowing to manage the territory, protect the environment, evaluate the cultural heritage, Rome, Italy, In press.
Rohs, M., 2005. Real-world interaction with camera phones. Lecture Notes in Computer Science, 3598, pp. 74-89.