DYNAMICS OF SURFACE MELTING OVER AMERY AND ROSS ICE SHELF IN
ANTARCTIC USING OSCAT DATA
Rajashree V Bothalea*, PVN Raoa, CBS Dutta and VK Dadhwala
a
National Remote Sensing Centre, ISRO
Hyderabad, India, [email protected], [email protected]
Commission VIII, WG VIII/6
KEY WORDS: Antarctic ice shelf, Amery, Ross, OSCAT, Melt, Freeze
ABSTRACT:
Antarctic sea ice sheets play an important role in modulating the climate system. The present study investigates the dynamics of melt/freeze over Amery and Ross ice shelf located in Eastern and Southern part of continent using OSCAT, the microwave scatterometer data from OCEANSAT2. The study utilizes the sensitivity of backscatter coefficient values of scatterometer data to presence of liquid water in the snow caused due to melt conditions. The analysis carried out for four austral winters from 2010-2013 and five austral summer from 2009-2014 showed spatial and temporal variations in average backscatter coefficient over Amery and Ross shelf areas. A dynamic threshold based on the austral winter mean and standard deviation of HH polarization is considered for pixel by pixel analysis for the shelf area. There is significant spatio-temporal variability in melt extent, duration and melt index as observed in the analysis. Spatially, the melt over Amery shelf moves from South to North along coast and West towards inner shelf area. Maximum mean melt occurs on 9th January with January1-15 fortnight accounting for 80% of the melt. Extreme low melt conditions were observed during summer 2010-11 and 2011-12 indicating cold summer. Summer 2012-13 and 2013-14 were warm summer. Year 2014 experienced melt only in the month of January with entire shelf under melt conditions. Practically no melt was observed over Ross ice shelf.
1. INTRODUCTION
Antarctic sea ice sheets play an important role in influencing the climate system. An increase in the western continent melt activity has been observed in the recent past which resulted in
breaking of ice shelf from the
continent(www.antarcticglaciers.org). Continent has many ice shelves of the fringes which respond to exposure to warming air above and warming polar ocean below. Global climate change has a great impact on ice shelves, because they are sensitive to changes in air and ocean temperature or circulation near Antarctica (Wen et al., 2010). Increased atmospheric temperatures lead to surface melting and ponding on the ice surface. catastrophic ice-shelf collapsed tend to occur after a relatively warm summer season, with increased surface melting (Scambos et al., 2009).
Amery ice shelf is the major embayed shelf in East Antarctica. It is fed by massive inland Lambert Glacier basin. The coast line of Amery ice shelf is 550 km and the area is around 60000 sq km. Ross ice shelf is situated in southern part of West Antarctica. As per study by Lampkin & Karmosky (2009), the majority of surface melt is typically confined to the warm areas along the coastal ice shelf margin.
As the temperature of the Amery shelf is above 00C during summer (Chi & Kleni, 2009), wide spread surface melt takes place on the shelf. Because of the inter annual variations observed on the shelf behaviour, there is a need to continuously monitor the melt/freeze status.
In-situ measurements tell about the melting conditions in Antarctic but to get the spatial distribution of melt, active and
passive microwave data has been used in the past by many researchers (Kunj & Long, 2004, Liu & Wang, 2006, Barrand et al., 2013, Kuipers Munneke et. al., 2012). Liu et al. (2006) derived the extent, onset date, end date, and duration of snowmelt in Antarctica from 1978 to 2004 using satellite passive microwave scanning multichannel microwave radiometer (SMMR) and Special Sensor Microwave Imager (SSM/I) data and observed periodic melting over Amery ice shelf and occasional melting over Ross ice shelf.
Wen et al. (2010) estimated that the total area of basal melting in Amery ice shelf is 34700 sq km. Ojha et al.(2011) studied the inter annual variations in surface melting over Amery ice shelf using QuikSCAT data for a period 2000 – 2009. Zhao et al. (2013) monitored the Amery ice shelf front during 2004 – 2012 using ENVISAAT ASAR data and showed that the expansion of the Amery Ice Shelf is slowing down, reflecting a changing trend in climate and ice conditions in East Antarctica.
The present study attempted to investigate the spatio-temporal dynamics in the surface melting along with melt duration over two ice shelves; Amery and Ross over Antarctica.
2. DATA AND METHODS 2.1 OSCAT enhance resolution images
The study utilises Ku band scatterometer data onboard ‘Oceansat-2’ which is 13.6 GHz active microwave scatterometer which operates in dual polarisation mode of HH and VV and provides daily coverage of the polar regions. Enhanced resolution daily images at 2.25km resolution for both The International Archives of the Photogrammetry, Remote Sensing and Spatial Information Sciences, Volume XL-8, 2014
polarisation were downloaded from the website http://www.scp.byu.edu for the period of November 2009 to February 2014. Images were extracted for Amery and Ross ice shelf. Figure 1 shows the location index of shelf along with location of test sites on Amery shelf and Automatic Weather Stations (AWS).
Figure 1. Location of AWS stations (Yellow triangle) and test sites (Blue filled circles) on Amery and Ross ice shelf
2.2 OSCAT response
To understand the behaviour of OSCAT response to different snow/ice conditions, time series of Backscatter coefficient (σ0) values were plotted for the test sites on Amery shelf (Figure 2) and AWS sites on Ross shelf (Figure 3). From Figure 2 it is clear that there is steep reduction in the σ0 of the order of 15dB or more during austral summer. Normalised radar backscatter is sensitive to the water content of snow. With the increase in the liquid water content in the snow, there is a sudden decrease in the backscatter from radar. After studying the time series for HH and VV polarisation along with polarisation ratio (σ0
VV-σ0
HH) and polarisation index(σ 0
VV-σ 0
HH/σ 0
VV+σ 0
HH), it was
decided to use σ0
HH due to greater dynamic range and sensitivity of HH polarisation to liquid water content.
Figure 2. Time series of σ0HH(dB) for September 2009 to February 2013 over 5 test sites on Amery shelf
It is also clear from Figure 2 that the backscatter response varies spatially over Amery shelf. This limits the use of fixed threshold for detection of melt.
Figure 3, which depicts the backscatter response from Carolyn and Elaine stations of Ross shelf, indicates no reduction in backscatter response over the observed years except in the beginning of year 2010. It is indicative of no melt over the shelf. Interestingly, the σ0
HH values for frozen surface conditions
at Elaine are significantly lower (around -10.0dB) compared to other stations (around -7.5dB). This needs further investigation.
Figure 3. Time series of σ0HH(dB) for September 2009 to February 2013 for test sites on Ross shelf
2.3 AWS Temperature data
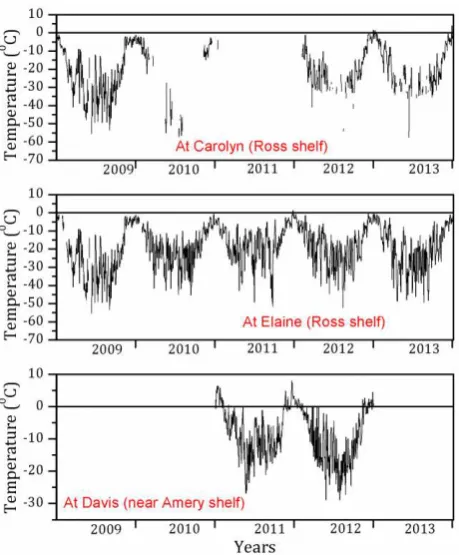
AWS data for Ross ice shelf was obtained from UW, Madison for the study period of 2009 to 2013. The Elaine station is located at -83.0940(Lat) & 174.2850 (Long) and Carolyn station is located at -79.9390 (Lat) and 175.8840 (Long). The data pertaining to Davis station (-68.5760, 77.9670) (Figure 1) which is the nearest AWS station to Amery ice shelf, was obtained from the Australian Antarctic Division (http://data.aad.gov.au/aadc) for the years 2011 and 2012. Figure 4 shows the time series of temperature at Carolyn and Elaine (Ross ice shelf) and at Davis (Near Amery ice shelf).
Figure 4. Time series of temperature at Carolyn and Elaine (Ross ice shelf) and at Davis (Near Amery ice shelf)
The temperature time series at Carolyn and Elaine(Figure 4) show that the temperature remained below freeze condition throughout the study period. In the absence of above freeze temperature possibility of occurrence of melt is less. This gets correlated with σ0HH time series shown in Figure 3 where no
reduction in σ0
HH is visible. Temperature at Davis station reached above freezing conditions for considerable days and The International Archives of the Photogrammetry, Remote Sensing and Spatial Information Sciences, Volume XL-8, 2014
hence melts conditions through lowering of σ0HH caused by presence of liquid water were observed over Amery shelf (Figure 2).
2.4 Melt/Freeze detection
To identify the melt / freeze condition, austral winter mean (σ0
HHMW), standard deviation (σ0HHSDW) and drop in σ0 for austral summer (σ0HHDS) were calculated for test sites (Table 1).
Average Backscatter coefficient (dB)
Amery 2010 2011 2012 2013
σ0
HHMW -4.12 -4.91 -4.75 -4.46
σ0
HHSDW 0.63 0.57 0.37 0.58
σ0
HHDS 13.72 10.69 15.53 22.19
Ross 2010 2011 2012 2013
σ0
HHMW -8.79 -9.58 -9.44 -9.55
σ0
HHSDW 0.31 0.31 0.31 0.31
σ0
HHDS 1.86 1.11 0.97 1.32
Table 1: Winter mean, standard deviation and drop in backscatter during summer for Amery and Ross shelf sites
The analysis of winter data indicates that there is minor variation during winter months. Any deviation in backscatter response is associated with austral summer. Looking to the spatial variability in backscatter response from Amery and Ross shelf, a dynamic threshold based on the austral winter mean and standard deviation of HH polarization is considered for pixel by pixel in the shelf area. A melt pixel (MP) is that pixel which satisfies the criteria:
MP = true, if σ0
HHn< (σHHMW– 2*σ0HHSDmax) ………. (1)
MP =False, if σ0
HHn≥ (σHHMW– 2*σ0HHSDmax) ……….(2)
Where σ0
HHn is the HH backscatter for nth day and σ0HHSDWmax is the maximum standard deviation of austral winter HH backscatter for the study area. A dynamic threshold helps in capturing the backscatter characteristics of individual pixel caused by its location in the ice shelf area.
3. RESULTS AND DISCUSSION
Based on the variable threshold logic, date wise data was analysed to identify melt pixels. Practically no melt was observed on Ross shelf. This can also be visualised from the temperature time series shown in Figure 4 for Carolyn and Elaine points over Ross shelf where temperature remained at freezing conditions. The results for Amery shelf are presented here.
3.1 Temporal variation in melt / freeze
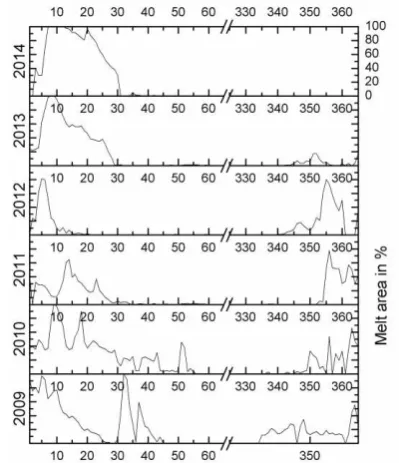
Temperature and backscatter profiles confirm the austral summer months as December – January in Antarctic. Continuous melt areas can be seen from Figure 5 which shows julian day wise percent melt area over Amery ice shelf for the year 2009 – 2014. As evident from Figure 5 there is a variation in melt area vs Julian day for all the years. 2011 and 2012 experienced early melt over entire shelf in December. Entire shelf is under melt condition during January 2014. In 2010, melt occurred in February in around 40-50% of the shelf area.
Figure 5. Julian Day wise % melt area over Amery ice shelf for the years 2009 – 2014. X axis represents Julian days.
Looking at the variability in melt/freeze onset days and the extent of area in melt condition, we delineated the daily melt extents for all the study years. To understand the seasonal cycle of surface melt over Amery shelf, daily melt extent values are averaged to get date wise average melt extent. Figure 6 shows day wise average melt area in % starting from July 1 onwards. Figure 6 shows the typical melt cycle. The melt begins to increase from December and by end of December there is rapid rise in melt extent. Early January observes the maximum melt with peak occurring on 9th January. By mid-February, the melt starts reducing and by February end, freezing begins.
Figure 6. Seasonal variation of mean (2009-2014) melt extent. Vertical axis shows the mean % melt area and x axis shows the days from July onwards at 30 days interval.
3.2 Snowmelt duration
Using the backscatter values from OSCAT and the melt logic, binary melt images were generated where the melt pixel is represented by one. By combining the images, melt duration image is generated. Histogram of number of melt pixels vs number of melt days for different years is shown in Figure 7. There is year to year variation in melt duration of the pixels. The International Archives of the Photogrammetry, Remote Sensing and Spatial Information Sciences, Volume XL-8, 2014
Around 50% shelf area has melt duration < 10 days during 2010-11 and 2011-12 where as in 2013-14 it reduced to 5%. Around 25% of the melt areas in 2009-10 and 2012-13 experienced melting of less than 10 days in a year. Around 15 to 40% of the shelf area experienced melting of 11-20 days during different years. Except 2013-14, all other years saw around 10-20% of shelf area under melt for three to four weeks. About 15% of the shelf experienced melt for more than one month.
Figure 7. Year wise distribution of number of melt days and the number of melt pixels over Amery shelf. Bar graph shows the frequency distribution of melt duration
3.3 Spatial variability in melt/freeze
Figure 8 shows the spatial and temporal distribution of melt for the year 2010-11. These images show the changes in melt extent over space and time. Melt zone initiates near coast in South of shelf and expands Northwards and Westwards towards inner shelf area as the summer progresses. Reverse trend is observed during freezing with inner part of shelf getting refreeze earlier. Similar trend is observed for other years also. In 2012-13 and 2013-14 entire ice shelf was under melt (Figure 5).
Figure 8. Spatio-temporal distribution of melt over Amery during 2010-11. Melt pixels are shown in blue colour. The first image is for December 01and last image is for February 28 with dates increasing row wise
3.4 Inter annual variability in melt
Figure 9 shows the spatio-temporal distribution of melt over Amery shelf for different years.
Figure 9. Spatial distribution of melt duration for different years over Amery shelf.
To study the inter annual variability in melt, melt index suggested by Zwally & Fiegles (1994) is used which is defined in equation 3 as
Ni
mdi
A
MI
1
.
…… (3)Where A is size of one pixel, mdi is the number of melt days for the pixel i and N is total number of pixels. By accounting melt extent and the melt duration, this index gives indication for total melt in any year. Melt index(MI) was calculated for 2009-2014 period. Melt area (MA) was calculated by counting number of pixels with melt duration of one day or more and multiplying by area of each pixel. Time series of Melt index and melt area is shown in Figure 10.
Figure 10. Interannual variability of melt area and melt index The International Archives of the Photogrammetry, Remote Sensing and Spatial Information Sciences, Volume XL-8, 2014
Melt index was minimum in 2011-12 which again increased in subsequent years. The melt area is more or less constant with difference being only 1026 sq km between maximum and minimum extent. From Figure 10 we can infer the summer conditions over shelf. High MI and high MA are indication of warm summer (2012-13 & 2013-14). Years 2010-11 and 2011-12 appear to be the mild summers with low values of MI and MA.
CONCLUSION
In the present study melt extent, duration and melt index was calculated using OSCAT scatterometer data for the period 2009–2014 which includes 5 austral summer using dynamic threshold method. Information about snow melt and freeze is important in climate modelling. Since Ross shelf did not experience much melt, results for Amery shelf are discussed. Most of the melt phenomena are associated with temperature with above freezing temperature causing melt conditions. There is lot of spatio-temporal variability in melt extent, duration and melt index as observed in the analysis. There is no clear cut trend due to low melt conditions observed between 2011—13. Year 2012-13 and 2013-14 indicate warm summer due to high MI and MA. Spatially the melt over Amery shelf move from South to North along coast and West towards inner shelf area. Maximum mean melt occurred on 9th January with January1-15 fortnight accounting for 80% of the melt. Melting over Amery ice shelf is quite severe and widespread. Continuous monitoring of ice shelf is important towards understanding global climate change.
ACKNOWLEDGEMENTS
Authors are thankful to Australian Antarctic Division for providing temperature data for AWS stations. The authors appreciate the support of the AMRC, SSEC, UW-Madison for temperature data of UW AWS stations in Antarctica.
REFERENCES
Barrand, N.E., Vaughan, D.G., Steiner, N., Tedesco, M., Kuipers Munneke, P., Broeke, M.R. and Hosking, J.S. 2013. Trends in Antarctic Peninsula surface melting conditions from observations and regional climate modeling, J. Geophys. Res., Earth Surface, 118, doi:10.1029/2012JF002559.
Chi, Zhaohui and Klein, Andrew. 2013. Temporal Variation in Land Surface Temperatures of Lambert Glacier-Amery Ice Shelf System (LGAISS). 66th Eastern snow conference, Niagara-on-the-Lake, Ontario, Canada 2009.
http://data.aad.gov.au/aadc
http://www.scp.byu.edu
Kuipers, M., Picard, P.G., Broeke, M.R., Lenaerts, J.T.M. and Meijgaard, E. 2012. Insignificant change in Antarctic snowmelt volume since 1979, Geophys. Res. Lett., 39, L01501, doi:10.1029/2011GL050207.
Kunz, L.B., and Long, D. 2004. Melt Detection in Antarctic Ice-Sheets using spaceborne scatterometers and radiometers. IGRASS2004.
Lampkin, D.J. and Kamosky, C.C., 2009. Surface melt magnitude retrieval over Ross Ice Shelf, Antarctica using coupled MODIS near-IR and thermal satellite measurements. The Cryosphere Discuss., 3, 1069–1107, 2009 www.the-cryosphere-discuss.net/3/1069/2009/
Liu, H., Wang, L. and Jezek, K.C. 2006. Spatiotemporal variations of snowmelt in Antarctica derived from satellite scanning multichannel microwave radiometer and Special Sensor Microwave Imager data (1978–2004), J. Geophys. Res., 111, F01003, doi:10.1029/2005JF000318.
Ojha, S.R., Singh, R.K.K., Vyas, N.K. and Sarkar, Abhijit, 2011. Study of inter-annual variations in surface melting over Amery Ice Shelf, East Antarctica, using space-borne scatterometer data. J. Earth Syst. Sci. 120, No. 2, April 2011, pp. 329–336.
Scambos, T., Fricker, H.A., Liu, C.-C., Bohlander, J., Fastook, J., Sargent, A., Massom, R., and Wu, A.-M. 2009. Ice shelf disintegration by plate bending and hydro-fracture: Satellite observations and model results of the 2008 Wilkins ice shelf break-ups. Earth and Planetary Science Letters, 2009. 280(p. 51-60.
Wen J., Wang, Y., Wang W., Jezek K.C., Liu H. and Allison I., 2010. Basal melting and freezing under the Amery Ice Shelf, East Antarctica. Journal of Glaciology, Vol. 56, No. 195, 2010.
www.antarcticglaciers.org
Zhao C., Cheng X., Hui F.M., et al. 2013. Monitoring the Amery Ice Shelf front during 2004–2012 using ENVISAT ASAR data. Adv Polar Sci, 2013, Vol 24, No 2, pp 133-137, doi: 10.3724/SP.J.1085.2013.00133