SCALING UP CLOSE-RANGE SURVEYS, A CHALLENGE FOR THE
GENERALIZATION OF AS-BUILT DATA IN INDUSTRIAL APPLICATIONS
J.-F. Hullo a, *, G. Thibault a
a
EDF R&D, SINETICS, 92140 Clamart, France ([email protected])
Commission V, WG V/4
KEY WORDS:
as-built data, terrestrial laser scanner, panoramic images, CAD models, industrial applications, large scale scanning surveys
ABSTRACT:
As-built CAD data reconstructed from Terrestrial Laser Scanner (TLS) data are used for more than two decades by Electricité de France (EDF) to prepare maintenance operations in its facilities. But today, the big picture is renewed: ”as-built virtual reality” must address a huge scale-up to provide data to an increasing number of applications. In this paper, we first present a wide multi-sensor multi-purpose scanning campaign performed in a 10 floor building of a power plant in 2013: 1083 TLS stations (about 40.109 3D points referenced under a 2 cm tolerance) and 1025 RGB panoramic images (340.106 pixels per point of view). As expected, this very large survey of high precision measurements in a complex environment stressed sensors and tools that were developed for more favourable conditions and smaller data sets. The whole survey process (tools and methods used from acquisition and processing to CAD reconstruction) underwent a detailed follow-up in order to state on the locks to a possible generalization to other buildings. Based on these recent feedbacks, we have highlighted some of these current bottlenecks in this paper: sensors denoising, automation in processes, data validation tools improvements, standardization of formats and (meta-) data structures.
* Corresponding author.
1. CONTEXT AND CONTRIBUTIONS
Industrial installations need constant maintenance operations to keep performance and safety at their highest levels. In the last decades, as-built data (Terrestrial Laser Scanner data –TLS-, as-built CAD models reconstructed form scans, panoramic images) have proven their efficiency for preparing decision and executing several maintenance operations. But today, the big picture is renewed: ”as-built virtual reality” must address a huge scale-up to provide all the current and incoming applications that rely on these data sets. For example, at Electricité de France (EDF), owner and operator in France of 58 nuclear power stations, many use cases have been recently developed for maintenance of the plants using as-built virtual reality. From a few areas, many buildings will soon be digitized. Surveyors on field switch from “modest” surveys with 50-100 stations to very large surveys with at least 1000 stations. Computers, software, storage and networks change from handling Megabytes to hundreds of Terabytes of data: this is no more business as usual.
In this context, through this paper, our contributions are the following:
depicting the current trends of industrial close-range as-built data creation for industrial uses at EDF, by describing real cases, scales and issues,
sharing feedbacks from a first wide multi-data close-range acquisition campaign (1083 TLS stations, 1025
High Resolution panoramas, 2D maps and 3D models as-built reconstruction and processing),
highlighting short and medium terms challenges of close-range acquisition tools and methods for the widespread use of as-built data within industrial processes, in light of the current research state of the art.
2. AS-BUILT DATA FOR INDUSTRIAL OPERATIONS: PRESENT AND FUTURE
The topographic surveys of industrial facilities are one of the means for carrying out various dimensional control missions. New uses as-built documentation are challenging both tools and methods by imposing different constraints for data: precision, accuracy, resolution, spatial extent, acquisition costs and risks of impact on operation in the real plant. In other words, close-range tools and methods used for as-built documentation of indoor complex scenes face a daunting challenge: the move to very large scale.
2.1 Current use of as-built geometric data at EDF
As-built geometric data are being used for more than two decades in the industry as well as at EDF for specific industrial applications that make use of simulation to prepare maintenance operations, for example (Sebok et al., 2002) or (Mól et al. 2009).
ADRM, a Virtual Reality Decision Aid application (in French : « Aide à la Décision Rapide de Maintenance »), has been developed at EDF in 2005 to perform simulations of trajectories to design the best scenario for replacing a heavy equipment, by making use TLS point clouds and 3D as-built CAD models (Marc et al. 2010). These case studies require a dense and accurate dataset due to the 3 cm tolerance of the study. Until now, only limited areas – about 5-10 m radius- need such detailed geometric representation (bends, doors or hatchways for instance).
Another application, SAAM-Colisage, make use of an as-built CAD model to optimize the planning of freight handling in power plants (Marc et al., 2009). The resolution on the data sets is more about a 10 cm tolerance, but on a larger area, such as a floor of 30 m x 30 m.
Figure 1: ADRM and SAAM-Colisage rely on as-built data to help maintenance operations in nuclear plants at EDF.
For these current surveys, TLS data are typically acquired through a few stations (up to 50). Registration and referencing, in a specific datum related to the plant, are performed with a 1 cm error tolerance. Total stations are used for traversing some targets used in the referencing, as described in (Hullo et al., 2011).
2.2 Increasing usages of as-built documentation
Several in-house research projects have shown the value of using together multiple types of as-built data-sources (2D maps, 3D as-built CAD models, panoramic images) to help professionals preparing their operations by visiting virtually the mockup, Figure 2. These prototypes, supported by upstream research on their relevance for the users, have been tested in operation, helping the definition of many needs driven by several professional practices. Such multi-purposes applications help the people working together, collaborating and sharing experiences. In these use cases, data is the key: content, level of detail, reliability, etc.
Figure 2: VVPro, offering for the user an experience similar to a bundle of Google Maps + Street + Earth, is one of the of virtual visit developed at EDF to fulfil increasing needs associated to maintenance operations. Multiple as-built data types are synced during the visit (maps, 3D models, panoramic images).
Virtual tours of plants require a completeness of data that previous uses, more localized, were not asking. As a result, field surveys become large-scale acquisition campaigns of one or several multi-floor buildings. Most surveys now use TLS that produce fast, dense and accurate point clouds. These data sets are today mainly use as a raw observation that allows creating as-built CAD models.
For these campaigns, the tolerances and specifications remain nearly identical to those already used for local surveys. But the order of magnitude is no longer the same, putting to the test all the steps in the workflow of current practices. Despite the development of many robotic systems and dedicated algorithms for quick capture of interiors such as (Bailey and Durrant-Whyte, 2006) or (Whelan et al., 2013), none seems to meet the characteristics required for the maintenance of power plants.
Given the emergence of virtual reality-related needs, the generalization of large-scale surveys is the next step for EDF. The achievement of that goal will address common and specific needs of many maintenance operations at the scale of an entire building, with almost centimeter accuracy.
3. CAPTURING CLOSE-RANGE AS-BUILT DATA IN LARGE AND COMPLEX MULTI-FLOOR BUILDINGS
Due to the scale and requirements of the acquisition campaign and because of the constraints inherent to facilities, the definition of appropriate tools and methodologies for the data capture is a crucial step. To reduce acquisition time and costs, the multi-sensor and multi-purpose acquisition is made once, while the most demanding of all needs specifies the level of selected accuracy, completeness, etc.
3.1 Feedback of a wide multi-sensor close-range acquisition of a 10 floored complex plant performed in 2013
In 2013, EDF completed a first very large scale multi-sensor scanning survey on a nuclear reactor building composed of more than ten floors. The industrial goal of this scanning survey was to feed the first time applications of as-built virtual tours and maintenance inspections with as-built data of a complete building of a facility. The whole survey process (acquisition and processing, tools and methods) underwent a detailed follow-up in order to decide on a possible generalization to other buildings and power plants.
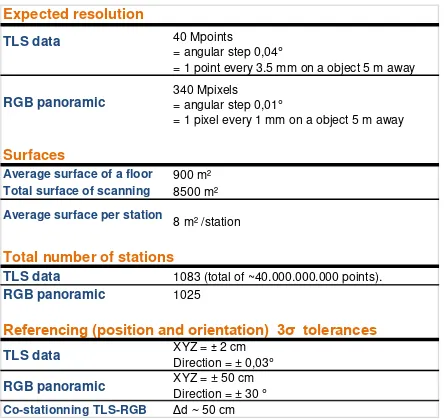
The needs of applications and scenarios of uses (type of equipment to scan, level of detail and expected resolution of the data sets) helped to specify the characteristics of scanning, summarized in Table 1.
Table 1 : Key numbers of the characteristics of the scanning
RGB panoramic 340 Mpixels= angular step 0,01°
= 1 pixel every 1 mm on a object 5 m away
Referencing (position and orientation) 3σ tolerances TLS data XYZ = Direction = ± 0,03°± 2 cm
RGB panoramic XYZ = ± 50 cmDirection = ± 30 °
Co-stationning TLS-RGB Δd ~ 50 cm
For each point of view, both a range image (using LEICA HDS 6000/7000 scanners) and a RGB panoramic image (using DSLR mounted on a motorized head) were carried out. The constraint
Δd on co-stationning the sensors was roughly 50 cm. Final scope was global sub-centimeter coverage of the facility with TLS data, leading to approximately 1 TLS station every 3 m or less. RGB panoramic images are a valuable tool if labels of equipments are readable, ie less than 1 mm pixel size on the objects. Since the average distance between 2 stations, we had to take very large panoramas with more than 340.000.000 pixels per viewpoint.
Referencing (position and orientation) of viewpoints in a pre-define datum has been required for both TLS and RGB data sets. For TLS, referencing errors should not exceed 2 cm. For RGB images, photographers were asked to record their position on a map and to orient the panoramas roughly as experimented in (Hullo, 2013).
The building has a cylindrical shape with a radius of approximately 25 meters. Given the scanned floor surface and characteristics of the scanning, the final number of stations exceeds 1000 for both TLS and RGB (the small difference is due to few TLS stations added for geometric coverage), Figure 3.
Figure 3 Visualization of the 1000+ stations (co-stationning TLS and RGB) performed during the acquisition campaign of as-built data of an industrial plant.
Regarding the methodology, we used of current best practices for TLS data acquisition using total stations traversing and use
of targets for TLS registration, as described in (Reshetyuk, 2009) and (Hullo et al., 2011). A constraint was the limited time on site: only 5 weeks. To carry out the on-site survey in such a short period, planning and resources must be optimized. Human resources involved 5 surveyors and 3 photographs during the acquisition. Many sensors were used: 5 LEICA HDS scanner lasers (6000 and 7000), 1 total station and 3 panoramic heads.
The acquisition was a success thanks to both high level of technological mastery and long experience developed in power facilities that allowed to bypass the ups and downs of such a wide scanning campaign in a very forced timing. The authors wish to highlight the importance of these two factors to carry out surveys of high precision measurements in complex environments that stress tools and sensors that have been developed for more favourable conditions and smaller data sets.
Table 2: Approximate sizes of the files generated through the TLS + RGB acquisition
TLS data
Size of 1 station raw dataset (TZF) ~ 150 Mb Total size of raw TLS data (TZF) ~ 160 Gb Total size of XYZ TLS point clouds ~ 800 Gb
(40.000.000.000 points) RGB panoramic
Size of 1 raw RGB camera picture (JPG) ~ 5 Mb Size of 1 Spherical Panoramic (JPG) ~ 90 Mb Total size of raw RGB panoramic data ~ 90 Gb
Indeed, the amount of data acquired during the acquisition is very important and also push the limits of the tools usually used for storing and processing. Even using compression formats (such as *.tzf for TLS data and *.jpg for RGB panoramic), the numbers are tremendous, cf. Table 2.
3.2 Processing very large as-built data sets
3.2.1 Strategy for processing and validation of large as-built data sets
It is common to insist on the automation of the various stages of a processing workflow to enable its implementation on large third-party team, either completely or by sampling. Returns are then performed and this two-step process starts again until achieving the quality required before storage, sharing and use for industrial operations.
In the following paragraphs, we briefly present the steps of the processing of TLS and RGB data sets and we focus our comments on the steps that proved to be problematic during the processing of the data from the acquisition in section 2.
3.2.2 Processing 1083 TLS stations
TLS data undergo several processing steps: first, automatic filtering to remove as many aberrations of the sensors as possible, and then the registration phase follows.
The registration is based on targets automatically extracted (spheres and checkboards) which some will be measured during a topographic traverse to allow georeferencing. The extraction of the spheres is a process which only presents few difficulties, but matching them is much more laborious. At the scale of the building, mismatches appear really often due to the symmetry of the possible configurations. None of the professional software The International Archives of the Photogrammetry, Remote Sensing and Spatial Information Sciences, Volume XL-5, 2014
investigated by the authors has shown the ability to register more than a few hundreds of scans in the same time. Several limitations of the tested software have prevented to process easily the thousand of scans within the required precision of a georeferencing to better than 2 cm :
target matching is determinist and can lead to mismatch that can only be changed manually,
a priori position and orientations are not used efficiently to reduce the matching task,
adjustment computations based on target pairs is limited and does not handle properly more than a few hundreds of scans.
This last bullet, aka adjustment algorithms for pose estimation and referencing (mainly variants of General Weighted Least-Squares) implemented in most scanner software are far from the academic state of the art. However, many academic breakthroughs already allow more robust and accurate adjustment of large 3D networks, as a better integration of the nature of the network in the adjustment (Olson and Agarwal, 2012), the management of gross errors (Baarda, 1968) or the interest of probabilistic methods (Rahimi et al., 2002).
Once a registered TLS data set is produced, it is therefore necessary to check the results not only on the residuals of the adjustment computations ( ie. the RMS of the spheres after adjustment) but also on the point clouds. We know that low residuals are not a guaranty of accuracy of the global registration but just a clue, due to some local weak geometry. Until now, the best practice consists in cutting the point cloud in many slices along several axes and look at the overlap of per station point clouds over a same object. Tools also exists to check distances between 2 point clouds (CloudCompare 2.5.4, 2014) but sub-operations linked to their use (import/export, sub-sampling, computation, result analysis) still weigh a lot an already heavy processing chain.
Registered TLS data sets are then used for two main purposes: as a source for as-built CAD reconstruction and dimensional analysis. For dimensional analysis, one must consider two different users: users familiar with these data and its error budget and a wider audience which is not familiar with range data. In the first case, no specific processing is performed and raw data are sent to CAD reconstruction operators. In the second case, spherical views of this large dataset (such as LEICA TrueView or TRIMBLE ScanExplorer) will be shared to a wider audience in order to assess their usefulness.
Figure 4: result of the manual segmentation of outliers in a scan due to object high reflectance. Red: points removed from the spherical view before publication in a measurement tool for non familiar users. Blue: points removed by automatic filters. Grey levels: points kept for distance measurements.
In order to provide a confident dataset for non familiar users, the whole 1083 TLS stations have been manually segmented in order to delete the outliers. Indeed, within industrial environments, the error budget of TLS data is complex and raw
data can lead to false conclusions, as we have seen on our data set. In power plants, a lot of objects are very specular (such as heat isolations). Automatic filtering of multi-echoes aberrations on these objects still performs bad and a lot of outliers remain (up to 20% of points on some stations).
3.2.3 Processing 1025 RGB Panoramic images
Figure 5: Part of one of the 1025 RGB panoramic image (340 MPxl). Below are shown some details of the panoramic by just zooming in it.
Processing panoramic images mainly consists in stitching the several (20-30) pictures acquired on the motorized head. Depending on the technology used either for acquisition or stitching, some erros may occur. To create 340 MPixels panoramas, we used stitching software based on feature points extraction and matching (Autopano-SIFT) to estimate the panoramic homographies and then smart blending of the several overlaps.
In the second level checking procedures, many non-qualities were detected (~20 % of the panoramic images), but in the end most have been corrected. A fine review of each RGB panoramic of data set, though time consuming because of the high definition of the images, is still necessary to guaranty the quality of the final results.
Figure 6: Typical non-qualities found on panoramic images that needs a re-process before storing and sharing. a. Hole in the panoramic due to wrong calculation of panoramic homographies. b. Shearing due to mismatching of original images.
In the end, even if some steps in the processing chain are completely automated (application of filter, extractions of spheres, conversions), some steps remain source of error or additional costs because of manual operations (renaming, changing parameters, tracking metadata along processes) and lack of parallelization. Moreover, many automated processes require a visual control, but when data sets are very large, it is therefore necessary to supply with tools the inspect and check processes (for instance after filtering and registration).
4. FROM RAW DATA SETS TO SMART DATA
4.1 General considerations
In metrology, or science of measurement, two contrasting approaches exist: in the first one, the observations are structured and related to the specific object they measured (for example a topographic survey using targets) while in the second case, observations do not correspond to any specific object but are the result of a robotic inspection process (for example, a point cloud resulting of a laser scan). In the second case, redundancies ensure that the information can be found in the data sets.
The second approach is often way faster to implement on site and allows way more use of a same dataset, since it is not related to a specific need. The main drawback of this approach is that the observations are, as such, devoid of any knowledge of themselves and of the object they sample. Of course, one can help users finding faster and better information in these unstructured dataset by developing navigation and displaying (such as spherical display of TLS data with measurement tools and navigation mechanisms). But to share and merge multiple data sources as well as perform most analysis, it is necessary to transform these observations in “consistent” data.
4.2 From TLS data to as-built CAD model
Reconstruction of CAD objects from TLS point clouds is such a “smart” transformation. But this operation also deserves many needs: extracting from the source the minimal information for a specific use, classifying objects per function or physical properties, adding information of “surface” (external and internal part of components), allow more realistic rendering for virtual tours with a decent Frames per Second display, etc.
As expected, this step is expensive and its costs (time and resources) are far from negligible in a scanning campaign: our first feedbacks lead to estimate the reconstruction time of a 900 m² floor to 1 month for a team of 4 experienced CAD operators. As well as for acquisition phase, rigorous requirements are defined and checked afterwards by a two-level control procedure.
The specifications for the CAD reconstruction consist in defining all the type of objects (civils, equipments, doors, floors, pipes, pumps, valves, etc.), naming rules and structure, metadata (material of floors, bearing capacities of beams, functional label in accordance to the label database of the plant, etc.) and geometric tolerances (from 2cm for doors to 50 cm for figuring congestion.
The operators in charge of the reconstruction take advantage of many technological advances of the last decades including fitting and region growing algorithms for primitive shape reconstructions, efficient data structures for loading/displaying of large point clouds and analysis tools such as mesh-cloud distance computations. But the size of the data sets (40.109 points) is such important that common sense prevails in the data management and work procedures for reconstruction. In the end, quality (ie exhaustivity, accuracy, level of detail) can only be fulfilled at our large scale by a well, trained and organized team that was able to overcome the numerous issues encountered. However, full automation is not the expected goal for reconstruction tools: only a trained human being can establish the link between a point cloud and the functional and physical reality of an object of an industrial scene. Because of this essential human contribution, it is necessary to pass as many operations to the computer. As well as for the acquisition
phase, some details may greatly increase the workload (imports/exports, renames, backups, intern management of data inside the software, etc.).
Figure 7: sample data from the wide multi-sensor as-built acquisition campaign. Top: part of the 3D CAD as-built model with point cloud used for reconstruction. Down: High-resolution panoramic image (340 MPixels) of the same viewport. Bottom: details of the panoramic visible by zooming on the image: many labels are still readable form few meters away.
All along the reconstruction, the source of every CAD object create is tracked (creation vs fitting, free vs constraints, copy of existing object, translations, rotations, etc.). This information is particularly useful for control procedure and is considered as attributes of these objects.
4.3 Sharing very large as-built data sets
Sharing data sets can be naively divided into three main topics: the transformation of data, their display and the query mechanism associated with the functionalities of end-user tools. We will focus our comments on the first two topics. Regarding the transformation of data, automation is aimed. In our project, we tested many pipelines for each steps in order to find the best compromise between automation and preservation of information.
The findings we have made differ greatly depending on the data type. For standard data types (RGB images, TLS point clouds), we are able to almost fully automate the process without degrading the data. For as-built CAD models, despite the standardization efforts, we see an inevitable degradation of data regardless the exchange format. Degradation may for example concern the triangulation of primitive shapes or the loss of the model’s structure or even the name of the CAD objects. Finally, the most impacted type of data through the conversions and transformations is the set of metadata associated with data themselves that often cannot even be exported from the software. Knowing the role of this information for The International Archives of the Photogrammetry, Remote Sensing and Spatial Information Sciences, Volume XL-5, 2014
documentation, storage, share and re-use of data sets, we can only hope for improvement of these aspects in the near future.
Figure 8: 3D as-built reconstruction of a large industrial installation. Left: detailed view of the as-built CAD model of one floor. Right: concrete parts of the building and location of the detailed viewport.
Regarding the display, taking advantage of last computer configurations is not enough to handle very large data sets: improvements of data management, data compression and data access are still expected. However, recent developments in out of core mechanisms allowed us to navigate through the 40.109 3D points. For displaying very large 3D models, we use state of the art technologies such as streaming rendering, Figure 9. Due to the high dynamism of this field, we are expecting continuous developments in the years to come to overcome current limitations.
Figure 9: displaying a very large 3D model (a whole EDF power plant with many multi-floor buildings) using streaming processes on a Microsoft Surface 2 Tablet (average of 25 fps). Left: global view of a power plant site with low Level of Detail. Right: detail of the mock-up by zooming on the model; high Level of Detail are load dynamically when zooming on the scene.
5. REVIEW OF SCALING-UP ISSUES AND DISCUSSION
Our experience in scaling up close-range virtual reality technologies for industrial needs, from large close-range acquisitions to multi-purposes professional applications, leads to make the following observations.
Technological progress in the field of close-range acquisitions, data processing and 3D modeling, provides the possibility to generalize the use of as-built data and applications within industrial operations, and even extends the scope of current applications. Nevertheless, among current tools and methods, some steps in the workflow obstruct this perspective in regards of industrial constraints (cost, time, quality, reliability).
Sensors (hardware + firmware) still need improvements:
TLS range imaging: noise due to metallic surfaces that affect station-based spherical measurements.
RGB panoramic imaging: noise in low lights still complicates the automated extraction of labels.
Working with very large data sets rely on automated tools that pass to the computer as much operations as possible. Automation in processes may of course saves time, but also reduces risk non-qualities. Some steps of the acquisition and processing workflow still need improvements:
Tools for registration and referencing of TLS data at the scale of a large building (more than a thousand scans) with centimeter accuracy are missing. From target matching to adjustment computations, the application of methods to the research state of the art of related community (computer vision for feature matching, robotics for graph SLAM approaches, geodesy for robust solving of large networks) would offer an important benefit.
Validation and control stages are also ill-equipped today. Developing methods that help the user in these tasks operations would lead to a better confidence into processes and data (laser: control of the registration and referencing of many stations -billions of points-, photo: validation of panoramic stitching).
Though data structures and parallel algorithm can today deal with increasingly large dataset, the storage, sharing and display is still a difficult part of the workflow.
Despite standardization efforts (e.g. formats, structures and associated meta-data) in many commissions and agencies, it’s worth mentioning that these works might need a better consideration. In many steps of conversion or transform, part of the information contained in the data cannot be exported.
Given the amount of data produced by modern large as-built scanning campaigns (the unit is today TeraBytes), architecture of software used from storing rely on efficient streaming process, specific data structures need to be thought right in the beginning of such projects.
As a conclusion, in one hand, we are excited to move closer to a generalization of very large, albeit accurate, multi-sensor scanning surveys to feed as-built virtual reality applications for industrial processes. In the other hand, the fact remains that the goal is not fully reached: tools and methods currently used were not designed for such large datasets and processes. Based on our recent feedback of a large scale scanning survey, we have highlighted some of these current locks in this paper: sensors denoising, automation in processes, data validation tools improvements, standardization of formats and (meta-) data structures.
6. REFERENCES
Baarda W. 1968. A testing procedure for use in geodetic networks, Publications on Geodesy, New Series, vol:2, no:5, Netherlands Geodetic Commission, Delft, Netherlands.
Bailey T. and Durrant-Whyte H., 2006. Simultaneous localization and mapping (SLAM): part II Robotics and Automation Magazin, IEEE, vol. 13, no. 3, pp. 108-117.
CloudCompare (version 2.5.4) [GPL software]. EDF R&D,
Telecom ParisTech (2014). Retrieved from
http://www.cloudcompare.org/.
Hullo J.-F., Grussenmeyer P., Landes T. and Thibault G., 2011. Georeferencing of TLS data for industrial indoor complex
scenes: beyond current solutions. In: ISPRS Workshop Laser scanning. 2011, Calgary, Canada, Vol. 38.
Hullo J.-F., 2013. Consolidation de relevés laser d’intérieurs construits: pour une approche probabiliste initialisée par géolocalisation. Ph.D. Thesis, Part II.3, pp. 91-96.
Marc R., Kolb F., Thibault G., Tonnoir S., 2009. Maintenance operation simulation for nuclear power plants, SPAR Europe 2009. Presentation retrieved from http://goo.gl/xqw3Ln
Marc R., Schmid A. and Bertin J.-C., 2010. 3D Simulation of Maintenance Operations in Nuclear Power Plants, SPAR Europe 2010. Presentation retrieved from http://goo.gl/i4OhdR
Mól, A.C.A.; Aghina, M.A.C.; Jorge, C.A.F.; Lapa, C.M.F. & Couto, P.M., 2009. Nuclear plant’s virtual simulation for on-line radioactive environment monitoring and dose assessment for personnel. Annals of Nuclear Energy, Vol. 36, No. 11-12. pp. 1747-1752, ISSN 0306-4549
Olson E. and Agarwal P. 2012. Inference on networks of mixtures for robust robot mapping Proceedings of Robotics: Science and Systems (RSS), Sydney, Australia.
Rahimi A., Morency L. and Darrel, T. Bayesian network for online global pose estimation. In International Conference on Intelligent Robots and Systems (IROS), 2002.
Reshetyuk Y., 2009. Self-calibration and direct georeferencing in terrestrial laser scanning. Ph. D. Thesis, Royal Institute of Technology, Stockholm, Sweden.
Sebok A.,. Nystad E., Drøivoldsmo A., 2002. “Improving safety and human performance in maintenance and outage planning through virtual reality-based training systems,” Proceedings of the IEEE 7th Conference on Human Factors and Power Plants, Scottsdale, Arizona, pp.8-14–8-22.
Whelan T., Johannsson H., Kaess M., Leonard J.J. and McDonald J.B., 2013. Robust real-time visual odometry for dense RGB-D mapping. In IEEE Intl. Conf. on Robotics and Automation, ICRA, Karlsruhe, Germany.