AUTOMATIC TRAINING SAMPLE SELECTION FOR A MULTI-EVIDENCE BASED
CROP CLASSIFICATION APPROACH
Menaka Chellasamy a, *, Ty P.A. Ferré b, Mogens Humlekrog Greeve a a
Dept. of Agroecology, Aarhus University, Denmark- 8830 - (Menaka.chellasamy, MogensH.Greve)@agrsci.dk b
Dept. of of Hydrology and Water Resources, University of Arizona, Tuscon, Arizona 85721-0011 - [email protected]
Commission VII, WG VII/4
KEY WORDS: Crop, Classification, Training, Vector, Neural, Satellite, Imagery, Learning
ABSTRACT:
An approach to use the available agricultural parcel information to automatically select training samples for crop classification is investigated. Previous research addressed the multi-evidence crop classification approach using an ensemble classifier. This first produced confidence measures using three Multi-Layer Perceptron (MLP) neural networks trained separately with spectral, texture and vegetation indices; classification labels were then assigned based on Endorsement Theory. The present study proposes an approach to feed this ensemble classifier with automatically selected training samples. The available vector data representing crop boundaries with corresponding crop codes are used as a source for training samples. These vector data are created by farmers to support subsidy claims and are, therefore, prone to errors such as mislabeling of crop codes and boundary digitization errors. The proposed approach is named as ECRA (Ensemble based Cluster Refinement Approach). ECRA first automatically removes mislabeled samples and then selects the refined training samples in an iterative training-reclassification scheme. Mislabel removal is based on the expectation that mislabels in each class will be far from cluster centroid. However, this must be a soft constraint, especially when working with a hypothesis space that does not contain a good approximation of the targets classes. Difficulty in finding a good approximation often exists either due to less informative data or a large hypothesis space. Thus this approach uses the spectral, texture and indices domains in an ensemble framework to iteratively remove the mislabeled pixels from the crop clusters declared by the farmers. Once the clusters are refined, the selected border samples are used for final learning and the unknown samples are classified using the multi-evidence approach. The study is implemented with WorldView-2 multispectral imagery acquired for a study area containing 10 crop classes. The proposed approach is compared with the multi-evidence approach based on training samples selected randomly and border samples based on initial cluster centroids within agricultural parcels without any refinement. The results clarify the improvement in overall classification accuracy to 82.3% based on the proposed approach from 74.9 % based on random selection and 71.4% on non-refined border samples.
* Corresponding author. This is useful to know for communication with the appropriate person in cases with more than one author.
1 INTRODUCTION
Providing training samples for supervised classification is still a very critical, expensive, and time consuming task (Foody, 1999; Ozdarici Ok and Akyurek, 2011). It must be emphasised that the nature of the training samples has a major impact on the ability of the classifier to generalize, which in turn affects the classification accuracy (Perumal and Bhaskaran, 2010). Hence, there is increased interest in developing automated approaches for collecting training samples that may not require intensive field work, data analysis, experience, and time (Colditz et al., 2008; Jia et al., 2014; Ozdarici Ok and Akyurek, 2011). While different methods are available, recently vector data such as thematic maps, cartographic data, and agricultural parcels have been used extensively to support the automatic selection of training samples (Feitosa et al., 2001; Ostermann, 2012; Ruiz et al., 2009). Because these vector data are liable to suffer from errors (mislabelling, error in boundary digitization, changes in landscapes), removal of outliers or incorrect samples is always necessary as a part of automated classification approaches (Jia et al., 2014; Ostermann, 2012).
Classification approaches based on ensemble learning is a way to combine weak learners to produce a strong learner (Chandra and Yao, 2006). In such cases, handling of small inaccuracies in the training data is not crucial for ensemble classifiers (when comprised of advanced non-parametric classifiers such as neural networks and Support Vector Machines)(Colditz et al., 2008). But, in an ensemble framework, individual learners that are trained on a large component of incorrect or non-representative samples will result in inaccurate classification; this is common when using manually created vector data.
The available vector data for this study is created by Danish farmers to apply for the subsidies from the Danish Ministry of Food, Agriculture and Fisheries. We propose an approach to use this vector data for selecting training samples with automated removal of mislabels to develop an automatic multi-evidence based ensemble classification approach for crop discrimination. We refer to this approach as ECRA (the Ensemble based Cluster Refinement Approach).
1.1 Related Work
1. The regular availability of high resolution aerial and satellite imagery has increased through support from public administrations at regional and national levels in several countries. This has allowed for the creation and maintenance of different types of cartographic and geospatial databases (Ruiz et al., 2009). An important concern is how to use these databases in introducing automation for training sample collection. A simple approach to select the training samples automatically by random/systematic sampling with vector overlay on input imagery is reported in (Zhen et al., 2013). Blocks of pixels from the center parts of the referenced land parcels are selected as training samples for parcel based crop mapping in (Arikan, 2004). (Feitosa et al., 2001) modelled linear relationships between the spectral responses of classes acquired in two different dates for collecting training samples using thematic layers. (Cazes et al., 2002) improved the method addressed by (Feitosa et al., 2001) with sub-optimal selection of samples among automatically selected training samples. (Ozdarici Ok and Akyurek, 2011) proposed a method using mean-shift segmentation and selecting homogeneous segments within vector data as potential training samples for agricultural crop classification. These approaches only meet the need of automation in classification and selecting informative samples, whereas removal of mislabels from automatically selected training dataset remains an unmet and crucial need.
2.
Only a few studies have proposed methods to remove outliers or incorrect training pixels in the field of Remote Sensing. Edition of training samples from vector data using k-nearest neighbor and the k-means algorithm is proposed in (Hajahmadi et al., 2013). A method of training a classifier using initial reference samples and removing mislabels from border samples that create high uncertainty in membership is presented in (Ostermann, 2012). In a study proposed by (Brodley and Friedl, 2011), a consensus voting scheme is employed to filter results from an ensemble of classifiers to eliminate mislabeled samples. Other methodologies to remove mislabels using predicted membership in other fields, like computer vision and machine learning, can be seen in (Chandola et al., 2009; Escalante, 2005; Hodge and Austin, 2004).
1.2 Contribution
The methods cited above either focus on selecting informative samples or on mislabel elimination. We propose an approach to achieve both goals jointly. Furthermore, the cited methods for removing mislabels use a single hypothesis space/domain. Only a few studies have explored the concept of using multiple datasets separately (multiple hypothesis space) in predicting the class labels for unknown samples (Aitkenhead et al., 2008; Aitkenhead and Aalders, 2011). In our approach, inspired from our previous research, we use multiple hypothesis space to identify mislabels rather using a domain created by stacked multiple datasets. We contend that multiple hypothesis space will be more robust because each space offers different discrimination ability between certain crops. Also, existing methods that remove mislabels based on uncertainty in class membership employ thresholds fixed by the user (Jia et al., 2014; Ostermann, 2012). We replace this subjective approach with an approach based on heuristic reasoning of uncertainty as proposed by (Cohen, 1985).
The study demonstrates: i) the technique that removes mislabels in an iterative fashion from the training sets selected based on
agricultural parcels in an ensemble frame work (ECRA - the Ensemble based Cluster Refinement Approach); ii) use of multiple hypothesis space for mislabel removal; and iii) use of prediction probability from neural networks as a measure of uncertainty to remove mislabels.
2. MULTI-EVIDENCE BASED CLASSIFICATION
Classification using an ensemble of learners includes the following categories: i) a single classifier trained with different sets of samples; ii) different classifiers trained on the same training set; iii) a single classifier with different attribute sets; 4) classifiers with different architectures (like the topology of an ANN); 5) classifiers with different parameter choices (amount of tree pruning, parameters in learning algorithms). The multi-evidence classification approach (also called Endorsement Theory based classification) falls in the third category. Our previous research developed a classification approach that consists of three MLP neural networks each trained with different attributes (Spectral, texture and vegetation indices). The three networks are trained with common training datasets and their prediction probabilities are combined using Endorsement Theory to classify the unknown samples/pixels.
Endorsement Theory (ET) gathers the evidences from different classifiers and provides support for a particular hypothesis/class. The prediction probabilities from a neural network are categorised into different types of evidence according to their strength (Aitkenhead et al., 2008). Five types of evidence combined for testing hypothesis are: conclusive-belief (positive: [0.9-1], negative: [0-0.1]), prima-facie (positive: [0.8-0.9], negative: [0.1-0.2]), strong (positive: [0.7-0.8], negative: [0.2-0.3]), weak (positive: [0.6-0.7], negative: [0.3-0.4]) and no evidence (any other values). The various strengths of evidence are integrated according to a set of rules described in (Aitkenhead et al., 2008). The evidence against each hypothesis is combined to create conclusions called: definite (conclusive evidence), confident (prima facie evidence), likely (strong evidence), indicated (weak evidence) and no evidence (equally balanced). Finally, the class with highest strength of conclusion is assigned as the output class to the pixel.
3. ECRA
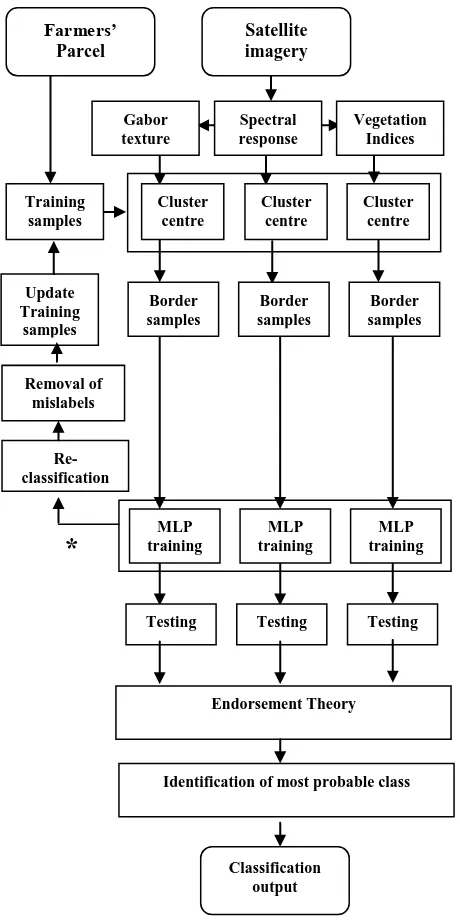
The above mentioned multi-evidence based classification has been proven to produce accurate results in comparison to a traditional classification method based on stacked input datasets. The objective of ECRA is to automatically feed this multi-evidence approach with the training samples that do not have any mislabels. ECRA is based on an ensemble framework whose workflow is shown in Figure 1 and the components involved are described below.
3.1. Ensemble Framework
The individual classifiers in an ensemble framework should have high diversity and produce independent errors. It is proven that the three attribute domains used here (spectral response, Gabor textures, and vegetation indices from WorldView-2 imagery) show better crop discrimination abilities (Novack et al., 2011; Upadhyay et al., 2012). Thus, our proposed approach filters mislabels by using MLP networks trained in the three different domains. All pixels inside the farmers’ parcels of each crop class are considered to form an initial cluster. Therefore, the number of different crop classes declared by the farmers The International Archives of the Photogrammetry, Remote Sensing and Spatial Information Sciences, Volume XL-7, 2014
Endorsement Theory classifier is trained with border samples obtained from corresponding attribute domain. The initial clusters are re-classified by the three classifiers. Mislabels are removed based on the reclassification output from three classifiers.
3.2 Border Samples
Support Vector Machines initially take all of the training samples. But, near the end of training it uses only the border samples for learning. Neural networks learn based on all of the training samples provided (Duch, 2005). Therefore, it is necessary to feed the MLPs with the border samples. A set of border training patterns/mislabels in a cluster would ideally contain patterns from different classes that are close together in
feature space and thereby expected to lie near the classification decision boundary. It is to be noted that, the border pixels in one attribute domain may not be border pixels in other domains.
Class membership in this study is calculated using Mahalanobis Distance (MD) (Foody, 1999). The cluster centroids are calculated initially based on the samples collected from farmers’ parcels in three attribute domains. MD is calculated for all of the pixels in each cluster with respect to the centroid of its own cluster and all other clusters. Pixels for which the difference in the MD between the two most likely classes of membership is small are considered border training pixels. Hundred pixels with the lowest difference between the highest and second highest MD are taken as border samples in the iteration.
3.3 Re-classification
The previously described step results in three sets of border training pixels calculated based on three attribute domains. Each neural network is trained with each set of samples. Next, clusters are reclassified by three networks and their prediction probabilities are obtained. Then, all the pixels are analysed to determine whether they are mislabels or correct labels as described below.
3.4 Removal of mislabels
MLP neural networks learn the training pattern of various classes and predict the probability of a test pattern to fall under each class. Class with highest probability is assigned finally to the test pattern. This probability value is called prediction probability (ranging 0 to 1) and used for removing mislabels.
For each pixel in initial clusters, there are three prediction probabilities (one from each of the three networks) towards each crop classes. Pixels whose class labels are correctly predicted as labelled by farmers by all the three classifiers are retained in the clusters. Other pixels are removed from the clusters. In addition among the correctly classified uncertain samples are also identified removed from the clusters.
When a pixel is said to be identified as correct sample, it should have high prediction probability towards its corresponding crop cluster in three attribute domains. In other words, pixels that are with high prediction probability towards a declared crop cluster are said to have high certainty to belong to that cluster. On other hand pixels that have low prediction probability are said to have high uncertainty towards its corresponding cluster.
However, sometimes the pixels are predicted to its correct class with low value of probability in a domain that has poor discrimination ability between the classes. Hence it is crucial to fix a prediction probability threshold to define high and low demarcation in probability values. This situation is handled by following heuristic reasoning on uncertainties given in (Cohen, 1985). As mentioned in section 2, the prediction probabilities are considered as evidence and categorised in to five types: conclusive-belief, prima-facie, strong, weak and no evidence. The evidence with probability greater than 0.7 are consider as positive. Though the value ranging 0.6 to 0.7 is consider to be positive, still they are named as weak positive. Remaining values are considered to be non-evidence or negative evidence.
Based on these definitions, the criteria for a pixel being uncertain sample based on prediction probability is fixed. The International Archives of the Photogrammetry, Remote Sensing and Spatial Information Sciences, Volume XL-7, 2014
Quantitatively, we let ‘P’ be the prediction probability defined by one network on re-classification. Pixels for which ‘P’≥ 0.7 are termed certain pixels and remaining samples are termed as uncertain pixels. The value of P is defined for all three networks. Pixels that are identified to be certain by all the three networks are retained in the clusters and other samples are removed.
3.5 Refined training samples
Pixels that are identified as uncertain samples are due to one of the two reasons. Either they can be mislabels or border samples (since border samples lie closer to the decision boundary between two classes they most likely to belong to both, producing weak evidence or no evidence). When the uncertain samples are removed, there is a chance for the loss of informative samples also. But this may not affect the final classification as the classification is done in ensemble framework (producing strong classifier with weak classifiers).
The border samples derived before the first iteration are based on the cluster centroids that are calculated with the inclusion of mislabels. After removal of uncertain pixels, the new cluster centroids are calculated with the remaining pixels. New border samples are selected and all cluster pixels are re-classified. Then the process of removing mislabels is repeated. Iteration continues until the cluster centroids remain the same. Once the cluster centroids are stable, the border samples are used as the final training samples.
3.6 Classification
Once the three networks are trained with the final training samples, testing is done for the satellite imagery. The prediction probabilities from three networks are integrated using multi-evidence approach (explained in section 2) to produce the classification results.
4. IMPLEMENTATION AND RESULTS
4.1 Study Area
The study area is located in Vennebjerg, Denmark, covering approximately 650 hectares, centered on the geographical coordinates 57°27’N (latitude) and 9°52’E (longitude) and consists of 10 different crop classes: 5 types of grains, 3 types of grasses, berries and barren land. The area of interest is covered by a WorldView-2 (WV2) image with spatial resolution of 2m, acquired on 11th June.
4.2 Input Dataset
Three different datasets/attributes derived from WV2 imagery to form three hypothesis spaces and the vector data used for selecting training samples are explained below.
4.2.1 Spectral Dataset
WV2 imagery brings fine spatial details and aids reliable discrimination of crops (DigitalGlobe, 2010; Elsharkawy et al.; Marchisio et al., 2010). It has been providing a great value in agricultural applications, e.g. for discriminating and monitoring of crop species, vegetation health and mapping of moisture content (Elsharkawy et al.; L. Nunez-Casillas 2012; Upadhyay et al., 2012). All eight bands (visible to near
infra-red (NIR)) of WV2 imagery acquiinfra-red on early summer is used as the spectral dataset.
4.2.2 Gabor Texture
Crop textures are characterized by extracting spatial details from each spectral band of WV2 imagery using Gabor filters (Unser, 1995). The texture features extracted using Gabor filters are invariant while capturing the spatial details that are influenced by frequency and orientation. In this research work, 8 orientations used to implement the filters ranges from 0º to 315º with 45º separation. Five radial frequencies with values of 2√2, 4√2, 8√2, 16√2 and 32√2 and scaling parameter of 0.5 are used for generating filters of different scales. In total 40 Gabor features are extracted from each spectral band. In order to reduce the data dimensionality, first two principle components of 40 Gabor features explaining approximately 76% of variable information are considered as a texture representation of each spectral band.
4.2.3 Vegetation Indices
Spectral indices, derived from a combination of two or more spectral bands have widely benefited numerous studies to characterize the type, amount and condition of vegetation (Jackson and Huete, 1991). Based on review of various spectral indices (Jackson and Huete, 1991; Shamsoddini et al., 2011; Wolf, 2010), indices namely: Normalized Difference Vegetation Index (NDVI) using two near infra-red bands, Yellow NDVI, Green NDVI, NIR NDVI, Normalized Pigment Chlorophyll Index (NPCI) and Normalized Difference Soil Index (NDSI) are derived and stacked to use as third attribute domain.
4.2.4 Vector data
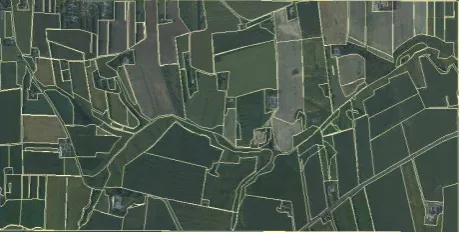
In Denmark, to obtain subsidies farmers have to send applications to Directorate of Food, Fisheries and Agro business (DFFE) with information about producer, crop type and its area of coverage and boundary of the filed (drawn on the color orthophoto in the application at 1:10,000 scale). All the data were are stored in GAR/CHR register as vector layer managed by Danish Ministry of Food, Agriculture and Fisheries (Pedersen, 2005). The field boundary each containing single crop types inside a polygon with its corresponding crop code forms the source to select the training samples. Figure 2 shows the orthophoto of the study area overlaid with agricultural parcels (yellow polygons).
Figure 2. Study area covered by the orthophoto and agricultural parcels
4.3 Results of ECRA
Class A Class B
(a) (b)
(c) (d)
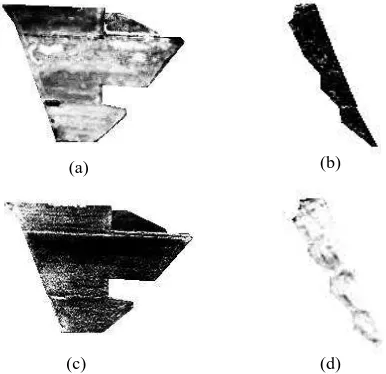
Figure 3. False color composite of WorldView-2 imagery of two crop fields used for training, (a) winter rape, class A and (b) grass below normal yield, class B while (c) and (d) represents pixel labels inside respective crop fields
Class A
(a) (b)
(c) (d)
Class B
Figure 4. Certainty of pixels in spectral domain to class A ((a) and (b)) and class B ((c) and (d)). Values ranges from uncertainty (0, black) to certain (1, white)
(a) (b)
(c) (d)
(b) (a)
(a) (b)
(a) (b)
(c) (d)
Figure 7. Result of ECRA (Black are invalid regions removed from training samples. Samples from other regions are used for learning in next iteration)
Figure 8. Result of multi-evidence based classification approach (Black are misclassified pixels. Other region represents pixels that are correctly classified)
Figure 5. Certainty of pixels in texture domain to class A ((a) and (b)) and class B ((c) and (d)). Values ranges from uncertainty (0, black) to certain (1, white)
Figure 6. Certainty of pixels in indices domain to class A ((a) and (b)) and class B ((c) and (d)). Values ranges from uncertainty (0, black) to certain (1, white)
Figure 9. Classification output based on training samples selected by a) border samples from ECRA b) Random selection c) Non-refined border samples The results of major steps involved in ECRA are shown in
Figure 3 to Figure 7 for two crop fields: winter rape (class A) and grass with low yield (class B). The rape field consists of piece of land occupied by grass, Figure 3(a). Figure 3(c) and 3(d) shows the labels declared by the farmers and it could be seen that grass region within winter rape field is also given same label as winter rape. The cluster centre to obtain border samples are estimated with the inclusion of grass pixels with rape pixels. The other field, class B (showing moisture content in few places, Figure 3(b)) is without mislabels.
Figure 4 to Figure 6 shows the prediction probability obtained during re-classification in three domains. Ideally the correct pixels in field with class A should show certainty towards class A and uncertainty towards class B. Similarly the pixels in class B should show certainty towards class B and uncertainty towards class A. Mislabels inside class A should show uncertainty towards class A.
Figure 4(a) and (b) shows the certainty value of pixels in class A and B towards class A in spectral domain. Maximum number pixels in class A are found to be certain to class A. Grass region inside rape field are found to be uncertain towards rape (Figure 4(a)). Figure 4(c) and (d) shows the certainty of pixels towards class B in spectral domain. It is noted that pixels with high moisture content inside the field found to be uncertain towards its correct class and certain towards wrong class meaning the attribute domain offers poor generalization of classes. But the certainty of these pixels said to be different in other two domain (texture, Figure 5 and indices, Figure 6). Most of the pixels containing higher moisture content also found to be certain towards its correct class meaning texture domain offers better generalization than spectral and indices domain. Mislabelled region inside rape field are found to be uncertain towards class A in texture (Figure 5(a)) and indices domain (Figure 6(a)) meaning they offer better identification of mislabels in comparison to spectral domain. The trend may vary in case of other crop types and hence ensemble framework is found to exploit this different discrimination ability of three domains.
ECRA keeps the pixels that are identified to be certain towards its crop cluster by all three networks. Figure 7 shows the refined clusters with removed uncertain pixels (black). The cluster centre based on this refined samples are used to derive final border samples for learning.
4.4 Classification results
Figure 8 shows the predicted label of class A (green) and class B (magenta) by multi-evidence based classifcation. The labels are predicted correctly except few pixels (misclassified pixels in black).
The classified outputs based on different training samples are shown in Figure 9 (a, b and c) for the study area. The multi-evidence based classification approach trained with the border samples selected by ECRA gives the results with less noisy compared to that of with randomly selected and non-refined border samples. For validation, considering the rule of thumb (every class at least should have 50 reference samples) 50 samples are manually chosen for measuring the accuracy of classification. The multi-evidence approach with the refined border samples produced highest overall classification accuracy of 82.3% in comparison to classification based on random selected (74.9%) and non-refined border training samples
(71.4%). From the proposed approach, highest Producer Accuracy (PA) for crops obtained. (PA: spring barley: 85.3%, winter rape: 91.2%, Grass above normal yield: 86.5%, Grass below normal yield: 89.5%, not cultivated: 79.1%: winter barley: 72.3%, Fodder maize: 87.2%, winter wheat: 88.4%, permanent grass: 79.6%, Fruits: 96.5%).
4 CONCLUSIONS
In this paper, we presented an approach for automatic selection of refined border training samples to train the multi-evidence based classifier. Refinement was done in an ensemble framework to make use of the discrimination ability of WV2 in three attribute domain without working with large hypothesis space. The vector data declared by farmers are used as source for training samples. We have used the prediction probability generated by MLP networks to remove outliers iteratively with heuristic reasoning on uncertainty. The proposed classification rate was improved from 74.9% and 71.4% to 82.3% and the approach found to be promising to perform automatic classification of remotely sensed images for crop The International Archives of the Photogrammetry, Remote Sensing and Spatial Information Sciences, Volume XL-7, 2014
discrimination. The accuracy of classification can be further increased if input datasets incorporates the multi-temporal information which is highly recommended in the literatures for crop mapping. neural networks and evidence pooling for land cover mapping. Photogrammetric Engineering & Remote Sensing 74, 1019-1032.
Aitkenhead, M., Aalders, I., 2011. Automating land cover mapping of Scotland using expert system and knowledge integration methods. Remote Sensing of Environment 115, 1285-1295.
Arikan, M., 2004. Parcel based crop mapping through multi-temporal masking classification of Landsat 7 images in Karacabey, Turkey, Proceedings of the ISPRS Symposium, Istanbul International Archives of Photogrammetry. Remote Sensing and Spatial Information Science.
Brodley, C.E., Friedl, M.A., 2011. Identifying mislabeled training data. arXiv preprint arXiv:1106.0219.
Cazes, T., Feitosa, R., Mota, G., 2002. Automatic selection of training samples for multispectral image classification. DEE PUC-RJ.
Chandola, V., Banerjee, A., Kumar, V., 2009. Anomaly detection: A survey. ACM Computing Surveys (CSUR) 41, 15. Chandra, A., Yao, X., 2006. Evolving hybrid ensembles of learning machines for better generalisation. Neurocomputing 69, 686-700.
Cohen, P.R., 1985. Heuristic reasoning about uncertainty: an artificial intelligence approach. Univ. of Massachusetts. Colditz, R.R., Schmidt, M., Ressl, R., Hansen, M.C., Dech, S., 2008. A Method for Selecting Training Data and its Effect on Automated Land Cover Mapping of Large Areas, Geoscience and Remote Sensing Symposium, 2008. IGARSS 2008. IEEE International, pp. IV - 542-IV - 545.
DigitalGlobe, I., 2010. Whitepaper: The benefits of the 8 spectral bands of worldview-2. Unpublished manuscript. Retrieved 8, 2011.
Duch, W., 2005. Support vector neural training, Artificial Neural Networks: Formal Models and Their Applications– ICANN 2005. Springer, pp. 67-72.
Elsharkawy, A., Elhabiby, M., El-Sheimy, N., Improvement in the detection of land cover classes using the WorldView-2 imagery.
Escalante, H.J., 2005. A Comparison of Outlier Detection Algorithms for Machine Learning”.
Feitosa, R., Meirelles, M., Blois, P., 2001. Using Linear Regression for Automation of Supervised Classification in Multitemporal Images, Proceedings of the first International workshop on analysis of multi-temporal remote sensing images–MultiTemp. World Scientific.
Foody, G.M., 1999. The significance of border training patterns in classification by a feedforward neural network using back propagation learning. International Journal of Remote Sensing 20, 3549-3562.
Hajahmadi, S., Mokhtarzadeh, M., Mohammadzadeh, A., javad Valadanzouj, M., 2013. Uncertain Training Data Edition for Automatic Object-Based Change Map Extraction. ISPRS-International Archives of the Photogrammetry, Remote Sensing and Spatial Information Sciences 1, 185-189.
Hodge, V.J., Austin, J., 2004. A survey of outlier detection methodologies. Artificial Intelligence Review 22, 85-126. Jackson, R.D., Huete, A.R., 1991. Interpreting vegetation indices. Preventive Veterinary Medicine 11, 185-200.
Jia, K., Liang, S., Wei, X., Zhang, L., Yao, Y., Gao, S., 2014. Automatic land-cover update approach integrating iterative training sample selection and a Markov Random Field model. Remote Sensing Letters 5, 148-156.
L. Nunez-Casillas , F.M., B. Somers, P. Brito, M. Arbelo 2012. Plant species monitoring in the canary islands using worldview-2 imagery. XXII ISPRS Congress, worldview-25 August – 01 September 2012 XXXIX-B8.
Marchisio, G., Pacifici, F., Padwick, C., 2010. On the relative predictive value of the new spectral bands in the WorldWiew-2 sensor, Geoscience and Remote Sensing Symposium (IGARSS), 2010 IEEE International. IEEE, pp. 2723-2726. Ostermann, T.B.a.I., 2012. Automatic refinement of training data for classifcation of satellite imagery. ISPRS Annals of the Photogrammetry, Remote Sensing and Spatial Information Sciences Volume I-7.
Ozdarici Ok, A., Akyurek, Z., 2011. Automatic Training Site Selection for Agricultural Crop Classification: a Case Study on Karacabey Plain, Turkey. ISPRS-International Archives of the Photogrammetry, Remote Sensing and Spatial Information Sciences 3819, 221-225.
Pedersen, B.F., 2005. Use of very high resolution imagery in the control of area based subsidies with remote sensing. EARSeL eProceedings 4, 1-8.
Perumal, K., Bhaskaran, R., 2010. Supervised classification performance of multispectral images. arXiv preprint arXiv:1002.4046.
Ruiz, L.A., Recio, J.A., Hermosilla, T., Sarria, A., 2009. Identification of agricultural and land cover database changes using object-oriented classification techniques, 33rd International Symposium on Remote Sensing of Environment, May, pp. 4-8.
Shamsoddini, A., Trinder, J.C., Turner, R., 2011. Quantization of Pinus forest biophysical parameters using WorldView-2, Latin American Geospatial Forum.
Unser, M., 1995. Texture classification and segmentation using wavelet frames. Image Processing, IEEE Transactions on 4, 1549-1560.
Upadhyay, P., Kumar, A., Roy, P.S., Ghosh, S.K., Gilbert, I., 2012. Effect on specific crop mapping using WorldView-2 multispectral add-on bands: soft classification approach. Journal of Applied Remote Sensing 6, 063524-063521-063524-063513. Wolf, A., 2010. Using WorldView 2 Vis-NIR MSI imagery to support land mapping and feature extraction using normalized difference index ratios. DigitalGlobe 8-Band Research Challenge, 1-13.
Zhen, Z., Quackenbush, L.J., Stehman, S.V., Zhang, L., 2013. Impact of training and validation sample selection on classification accuracy and accuracy assessment when using reference polygons in object-based classification. International Journal of Remote Sensing 34, 6914-6930.