RELATIONSHIP BETWEEN AWIFS DERIVED SPECTRAL VEGETATION INDICES
WITH SIMULATED WHEAT YIELD ATTRIBUTES IN SIRSA DISTRICT OF HARYANA
A Biswal * ([email protected]), B Sahay , KV Ramana, SVCK Rao, MVR Sesha Sai, ASAG, RSAA, National Remote Sensing Centre, Hyderabad 500037, India
KEY WORDS: Crop simulation model, DSSAT, CERES, NDVI, NDWI
ABSTRACT:
Satellite remote sensing can provide information on plant status for large regions with high temporal resolution and proved as a potential tool for decision support. It allows accounting for spatial and temporal variations of state and driving variables, influencing crop growth and development, without extensive ground surveys. The crop phenological development and condition can be monitored through multi-temporal reflectance profiles or multi-temporal vegetation indices (VI), such as the Normalized Difference Vegetation Index (NDVI) and Normalized Difference Water Index (NDWI). At the same time, Process based dynamic crop growth simulation models are useful tools for estimating crop growth condition and yield on large spatial domains if their parameters and initial conditions are known for each point. Therefore, combined approaches integrating remote sensing and dynamic crop growth models for regional yield prediction have been developed in several studies. In these models the vegetation state variables, e.g., development phase, dry mass, LAI are linked to driving variables, e.g., weather condition, nutrient availability and management practices. Output of these models is usually final yield or accumulated biomass. The model outputs are a summary containing an overview of the main development events, water and nitrogen variables, yield and yield components. In the present work, IRS P6 AWiFS derived vegetation indices like NDVI and NDWI are computed to study the growth profile of wheat crop in Sirsa district of Haryana along with crop growth simulation model DSSAT-CERES from 2008-09 to 2012-13.several iteration of wheat crop simulation are carried out with four sowing dates and four soil types varying with respect to the fertility parameters to represent the average simulation environment of Sirsa district in Haryana state of India. Four years time series NDVI and NDWI are used to establish the correlation between the spectral vegetation indices and simulated wheat yield attributes at critical growth stages of wheat. This work is a basic investigation towards assimilation of remote sensing derived state variables in to the crop growth model. .
1. INTRODUCTION
The use of crop growth models on large areas for diagnosing crop growing conditions or predicting crop production is hampered by the lack of sufficient spatial information about model inputs. Therefore, many different studies have attempted to estimate crop yield in combination of crop growth model and satellite data. Remote sensing and cropping systems modeling are two distinct technologies that have been developed to address diverse agronomic issues at field-level and regional scales (Whisler et al., 1986; Moran et al., 1997; Batchelor et al., 2002; Xie et al., 2008). Although these technologies have often been studied independently, there is growing interest in utilizing information derived from remote sensing to update or drive cropping systems model simulations because the two technologies are naturally complementary (Maas, 1988a; Moulin et al., 1998; Inoue, 2003; Dorigo et al., 2007). For example, whereas the daily time-step simulation capabilities of cropping systems models are excellent for crop growth analyses in the temporal domain, remote sensing images offer great opportunity to understand spatial crop growth patterns. Conversely, detailed model input requirements have limited the use of cropping systems models for spatial crop growth analyses. With the integration of these technologies, the problems associated with one can be compensated by the benefits of the other. Remote sensing techniques have the potential to provide information on agricultural, crops quantitatively, instantaneously and, above all, non-destructively over large areas Remote sensing can also be used to derive crop phenological information (Karnieli, 2003; Xin et al.,2002). Knowledge of plant phenology is essential for most agro ecosystem models since it governs the partitioning of assimilates. Therefore, a precise knowledge of the phenological status of the plants will greatly improve the results obtained by agro ecosystem models (Dele´colle et al., 1992). Remote
sensing data are used to infer canopy biophysical variables like LAI (leaf area index), or Cab (chlorophyll a & b) among others, which are involved in the important physical and/or physiological processes governing crop growth processes.LAI is the main vegetation structure variable and one of the main drivers of canopy primary production (Weiss, 1999).
Spatialisation of crop models needs to link different scales. For example, the scale on which the processes are described by the model, (Moulin et al.,1998) the scale on which input data or information (model parameters and input variables) must be available, or the scale on which output results are expected or sought. Thus, spatialisation often requires some kind of change of scale, and in this aspect remote sensing plays a vital role in providing spatialised inputs for crop simulation on regional scale. The present study was carried out with the objectives as follows.
Evaluation of CERES wheat model embedded in DSSAT for Sirsa district of Haryana
Analyzing the relations between spectral vegetation indices and wheat yield attributes like leaf area index (LAI), and total dry matter (TDM) etc.
2. STUDY AREA
months. The rainfall however is uneven and scanty. The average rainfall varies considerably from year to year. The main crop rotations are paddy-wheat, wheat, cotton-raya, guar-wheat.and guar-raya. The soil of the district is coarse sandy loam and sandy and a few pockets of clay loam. The PH ranges from 8.1 to 8.6
3. METHODOLOGY
3.1 Crop growth model
Process based crop simulation models have been used extensively to evaluate the potential effects of environmental, biological and management changes on crop growth and development (Hoogenboom, 2000). Important model state variables such as above-ground biomass, leaf area index and specific canopy characteristics such as chlorophyll or nitrogen content can be estimated from remote sensing observations and can therefore be used for calibration and validation purposes.
Remote sensing information allows identification of the timing of phenological events such as maximum vegetative phase, flowering and maturity etc. which can be used to adjust simulation models (Dadhwal et al, 2002; Nain et al, 2002). Estimates of the dynamics of soil characteristics such as soil moisture content and crop characteristics (i.e. biomass, leaf area index, canopy structure and chlorophyll contents) can be provided by simulation models. This feature has great potential in filling in missing remote sensing data due to unfavourable climatic conditions such as clouds or due to technical problems. Although remote sensing and crop growth simulation modelling each has proven its usefulness and applicability in various areas, such uses have in principle been separately, and not in combination. An attempt has been made to use remote sensing derived information with crop simulation model to monitor wheat growth in Sirsa district from 2008-09 to 2011-12.
The CSM-CERES-Wheat, a part of Decision Support System for Agrotechnology Transfer (DSSAT) Cropping System Model V4.0 (Hoogenboom et al., 2002), has been used in this study. The model has been documented extensively since its initial development and evaluation (Ritchie and Otter-Nacke, 1985; Ritchie et al., 1998). It simulates the effects of weather, genotype, soil properties and management on wheat growth and development, yield, soil and plant water and nitrogen dynamics. The crop growth model considers phase-wise development with nine growth stages, from pre-sowing to harvest, in relation to thermal time. The model calculates biomass accumulation as the product of radiation use efficiency and photo-synthetically active intercepted radiation. The number of growing leaves is a function of leaf appearance rate (phyllochron interval, degree days) and duration of grain filling. Organ extension depends on potential organ growth and is limited by sub-optimal temperature and water and nitrogen stresses. Partitioning coefficients of dry biomass in plant parts are influenced by phase-wise development. Grain yield is modeled as a product of grain number, plant population, and grain mass at physiological maturity. Daily soil water balance is modeled in relation to water content (cm3/cm3), saturated hydraulic conductivity (cm/h), organic carbon (%), pH and electrical conductivity (dS/m) are required to run the model. The NBSSLUP soil map
and secondary information from district database maintained by CRIDA (Central Research Institute for Dry Land Agriculture) and WISE global soil database (Gijsman et al. 2007) have been used for preparing the respective district soil input files.
As weather input, daily average maximum, minimum temperature (0C), rainfall (mm/day) and solar radiation (MJ/m2) are the prerequisites for running DSSAT CERES model. For model calibration and validation, historical weather data from 1998 to 2013 were used, while for rabi 2008-09 to 2011-12, IMD AWS data have been used.
3.2 Remote sensing derived indices
NDVI is one of the most well known and most frequently used VIs. The combination of its normalized difference formulation and use of the highest absorption and reflectance regions of chlorophyll make it robust over a wide range of conditions. NDVI is very useful for deriving vegetation biophysical parameters, such as the leaf area index (LAI), the fraction of absorbed photosynthetically active radiation (fAPAR) and percentage of green cover. NDVI saturates in dense vegetation conditions when LAI becomes high. The value of NDVI ranges from -1 to 1; the common range for green vegetation is 0.2 to 0.8. Comparing current NDVI images with older ones it is possible to assess the positive and negative deviations that occur during the growing season of vegetation and evaluate the state's relative values can be averaged over time to establish ‘normal’ growing conditions in a region for a given time of year. When analyzed through time, NDVI can reveal where vegetation is thriving and where it is under stress, or changes in
plants’ phenological stage. The NDVI is defined as (Rouse et
al. 1973):
NDVI = λNIR - λRed/ λNIR + λRed (1)
where λNIR = spectral reflectance in near infrared region
λRed = spectral reflectance in red region
NDWI is a satellite-derived index from the near- I (NIR) and short wave IR (SWIR) channels:
NDWI = λNIR - λSWIR/ λNIR+ λSWIR (2)
where λNIR = spectral reflectance in near infrared region
λSWIR = spectral reflectance in shortwave infrared region
NDWI index is a good indicator of water content of leaves and is used for detecting and monitoring the humidity of the vegetation cover. The SWIR reflectance reflects changes in both the vegetation water content and the spongy mesophyll structure in vegetation canopies, while the NIR reflectance is affected by leaf internal structure and leaf dry matter content but not by water content. The combination of the NIR with the SWIR removes variations induced by leaf internal structure and leaf dry matter content, improving the accuracy in retrieving the vegetation water content. NWDI holds considerable potential for drought monitoring because the two spectral bands used for its calculation are responsive to changes in the water content (SWIR band). The value of NDWI ranges from -1 to 1. The common range for green vegetation is -0.1 to 0.4.
4. DATA USED
4.1 Satellite Data
Multi-temporal AWiFS datasets from Resourcesat-2 - starting from first fortnight of October to end of February/March were selected for each year during 2008-2012 based on crop calendar in the districts. The data was subjected to Top-of-Atmosphere (TOA) correction by using the saturation radiance values of the four AWiFS bands along with the sun elevation angle as on the date of pass.
4.2 Meteorological data
The maximum and minimum temperatures from Automatic Weather Station (AWS) of IMD were used in the study. The weekly averages were generated for the test sites. Since the historical data from AWS is not available, the nearby meteorological observatory data is being used.
In addition, ancillary datasets viz., historical data of crop statistics, crop calendar of the district, soil and land degradation and irrigation infrastructure were also used for analysis.
5. METHODOLOGY
Required weather and soil files were prepared according to DSSAT format and crop simulation was carried out for the six above mentioned districts. Standard management practices were followed to simulate the wheat yield. As district level simulated yield was averaged over a district and compared with the observed average yield for the corresponding year.
The growth and development modules of the CERES model use different sets of species, ecotype and cultivar coefficients (P1V, P1D, P5, G1, G2, G3 and PHINT) which define the phenology and crop growth in time domain. The DSSAT-CERES wheat model was calibrated and validated for HD 2329 variety (one of the most popular varieties of the region) from 1998 to 2009. For calibration, the cultivar coefficients were obtained sequentially, starting with the phenological development parameters related to flowering and maturity dates (P1V, P1D, P5 and PHINT) followed by the crop growth parameters related with kernel filling rate and kernel numbers per plant (G1, G2 and G3) (Hunt and Boot, 1998; Hunt et al., 1993). The analysis showed that the most sensitive and, therefore, most important parameters were P1D for wheat phenology, and G1 and G2 for crop components and yield structure. These parameters were adjusted based on the data for the year 2006/08 and their optimum was finally determined where the root mean square error (RMSE) of the simulated and observed plant development stages, yield/yield components and yield structure was at minimum. The calibration was validated based on crop development and yield data from the years 2008/09 to 2011/12.
6. RESULTS
6.1 Calibration and Validation of CERES
To evaluate the quality of the simulations different quality measures were applied. For a quick overview of the modeling quality, graphs of the measured against the simulated values were drawn together with the linear regression, the correlation coefficient and the 1:1 line. Without any model error, the model calibration are 123.3 and 165.6 kg/Ha respectively.
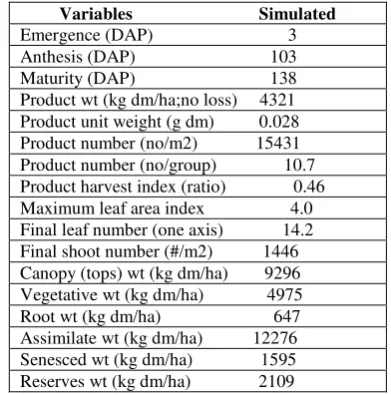
Table 1 Overview of wheat crop simulation in Sirsa using CERES
Figure. 1 Observed and simulated wheat yield in Sirsa for the study period
6.2 Time Series Vegetation Indices
Figure. 2 Resourcesat 2 AWiFS derived FCC and wheat mask for Sirsa district during rabi 2009-10
NDVI and NDWI were computed for all the study years and presented in Figure.3 and Figure.4 respectively. From the time series NDVI and NDWI images, zonal statistics were extracted for the wheat season during 2008-09 to 2011-12.The NDWI and the scaled values of NDVI for 2009-10 is presented in Table.2
Figure. 3 Time series NDVI of Sirsa for a representative year (2009-10)
Figure.4 Time series NDVI of Sirsa for a representative year (2009-10)
Date DAS Scaled NDVI NDWI
27 October 2009 No crop 62.437 -0.052
20 November 2009 13 55.976 -0.06
24 December 2009 47 62.203 -0.052
31 January 2010 84 88.668 0.085
14 February 2010 98 89.149 0.124
Table 2 Scaled NDVI and NDWI profile with days after sowing (DAS)
6.3 Simulation of Wheat yield attributes
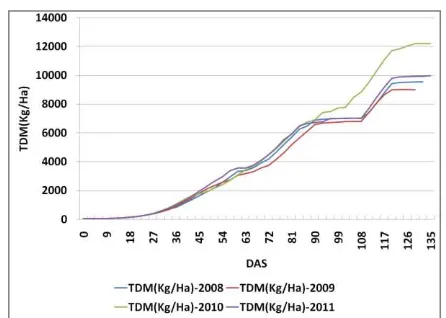
Wheat crop was simulated using callibrated CERES crop simulation model embedded in DSSAT 4.Temporal profiles of the yield attributes like LAI,TDM and yield are depicted in Figure 5, Figure 6 and Figure 7.
Figure.5 Temporal profiles of simulated LAI of wheat crop in Sirsa district
Figure.6 Temporal profiles of simulated TDM of wheat crop in Sirsa district
It is seen that the observed district average yield of wheat is close to the simulated grain yield over the years though the model under estimate LAI values. In this study the temporal course of simulated LAI was given importance in order to evaluate the model performance .These simulated parameters were correlated with the spectral vegetation indices like NDVI and NDWI and the corresponding graphs for a representative year (2008-09) are presented in Figure. 8 and Figure 9.
Figure.8 Temporal profiles of scaled NDVI of wheat crop in Sirsa district
Figure.9 Temporal profiles of NDWI of wheat crop in Sirsa district
Figure.10 Scatter plot of NDVI vs LAI
It is observed that NDVI profiles for 2008-09 and 2010-11 follow similar trend where as NDVI values for 2009-10 are relatively lower. For all the years NDWI values gradually tend to positive as the crop moves to maturity. There exists an exponential relationship between simulated LAI and scaled
NDVI (Figure.10).An exponential model was fitted to the scatter plot of LAI vs. NDVI. Further, correlation coefficients between simulated grain yield and NDVI were computed for different growth stages for different years and it was found that r2 is significantly high (>0.8) for all growth stages over the years.
7. SUMMARY AND CONCLUSIONS
This study was carried out to evaluate the performance of crop simulation model CERES for wheat crop in Sirsa district. The model was well calibrated and validated for the study period using the one of the most popular wheat variety .Though the simulated district average yield was closer to the observed one over the years, the yield attribute like LAI found to be under simulated and it requires further calibration with field experiments. Significantly high correlation coefficient was observed for NDVI and yield at all the growth stages over the years. This is a basic study towards spatialisation of crop simulation model for wheat crop using remote sensing derived bio-physical parameters.
8. REFERENCES
Batchelor, W. D., B. Basso, and J. O. Paz. 2002. Examples of strategies to analyze spatial and temporal yield variability using crop models. European J. Agron. 18(2): 141-158.
Dadhwal, V.K., Sehgal, V.K., Singh, R.P., and Rajak, D.R.,2002. Wheat yield modelling using satellite remote sensing with weather data: Recent Indian experience, Mausam
Dadhwal, V.K., 2003.Crop growth and productivity monitoring and simulation using Remote Sensing and GIS. Satellite Remote Sensing and GIS Applications in Agricultural Meteorology pp. 263-289
Dadhwal, V.K., Sehgal, V.K., Singh, R.P. and Rajak, D.R. 2003. Wheat yield modeling using satellite remote sensing with weather data: Recent Indian experience. Mausum, 54(1): 253-262.
Dele´colle, R., Maas, S.J., Gue´rif, M., Baret, F., 1992. Remote sensing and crop production models—present trends. ISPRS J. Photogrammetry Remote Sens. 47, 145–161.
Dorigo, W. A., R. Zurita-Milla, A. J. W. de Wit, J. Brazile, R.Singh, and M. E. Schaepman. 2007. A review on reflective remote sensing and data assimilation techniques for enhanced agroecosystem modeling. Intl. J. Applied Earth Observation and Geoinformation 9(2): 165-193.
Gijsman, A.J., P.K. Thornton, and G. Hoogenboom. 2007. Using the WISE database to parameterize soil inputs for crop simulation models. Computers and Electronics in Agriculture 56:85-100.
Hoogenboom, G., J.W. Jones, P.W. Wilkens, C.H. Porter, K.J. Boote, L.A. Hunt, U. Singh, J.L. Lizaso, J.W. White, O. Uryasev, F.S. Royce, R. Ogoshi, A.J. Gijsman, and G.Y. Tsuji. 2009. Decision Support System for Agro-technology Transfer (DSSAT) Version 4.5 [CD-ROM]. University of Hawaii, Honolulu, Hawaii.
Inoue, Y. 2003. Synergy of remote sensing and modeling for estimating ecophysiological processes in plant production. Plant Production Sci. 6(1): 3-16.
Jones, J. W., Hoogenboom, G., Porter, C. H., Boote, K. J.,
Batchelor, W. D., Hunt, L. A., … Ritchie, J. T. (2003). The
DSSAT cropping system model. Europ J Agronomy, 18, 235-265.
Karnieli, A., 2003. Natural vegetation phenology assessment by ground spectral measurements in two semi-arid environments. Int. J. Biometeorol. 47, 179–187.
Maas, S. J. 1988a. Use of remotely-sensed information in agricultural crop growth models. Ecological Modelling 41(3-4): 247-268.
Maas, S. J. 1988b. Using satellite data to improve model estimates of crop yield. Agron. J. 80(4): 655-662.
Moran, M. S., Y. Inoue, and E. M. Barnes. 1997. Opportunities and limitations for image-based remote sensing in precision crop management. Remote Sensing of Environ. 61(3): 319-346.
Moulin, S., A. Bondeau, and R. Delecolle. 1998. Combining agricultural crop models and satellite observations: From field to regional scales. Intl. J. Remote Sensing 19(6): 1021-1036.
Nain AS, Dadhwal VK and Singh TP. 2002. Real time wheat yield assessment using technology trend and crop simulation model with minimal dataset. Current Science, Vol. 82, No.10, 1255-1258
NRSA, 2007. National Wheat Acreage Estimation – Procedure Document (NRSA/RSGIS-AA/FASAL/NWPF/TECHMAN/ APRIL-07)
Ritchie, J.T., U. Singh, D.C. Godwin, and W.T. Down. 1998. Ceres growth, development and yield. p. 79–98. In G.Y. Tsuji et al. (ed.) Understanding options for agricultural production. Kluwer Academic, Dordrecht, The Netherlands.
Rouse, J.W., R.H.Haas, J.A.Schell, and D.W.Deering, 1973: Monitoring vegetation systems in the great plains with ERTS, Third ERTS Symposium, NASA SP-351 I: 309-317.
Tsuji, G. Y. (2003). DSSAT4.0 User’s Guide, 1-4. The
University of Hawaii.
Weiss, M., Baret, F., Myneni, R.B., Pragnere, A., Knyazikhin, J. (2000): Investigation of a model inversion technique to estimate canopy biophysical variables from spectral and directional reflectance data. Agronomie, INRA, Vol.20, p.3-22.
Whisler, F. D., B. Acock, D. N. Baker, R. E. Fye, H. F. Hodges, J.R. Lambert, H. E. Lemmon, J. M. McKinion, and V. R. Reddy.1986. Crop simulation models in agronomic systems. Advances in Agron. 40: 141-208
Xie, Y., Z. Sha, and M. Yu. 2008. Remote sensing imagery in vegetation mapping: A review. J. Plant Ecology 1(1): 9-23.