A comparison of methods for determining forest
evapotranspiration and its components: sap-flow, soil water budget,
eddy covariance and catchment water balance
Kell B. Wilson
a,∗, Paul J. Hanson
b, Patrick J. Mulholland
b,
Dennis D. Baldocchi
c, Stan D. Wullschleger
baAtmospheric Turbulence and Diffusion Division, NOAA, P.O. Box 2456, Oak Ridge, TN 37831, USA bEnvironmental Sciences Division, Oak Ridge National Laboratory, P.O. Box 2008, Oak Ridge, TN 37831, USA
cDepartment of Environmental Science, Policy and Management, University of California at Berkeley,
151 Hilgard Hall, Berkeley, CA 94720, USA
Received 17 February 2000; received in revised form 13 July 2000; accepted 13 July 2000
Abstract
A multi-year, multi-technique study was conducted to measure evapotranspiration and its components within an uneven-aged mixed deciduous forest in the Southeastern United States. Four different measurement techniques were used, including soil water budget (1 year), sap flow (2 years), eddy covariance (5 years), and catchment water budget (31 years). Annual estimates
of evapotranspiration were similar for the eddy covariance and catchment water balance techniques, averaging 571±16 mm
(eddy covariance) and 582±28 mm (catchment water balance) per year over a 5-year period. There were qualitative similarities
between sap flow and eddy covariance estimates on a daily basis, and sap flow estimates of transpiration were about 50% of annual evapotranspiration estimated from eddy covariance and catchment studies. Soil evaporation was estimated using a second eddy covariance system below the canopy, and these measurements suggest that soil evaporation explains only a small portion of the difference between sap flow estimates of transpiration and eddy covariance and catchment water budget estimates of evapotranspiration. Convergence of the catchment water balance and eddy covariance methods and moderately good energy balance closure suggests that the sap flow estimates could be low, unless evaporation of canopy-intercepted water was especially large. The large species diversity and presence of ring-porous trees at our site may explain the difficulty in extrapolating sap flow measurements to the spatial scales representative of the eddy covariance and catchment water balance methods. Soil water budget estimates were positively correlated with eddy covariance and sap flow measurements, but the data were highly variable and in error under conditions of severe surface dryness and after rainfall events. © 2001 Elsevier Science B.V. All rights reserved.
Keywords: Evapotranspiration; Eddy covariance; Catchment water balance
∗Corresponding author. Tel.:+1-865-576-2317;
fax:+1-865-576-1237.
E-mail address: [email protected] (K.B. Wilson).
1. Introduction
Evapotranspiration is an important process across a wide range of disciplines, including ecology, hy-drology and meteorology. Because of this multidisci-plinary focus, a number of methodologies have been
developed to measure evapotranspiration, or compo-nents of evapotranspiration (transpiration, soil evapo-ration and interception), across a spectrum of spatial scales ranging from individual plants, soil samples and soil profiles, the atmospheric surface layer, and entire watersheds. Examples of measurement techniques include soil (Daamen et al., 1993) and plant weigh-ing lysimeters (Edwards, 1986), soil water budgets (Eastham et al., 1988; Jaeger and Kessler, 1997; Cuenca et al., 1997), sap flow (Smith and Allen, 1996), plant chambers (Cienciala and Lindroth, 1995), chemical tracing (Calder et al., 1986; Kalma et al., 1998), Bowen ratio (Denmead et al., 1993), eddy co-variance (Baldocchi et al., 1988) and catchment water balance (Bosch and Hewlett, 1982; Swift et al., 1988). All of these methods have been used to estimate water vapor exchange rates between the surface and atmosphere, but the techniques often vary consider-ably in at least three aspects. First, each technique is only representative within a particular spatial and tem-poral scale, and either interpolation or extrapolation is necessary to infer evaporation rates outside these scales. The techniques also differ in whether they measure evapotranspiration or just one or several of its components. Thirdly, each of the techniques necessar-ily introduces a unique set of particular assumptions, technical difficulties, measurement errors and biases. As a result, specific inherent advantages and limi-tations are introduced for each of the measurement techniques. Four of the less intrusive techniques that are addressed in this study, soil water budget, sap flow, eddy covariance (both above and below canopy) and catchment water balance, illustrate how these advan-tages and limitations differ with technique. A summary of the approximate measurement scale, the compo-nent of evapotranspiration measured, and some of the
Table 1
Summary of the methods used to estimate evapotranspiration and its components in this studya
Method Component Spatial scale (m2) Time scale
Soil water budget Et+Es 100 Daily
Sap flow Et 102 Half-hour
Eddy covariance (below canopy) Es 102 Half-hour
Eddy covariance (above canopy) Et+Es+Ei 104 Half-hour
Catchment water budget Et+Es+Ei 106 Annual
aShown are the methods, the component of evapotranspiration measured (E
t=transpiration;Es=soil evaporation;Ei=interception),
the approximate representative spatial scale of the measurement and the highest meaningful resolution time scale used to estimate evaporation.
major advantages and limitations of each of the four methods are shown in Table 1and discussed below.
Eddy covariance measurements above the canopy provide estimates of evapotranspiration at the high temporal resolution necessary to examine processes, but also at much greater spatial scales than sap flow (Table 1). Simultaneous measurements of sensible heat flux and other trace gas fluxes, such as carbon dioxide, are also feasible. Therefore, this technique can probe vital links between hydrological and other biogeochemical processes. In addition, simultaneous heat flux and energy balance estimates are used as independent checks on the validity of the measure-ments (Baldocchi et al., 1988). A monitoring system beneath tall vegetation can provide independent esti-mates of soil evaporation (Saugier et al., 1997; Wilson et al., 2000a), but the estimates are usually represen-tative of a much smaller area than the above-canopy measurements (Table 1) (Baldocchi, 1997; Wilson and Meyers, 2000). One weakness of the eddy co-variance technique is that the size and shape of the representative region contributing to the measured flux, the flux ‘footprint’, is not fixed in time (Horst and Weil, 1992; Baldocchi, 1997). Eddy covariance measurements are sometimes difficult to interpret during weakly turbulent periods, usually at night (Lee et al., 1996; Paw U et al., 2000; Baldocchi et al., 2000). The technique also cannot directly account for advection in areas of significant heterogeneous or complex terrain, limiting its applicability in some locations.
The catchment water balance provides a single inte-grated assessment of annual evapotranspiration for an area of fixed dimensions (the catchment) that is often considerably larger than that measured by the other techniques. However, the method provides essentially no information on processes at temporal scales shorter than the annual cycle (Table 1). This technique is also subject to errors based on assumptions concerning the timing and presence of full system recharge (soil wa-ter storage) or the appropriate extent of groundwawa-ter divides (Luxmoore and Huff, 1989).
A comparison of these different techniques allows independent estimates of water vapor exchange at a particular site, and tests the general applicability of extrapolating smaller scale measurements. Processes controlling evapotranspiration and its separation into components can be examined with a spatial and tem-poral detail not available when only a single measure-ment technique is used.
Several studies have compared sap flow and eddy covariance measurements (Köstner et al., 1992; Berbigier et al., 1996; Hogg et al., 1997; Granier et al., 1990, 2000; Saugier et al., 1997). However, these studies have primarily focused on monospecific and even-aged stands. The experiments were often for short time periods, and analysis was usually limited to only these two methodologies. Comparisons be-tween the soil water budget and eddy covariance mea-surements have been performed in Jack Pine stands (Cuenca et al., 1997; Moore et al., 2000). Historically, catchment water balance studies have focused on the effects of disturbance on streamflow, rather than mea-suring long-term evapotranspiration rates (Bosch and Hewlett, 1982). Comparisons of catchment water bal-ance with these other techniques are also rare because the comparison requires measurements that span at least one annual cycle.
In this study, we present a multi-year comparison of these four independent techniques for estimating evapotranspiration and its components in an east Ten-nessee watershed containing a mixed deciduous for-est. Measurements based on the soil water budget have been performed for 1 year, sap flow for 2 years, eddy covariance for 5 years and catchment water balance for 31 years. We examine the consistency of estimates between each of the techniques in providing estimates of evapotranspiration and its components on daily to annual time scales, and discuss the specific advantages and limitations provided by each of the methods.
2. Methods
2.1. General site characteristics
of this forest are described in Wilson and Baldocchi (2000) and Wilson et al. (2000a). A drought occurred during the late summer of 1998, one of the 2 years when at least three of the measurement techniques were active. Details concerning soil water content and leaf-level gas exchange responses during this drought can be found in Wilson et al. (2000b,c). The soil is well drained and is classified as a typic Paleudult, which encompasses clayey and kaolinitic soils. A more detailed description of the canopy architecture, species composition and soil properties are provided by Luxmoore et al. (1981), Hutchison et al. (1986) and Johnson and Van Hook (1989).
2.2. Soil water budget measurements
Soil water budget measurements in 1998 showed that soil water monitoring at only two depths (100 and 300 mm) and two soil pedons during that year was in-adequate for complete characterization of soil water depletion under severe drought conditions. Therefore, instrumentation for monitoring soil water to a depth of 700 mm was added in 1999, consistent with a re-port showing that the majority of tree roots (>90%) are within the upper 600 mm of soil at our study site (Joslin and Wolfe, 1998). Six additional soil pits were added in 1999, and these new pits included soil water content measurements down to four depths (100, 300, 500 and 700 mm) and are the basis of the measure-ments discussed in this study.
Soil water content was measured using water con-tent reflectometers at each soil depth (Model CS615, Campbell Scientific, Inc., Logan, UT). Time domain reflectometer waveguides (TDR; Soil Moisture Equip-ment Corp., Santa Barbara, CA) were also co-located with the soil water reflectometers as a check against the factory supplied calibrations. The sensors were monitored each minute and the hourly means were stored on a Campbell Scientific CR10X data logger (Campbell Scientific, Inc., Logan, UT).
Several assumptions were made to estimate evap-otranspiration from the soil water content measure-ments. The measured soil water contents at 100, 300, 500 and 700 mm were assumed to apply to soil lev-els at 0–150, 150–350, 350–550 and 550–750 mm, respectively. These levels were chosen asymmetri-cally about the measurements to more accurately represent vertical variation in the rooting depths and
soil characteristics. No soil water was assumed to contribute to transpiration from below 750 mm in these calculations. Because rain inputs and move-ment of soil water within the soil profile confound estimates of soil water extraction using the soil water budget approach, we eliminated all days with rain and up to two additional days following heavy rain events. Such corrections allowed only 43% of the growing season days to be used for application of the soil water budget method. Because of the large amount of missing data, annual evapotranspiration totals based on the soil water budget method were not attempted.
2.3. Sap flow measurements
In the same region as the soil water content and eddy covariance measurements, individual tree sap flow probes were installed on 15 canopy trees (four red maple, four loblolly pine, two chestnut oak, two white oak, one red oak and two yellow-poplar). The stem diameter in these trees ranged from 240 to 630 mm and tree height varied from 20 to 31 m. Water use by common understory saplings (one red maple, one dog-wood and one beech) was also measured. The sap flow observations were operated automatically with mini-mal disruptions (i.e. only 9% of the hourly data were missing). If all observations were not available during daylight hours that day was eliminated for compara-tive analyses in this paper, but interpolated estimates were used for calculating annual transpiration.
Sap flow measurements were scaled to stand tran-spiration from knowledge of species composition and sapwood area. Transpiration (kg m−2s−1) for each species (Tx, where subscript x refers to a par-ticular species) was computed each hour from the mean sap flow for each species (SVx, m s−1) and the species-specific sapwood area index (SAIx, ratio of sapwood area to ground area) of the region surround-ing the tower used for eddy covariance measurements
Tx=ρwSVxSAIx (1)
whereρwis the density of liquid water. Cross-sectional
sapwood area was computed from the measured stem diameter using species-specific allometric equations (Wullschleger et al., 2000a). Species composition and sapwood area index for each species was determined from 30 inventory plots, each with a 10 m radius, within a 700 m radius of the tower used for eddy covariance measurements. The plots were within the predominate wind directions (W to SW and NE) of the tower. All estimates of sapwood area were ad-justed according to known radial variation in sap flow for the individual species (Wullschleger et al., 2000a). Canopy transpiration (Et) was computed by
sum-ming the contributions from each species
Et=X
x
Tx (2)
2.4. Eddy covariance measurements
Two eddy covariance systems were used in the study. One system was mounted on a walk-up tower 10 m above the canopy and has operated continuously since autumn of 1994. A second system was placed within the canopy in autumn 1997, 2 m above the ground. Virtually no vegetation was present between this second system and ground level, providing di-rect estimates of water vapor exchange from the soil and leaf litter. Numerous tests have been conducted to validate the application of this method below the canopy (Baldocchi and Meyers, 1991; Wilson et al., 2000a; Wilson and Meyers, 2000). Wind velocity and virtual temperature fluctuations were measured with a three-dimensional sonic anemometer (model SWS-211/3 K, Applied Technology, Boulder, CO). Fluctuations in humidity were measured with an open path, infrared absorption gas analyzer (Auble and
Meyers, 1992). Vertical flux densities were evaluated by computing the mean covariance of water and sen-sible heat fluctuations with the fluctuating vertical velocity (Baldocchi et al., 1988). Mean scalar and velocity quantities were determined using a digital recursive filter with a 400 s time constant. Additional details on instrumentation and flux measurements are provided in Wilson and Baldocchi (2000) and Wilson et al. (2000a).
To obtain daily and annual sums it was necessary to estimate missing or rejected data. Half-hourly val-ues of latent heat fluxes (LE) that were missing or of insufficient quality (i.e. due to anomalous turbu-lence statistics during rain events or instrument mal-function) were estimated using the two-week average Priestly–Taylor coefficient (α=E/Eeq, Priestly and
Taylor, 1972) where E is the measured evaporation (kg m−2s−1) and Eeq is the equilibrium evaporation
(Wilson and Baldocchi, 2000). Much of the missing data occurred at night or when precipitation or dew obscured the sensors. These are periods when fluxes were expected to be small. The portion of missing or rejected data was 14% on the tower and 16% on the forest floor system.
Canopy evapotranspiration (E) was estimated from the tower system, and soil evaporation (Es) was
esti-mated from the system near the forest floor. The dif-ference between the two (E−Es) was estimated to be
the sum of canopy transpiration (Et) and evaporation
of intercepted rainfall (Ei) because
E=Et+Es+Ei (3)
2.5. Catchment water balance measurements
Weirs (120◦V-notch) were installed in 1967 on the
two first-order streams (East and West Forks) drain-ing the combined Walker Branch Watershed near their confluence (Luxmoore and Huff, 1989). Stage height at each weir was recorded at 15 min intervals and in-stantaneous discharge (Q, in l s−1) was calculated from
Q=2301 SH2.449 (4)
total annual discharge by the surface area of the entire watershed (97.5 ha).
From 1967 to 1980, precipitation was determined using the hourly means from Belfort weighing bucket rain gauges located at five ridge clearings within or bordering the watershed. After 1980, the rain gauge network was reduced to two ridge sites. In Novem-ber 1998, electronic tipping buckets (Telog Model R-2107) were installed at the active sites, replacing the weighing bucket gauges. Annual evapotranspira-tion integrated over the entire water catchment was then estimated as the residual between total annual precipitation and total annual runoff.
2.6. Other measurements
Leaf area was computed continuously near the tower by applying Beers Law to spatially integrated solar radiation measurements above and below the canopy (Greco and Baldocchi, 1996; Wilson and Baldocchi, 2000). The canopy extinction coefficient was assumed to be 0.58 (Hutchison et al., 1986).
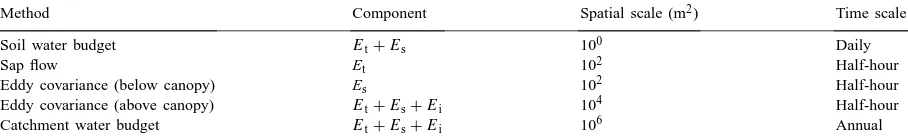
Fig. 1. Annual estimates of evapotranspiration estimated from the catchment water balance (d) and eddy covariance (h) methods. Annual estimates of transpiration from sap flow (.) and annual equilibrium evaporation (△) are also shown. The estimate of sap flow in 1996 is from a different portion of the watershed (Wullschleger et al., 2000a) from the sap flow measurements in 1998 and 1999.
Canopy wetness was determined from the voltage output of a bridge resistor placed 10 degrees from hor-izontal above the canopy. When the surface of the in-strument became wet, the resistance was substantially reduced and was indicated by changes in voltage.
3. Results
3.1. Comparisons of techniques
Annual estimates of evapotranspiration based on the eddy covariance (squares) and catchment water bal-ance (circles) methods are shown in Fig. 1. There is good agreement between the catchment water balance and eddy covariance methods on the magnitude of an-nual evapotranspiration over the 5 years when both measurements were performed. The average annual evapotranspiration during this 5-year period was 582±
methods do not completely agree on the interannual trends. The catchment estimates suggested maximums in 1996 and 1999, but eddy covariance indicated the highest rate in 1997. The mean annual difference be-tween the two estimates was 60 mm, or about 10% of the average evapotranspiration, which is of similar magnitude to the interannual variation. Equilibrium evaporation (Priestly and Taylor, 1972; open triangle in Fig. 1) for the 5 years ranged from 793 to 876 mm with a mean of 827 mm, considerably greater than the empirically measured rates. There was not an obvious relationship between measured and equilibrium evap-otranspiration at the annual scale.
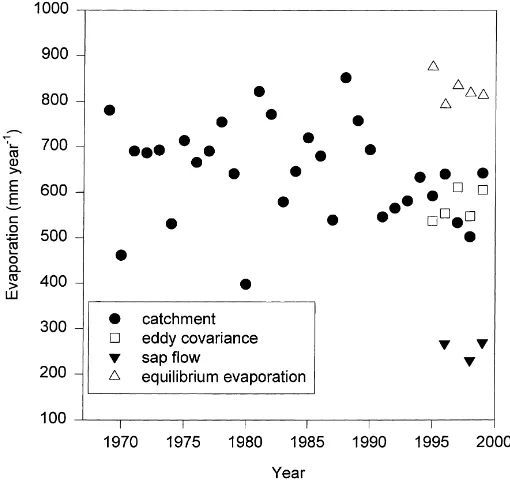
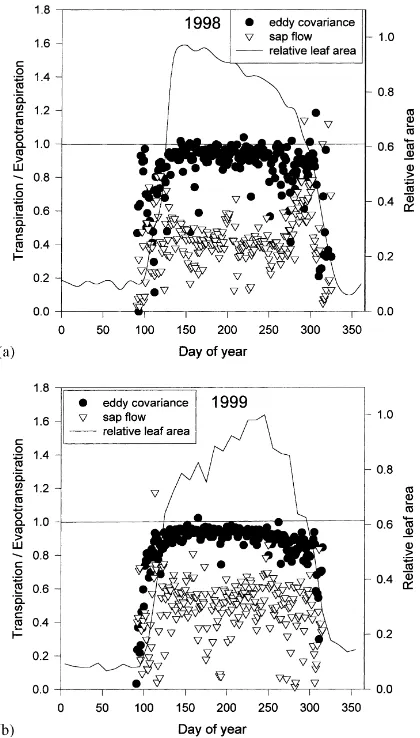
Fig. 2. Daily estimates of evapotranspiration from eddy covariance (d) and of transpiration from sap flow (▽) during (a) 1998 and (b) 1999. Also shown in (b) is the soil water budget estimates (cross hatchedh).
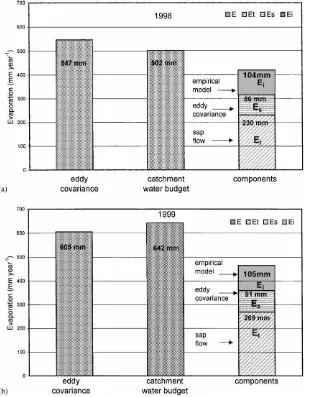
Fig. 1 also shows estimates of annual transpiration estimated from the sap flow measurements in 1998 (230 mm) and 1999 (269 mm). The corresponding to-tal annual evapotranspiration rates from the eddy co-variance method were 547 mm in 1998 and 605 mm in 1999, and the water catchment balance estimates were 502 and 642 mm.
Fig. 3. Relationship between sap flow estimates of transpiration (Et) and eddy covariance estimates of E−Es (above-canopy
eddy covariance minus below-canopy eddy covariance) during (a) 1998 and (b) 1999. Days with rainfall are indicated by (▽) and dashed regression line. ‘Dry’ days are indicated by (d) and solid regression line. Intercepts in (a) are 0.18 (wet) and 0.18 (dry). Slopes in (a) are 0.33 (wet) and 0.40 (dry). Intercepts in (b) are −0.30 (wet) and 0.15 (dry). Slopes in (b) are 0.61 (wet) and 0.54 (dry).
daily estimates of Et from sap flow and eddy
co-variance estimates of evapotranspiration minus soil evaporation (Fig. 3). The correlation was altered slightly depending on whether measurable precipi-tation occurred during the day (triangles in Fig. 3), which was when evaporation of intercepted rainfall (Ei) was presumably greater. A similar conclusion
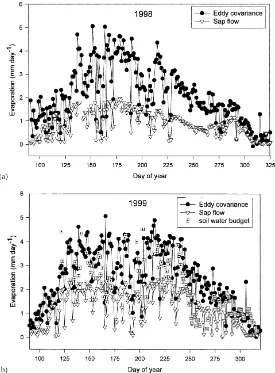
Fig. 4. (a) Sap flow estimates of transpiration as a function of at-mospheric vapor pressure deficit above the canopy. Measurements were either during a non-drought (▽, days 130–219) or drought (d, days 220–275) periods during 1998. (b) Same as (a) except for eddy covariance estimates ofE−Es against vapor pressure
deficit.
was found when data were sorted according to the canopy wetness sensor (not shown).
with vapor pressure deficit (vpd) over a wide range of vpd. As the soil dried, both methods indi-cate that water fluxes were suppressed for all val-ues of vpd and saturated at fairly low valval-ues of vpd.
3.2. Components of evapotranspiration
Any attempt to reconcile the quantitative differences between sap flow estimates of annual transpiration
Fig. 5. The left two bars in each panel show the two estimates (eddy covariance and catchment water balance) of annual evapotranspiration in (a) 1998 and (b) 1999. The far right bar in each of the two panels shows the components of evapotranspiration; Et estimated from sap
flow, and Esestimated from eddy covariance at the forest floor. Eiis obtained from an empirical model and is not a measured value.
Evaporation of rainfall intercepted by the forest canopy (Ei) is an additional component of
evapo-transpiration not considered by the sap flow method, but is implicit in the estimates by the other methods. Rainfall interception was not measured as a separate component in this study, but relationships have been developed for the Walker Branch forest as a function of leaf area index (Huff et al., 1977; Luxmoore, 1983). These relationships predict interception contributions of 104 mm (1998) and 105 mm (1999) (Fig. 5). Al-though annual Ei was not measured to validate the
empirical model, independent estimates of Ei
dur-ing the dormant season were available from eddy covariance measurements. During this time the dif-ference in eddy covariance estimates of evaporation above and below the canopy should be interception, because transpiration is essentially zero. Measured dormant season estimates are between 21 mm (1998) and 25 mm (1999), compared to empirical model estimates of 48 mm (1998) and 38 mm (1999), in-dicating the empirical estimates are about 50–100% greater than that estimated by eddy covariance. The empirical estimates may be too high because they include some evaporation from leaf litter, which is considered ‘soil evaporation’ in our analysis. An-nual fog interception by a nearby pine forest during 1986–1989 was estimated to be small, only about 10 mm (Johnson and Lindberg, 1992). This would likely be even smaller for a deciduous forest, and we did not include this component in our analysis. Although maximum annual interception rates on the order of 100 mm are predicted for this forest, inter-ception rates of 231 mm (1998) and 245 mm (1999) are necessary to account for the discrepancy between eddy covariance/catchment water balance methods and the sap flow method (Fig. 5).
The transpiration ratio is defined as the ratio of transpiration to evapotranspiration (Et/E). The
differ-ence between the above (E) and below (Es) canopy
water flux isE−Es =Et+Ei(see Eq. (3)). Canopy interception (Ei) is nonzero over an annual cycle, but
should be negligible on many days without rainfall. Therefore, on days when a dry canopy is assumed (Ei = 0 so that E−Es = Et), the transpiration
ratio can be estimated directly from above and be-low canopy eddy covariance data. The transpiration ratio can also be estimated as the ratio between tran-spiration estimated directly from sap flow and
evap-Fig. 6. The transpiration ratio (transpiration/evapotranspiration) and relative leaf area index (leaf area index in relation to maximum) in (a) 1998 and (b) 1999. Evapotranspiration is estimated from the above-canopy eddy covariance measurements. Transpiration is estimated either from eddy covariance, and assuming dry canopy (Ei=0) (d), or from sap flow estimates (▽).
otranspiration estimated by the above-canopy eddy covariance system. Fig. 6 shows the transpiration ratio using these two methods, either eddy covariance to obtain Et or sap flow to obtain Et. When eddy
covari-ance data is used to obtain Et (assumingEi =0) the
late season drought in 1998. There is some indication of a decreased ratio during and after the most intense drought period in 1998 (days 245–265), just before decreasing more rapidly during senescence (Fig. 6a). In contrast, the transpiration ratio using sap flow es-timates of transpiration was considerably lower and showed a different seasonality. Before full leaf expan-sion, the ratio peaked around 0.8 in 1998, but quickly declined to typically less than 0.5 for the remainder of the summer, until increasing again just before au-tumn senescence (Fig. 6a). The early and late season peaks in the sap flow estimates of the transpiration ratio were much more subdued in 1999 compared to 1998 (Fig. 6b). The ratio was also slightly greater in 1999 compared to 1998 during most of the grow-ing season, but was still less than eddy covariance estimates.
3.3. Sensitivity of sap flow estimates to footprint assumptions
In addition to canopy interception, another possible source of divergence between the sap flow, eddy co-variance and catchment water budget methods is the assumed species composition and basal areas used to scale up the sap flow estimates (Eqs. (1) and (2)). Species composition and basal area are not constant within the tower footprint, varying with wind direc-tion and distance from the tower. In a 700 m radius circle extending from the meteorological tower, mean basal area ranged from 21.7 to 34.9 m2ha−1within the 30 subplots, with a population mean of 29.2 m2ha−1. The effect of this variability on the sap flow estimates was examined using the species composition and basal area along each of the six different transects that en-compass the primary wind directions at this site. Us-ing these six different estimates of species composi-tion and basal area, sap flow estimates of transpiracomposi-tion ranged from 208 to 230 mm per year in 1998 and from 243 to 289 mm per year in 1999.
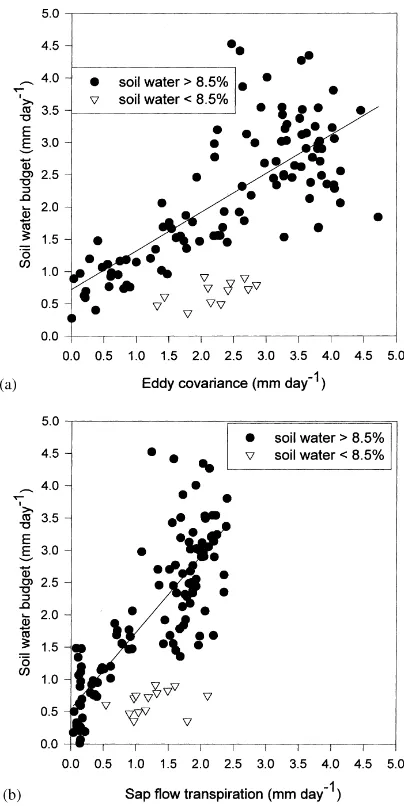
3.4. Soil water budget
Daily estimates of evapotranspiration from the soil water budget equation are shown for 1999 in Fig. 2b. There was a positive correlation between estimates of stand evapotranspiration from the soil water budget and those derived from sap flow and eddy covariance
Fig. 7. Daily estimates of evapotranspiration from the soil budget method in 1999 against (a) eddy covariance estimates and (b) sap flow estimates of transpiration. Data are segregated into days when the soil water content was above and below 8.5% by volume.
4. Discussion
There was good agreement on the magnitude of annual evapotranspiration over the 5 years between eddy covariance and catchment water balance meth-ods, averaging about 580 mm, increasing the confi-dence in these two approaches. Estimates of average annual evapotranspiration from watershed catchment studies at the Coweeta Hydrologic Laboratory (within 150 km of Walker Branch), where precipitation rates are about 50% greater, range from 500 mm (high ele-vation) to 900 mm (low eleele-vation) (Swift et al., 1988). In a forested watershed in West Virginia, both the an-nual average evapotranspiration (640 mm) and precip-itation (1458 mm) are more similar to Walker Branch (Adams et al., 1994).
The sap flow and eddy covariance estimates show general similarity in their daily fluctuations and re-sponse to the environment. However, there is an ap-parent discrepancy between the higher estimates of evapotranspiration from the eddy covariance and water catchment methods and lower estimates of transpira-tion from the sap flow method. The eddy covariance systems indicate that soil evaporation was an impor-tant, but relatively small, contribution to total annual flux (16%, and less than 8% during most of the grow-ing season), similar to estimates from other decidu-ous forests (Kelliher et al., 1992; Moore et al., 1996; Grimmond et al., 2000). Therefore, the relatively small contribution from this component does not explain why eddy covariance and catchment water balance estimates greatly exceed those from sap flow; how-ever, a third component, evaporation from intercepted water, was not measured but is necessary for direct comparison of the three methods. Estimates of inter-ception from previous measurements and simulations at this site are around 15–20% of the annual evapo-transpiration (Luxmoore and Huff, 1989), similar to many other forests (Calder, 1998). Interception rates needed to reconcile the difference between the eddy covariance/catchment water balance and sap flow mea-surements in this study are at least twice these esti-mates. Interception rates of these higher magnitudes have been observed on an annual basis, but only in wet, high altitude climates, which experience higher annual rainfall, more frequent rainfall and fog events and higher wind speeds than at our site (Calder, 1998). Furthermore, if interception was the major cause of
discrepancy between sap flow and eddy covariance es-timates, correspondence between sap flow and eddy covariance measurements should be vastly superior on days when rainfall was not present or the wetness sen-sor was dry (as in Granier et al., 2000), which was not the case. Thus, sap flow measurements may have sys-tematically underestimated transpiration rates at this site.
Quantitative agreements between sap flow and eddy covariance measurements were better in short-term studies with maritime pine (Berbigier et al., 1996) and beech (Köstner et al., 1992) and in longer-term studies with aspen (Hogg et al., 1997), beech (Granier et al., 2000) and Jack pine (Saugier et al., 1997) than in the current study. In a second maritime pine study (Granier et al., 1990) sap flow estimates were less than 70% of eddy covariance, but these researchers suggested that understory evapotranspiration, which was not mea-sured, may account for these differences. Of these pre-vious studies, four were for monospecific, even-aged stands (Berbigier, 1996; Hogg et al., 1997; Granier et al., 1990; Saugier et al., 1997), quite dissimilar to our study area. The forests studied by Köstner et al. (1992) and Granier et al. (2000) consisted of only one or two species, but with some diversity in tree stature and age. Walker Branch is also an uneven-aged forest, but in addition contains greater species diversity. Species and age diversity decrease the probability that the as-sumed relative contributions from trees instrumented with sap flow probes are representative of the mean source distribution measured by the time-dependent eddy covariance footprint. As a result of this variability at Walker Branch, greater sampling and scaling errors can be expected than in some previous studies when extrapolating sap flow measurements to represent an eddy covariance footprint. However, simplistic scaling procedures based on inventory analysis across a num-ber of plots in the flux footprint did not account for most of the differences between these two methods.
ring-porous trees, with underestimates of sap flow up to 45% being theoretically possible (Clearwater et al., 1999). However, although radial variation in sap flow with sapwood depth were observed (in chestnut oak, data not shown), this variation was not of sufficient magnitude to incorporate the corrections suggested by Clearwater et al. (1999). Technical differences between the original probe design (Granier, 1987) and the commercially-available thermal dissipation probes used in our study should also be evaluated as a possible source of uncertainty. The TDP-30 probes are 30 mm in length and have the heating element contained within a cylindrical stainless-steel housing. This contrasts with the original design of Granier (1987) where the probes were only 20 mm in length and had the heating element wrapped around the probe’s external surface. The possibility that such differences in construction could lead to an underesti-mation of stand transpiration, such as that apparently observed in this study, is unresolved.
Our sap flow estimates of transpiration appear to be too low, but this does not discount errors or biases in the eddy covariance and catchment water balance methods. One source of bias between the two esti-mates is the representative scale. The catchment water balance is integrating over an area of 97.5 ha, while the eddy covariance footprint is about two orders of magnitude less during daytime conditions. Also, when the wind direction has a westerly component (a common occurrence), the eddy covariance flux footprint is technically outside the proper limits of Walker Branch Watershed. Despite these differences in scale, the catchment water balance and eddy co-variance methods agreed on the general magnitude of annual evapotranspiration. However, there was not complete agreement on annual fluctuations between these two methods, and important errors associated with the methodologies and instrumentation should be considered.
There was a lack of complete energy balance clo-sure (80%) from the eddy covariance meaclo-surements at Walker Branch (Wilson and Baldocchi, 2000), indicat-ing a biased error in the flux or available energy (net radiation subtracted by ground heat flux and canopy heat storage) measurements. However, lack of closure indicates that the summed fluxes of heat (latent and sensible) may be biased low, which is opposite of the bias required for eddy covariance and sap flow
calcu-lations to converge. Daily and annual sums of evapo-transpiration from eddy covariance are also subject to errors when missing or rejected data were estimated from regression, but these occurrences were primarily at night when water vapor fluxes are expected to be small. Because the eddy covariance footprint is much smaller below the canopy than above the canopy, soil evaporation is measured over a much smaller area than evapotranspiration, and the two eddy covariance esti-mates may not be directly comparable. These errors in soil evaporation due to representativeness are expected to be on the order of 10% (Wilson and Meyers, 2000). We also expect that estimates of soil evaporation may be biased low by 5–10% as a result of high frequency loss of flux (Wilson and Meyers, 2000). However, neither of these considerations will substantially alter the conclusions presented here.
Potential errors with the catchment water balance method should also be considered. Catchment esti-mates of annual evapotranspiration are based on an indirect calculation of the residual in the water bal-ance equation. The magnitude of this residual is sus-ceptible to ‘leaks’ (deep drainage losses), assumptions concerning the timing and presence of full system recharge, and other assumptions about the area of the groundwater divide relative to the surface water divide on which areal precipitation is determined (Luxmoore and Huff, 1989; Adams et al., 1994; Wullschleger et al., 1998). Walker Branch is underlain by dolomite and may have groundwater inflows or outflows via so-lution cavities or fractured bedrock. It is suspected that the area of the groundwater divide at Walker Branch may exceed the surface water divide by about 5% (Luxmoore and Huff, 1989), which will result in un-derestimates of evapotranspiration.
The large scatter in the relationship between evapo-transpiration estimated using the soil water budget and either eddy covariance or sap flow estimates is likely a result of spatial variability in soil moisture profiles and uncertainties concerning drainage and rooting depths. No attempt was made to locate the zero-flux plane (Rutter, 1968; Cuenca et al., 1997) in this study, which is a likely source of error. However, we did not in-clude periods immediately following rainfall events in our analysis, which is when drainage was likely most important.
1997) Jack pine stands, which carefully accounted for drainage, also did not compare well with eddy covari-ance measurements for much of the season. In the Jack pine studies, the magnitude of the soil water budget estimates of evapotranspiration were about 60% lower than eddy covariance estimates during the second half of the growing season. The soil water budget estimates in our study were also lower than eddy covariance dur-ing dry periods, but possibly because roots were tap-ping water at depths below the deepest measurement probes (700 mm) (Teskey and Sheriff, 1996).
5. Conclusions
1. The reasonably good agreement between the eddy covariance and catchment methods and the moder-ately acceptable energy balance closure gives some confidence in these two approaches for estimat-ing annual evapotranspiration at Walker Branch over spatial scales ranging from approximately 104–106m2. Though imperfect, these methods do not require elaborate scaling considerations to represent spatial areas that are orders of magni-tude greater than sap flow or soil water budget methods.
2. Sap flow and eddy covariance estimates are qual-itatively similar over much of the season. Sap flow measurements have other unique advantages in addressing physiological responses and prob-ing heterogeneous environments. However, in this scaling application the estimates are lower than that from the eddy covariance and catchment water balance methods, even after accounting for other components of evapotranspiration. There may be errors associated with scaling single tree estimates, or measurement errors associated with ring-porous water conducting elements.
3. The soil water budget shows significant correlation with the sap flow and eddy covariance methods. However, data scatter and excessive missing data during periods with rainfall inputs and rapid water movement within the soil profile severely limit its applicability as a method for estimating annual evapotranspiration. Trees also may have accessed water beneath the depth of our measurement probes (700 mm) during the height of drought, underesti-mating evapotranspiration using this method.
Acknowledgements
This work was funded by a grant from NASA/ GEWEX and the US Department of Energy (Ter-restrial Carbon Program) and is a contribution to the Ameriflux and FLUXNET projects. Funding for ORNL researchers (PJH, PJM, SDW) was provided by the NSF/DOE/NASA/USDA/EPA/NOAA Inter-agency Program on Terrestrial Ecology and Global Change (TECO) through NASA’s Earth Science En-terprise Program under Interagency Agreement No. 2013-K057-A1, and the Program for Ecosystem Re-search, Environmental Sciences Division, Office of Health and Environmental Research, U.S. Department of Energy under contract DE-AC05-00OR22725 with University of Tennessee-Battelle LLC. Research was conducted on the Oak Ridge National Environmental Research Park. E. Falge and D. Schindler provided data on species inventory. M. Brewer, M. Hall and D. Auble provided field and laboratory assistance. J. Herewhe and R. Dobosy provided internal reviews.
References
Adams, M.B., Kochenderfer, J.N., Wood, F., Wood, T.R., Edwards, P., 1994. Forty years of hydrometerological data from the Fernow Experimental Forest, West Virginia. USDA, Forest Service, Northeastern Forest Experiment Station, General Technical Report NE-184.
Auble, D.L., Meyers, T.P., 1992. An open path, fast response infrared absorption gas analyzer for H2O and CO2.
Boundary-Layer Meteorol. 59, 243–256.
Baldocchi, D.D., 1997. Flux footprints within and over forest canopies. Boundary-Layer Meteorol. 85, 273–292.
Baldocchi, D.D., Meyers, T.P., 1991. Trace gas exchange at the floor of a deciduous forest. I. Evaporation and CO2 efflux. J.
Geophys. Res. 96, 7271–7285.
Baldocchi, D.D., Hicks, B.B., Meyers, T.P., 1988. Measuring biosphere-atmosphere exchanges of biologically related gases with micrometeorological methods. Ecology 69, 1331–1340. Baldocchi, D.D., Finnigan, J., Wilson, K.B., Paw U, K.T., Falge,
E., 2000. On measuring net ecosystem carbon exchange over tall vegetation on complex terrain. Boundary-Layer Meteorol. 96, 257–291.
Barrett, D.J., Hatton, T.J., Ash, J.E., Ball, M.C., 1996. Transpiration by trees from contrasting forest types. Aust. J. Bot. 44, 249– 263.
Bosch, J.M., Hewlett, J.D., 1982. A review of catchment experiments to determine the effect of vegetation changes on water yield and evapotranspiration. J. Hydrol. 55, 3–23. Calder, I.R., 1998. Water use by forests, limits and controls. Tree
Physiol. 18, 625–631.
Calder, I.R., Narayanswamy, M.N., Srinivasalu, N.V., Darling, W.G., Lardner, A.J., 1986. Investigation into the use of deuterium as a tracer for measuring transpiration from eucalyptus. J. Hydrol. 84, 345–351.
Cienciala, E., Lindroth, A., 1995. Gas-exchange and sap flow measurements of Salix viminalis trees in short-rotation forest. Trees 9, 295–301.
Clearwater, M.J., Meinzer, F.C., Andrade, J.L., Goldstein, G., Holbrook, N.M., 1999. Potential errors in measurement of nonuniform sap flow using heat dissipation probes. Tree Physiol. 19, 681–687.
Cuenca, R.H., Stangel, D.E., Kelly, S.F., 1997. Soil water balance in a boreal forest. J Geophys. Res. (D4) 29355–29365. Daamen, C.C., Simmonds, L.P., Wallace, J.S., Laryea, K.B.,
Sivakumar, M.V.K., 1993. Use of microlysimeters to measure evaporation from sandy soils. Agric. For. Meteorol. 65, 159– 173.
Denmead, O.T., Dunin, F.X., Wong, S.C., Greenwood, E.A.N., 1993. Measuring water use efficiency of eucalypt trees with chambers and micrometeorological techniques. J. Hydrol. 150, 649–664.
Dunin, F.X., 1991. Extrapolation of ‘point’ measurements of evaporation: some issues of scale. Vegetatio 91, 39–47. Eastham, J., Rose, C.W., Cameron, D.M., Rance, S.J., Talsma,
T., 1988. The effect of tree spacing on evaporation from an agroforestry experiment. Agric. For. Meteorol. 42, 355–368. Edwards, W.R.N., 1986. Precision weighing lysimetry for trees,
using a simplified tared-balance design. Tree Physiol. 1, 127– 144.
Granier, A., 1987. Evaluation of transpiration in a Douglass-fir stand by means of sap flow measurements. Tree Physiol. 3, 309–320.
Granier, A., Bobay, V., Gash, J.H.C., Gelpe, J., Saugier, B., Shuttleworth, W.J., 1990. Vapour flux density and transpiration rate comparisons in a stand of Maritime pine (Pinus pinaster Ait.) in Les Landes forest. Agric. For. Meteorol. 51, 309–319. Granier, A., Biron, P., Lemoine, D., 2000. Water balance, transpiration and canopy conductance in two beech stands. Agric. For. Meteorol. 100, 291–308.
Greco, S., Baldocchi, D.D., 1996. Seasonal variations of CO2 and
water vapour exchange rates over a temperate deciduous forest. Global Change Biol. 2, 183–197.
Grimmond, C.S.B., Hanson, P.J., Cropley, F., Schmid, H.P., Wullschleger, S., 2000. Evapotranspiration rates at the Morgan Monroe State Forest Ameriflux site: a comparison of results from eddy covariance turbulent flux measurements and sap flow techniques. In: 15th Conference on Hydrology, American Meteorological Society, Long Beach, CA, pp. 158–161. Hogg, E.H., Black, T.A., den Hartog, G., Neumann, H.H.,
Zimmermann, R., Hurdle, P.A., Blanken, P.D., Nesic, Z., Yang, P.C., Staebler, R.A., McDonald, K.C., Oren, R., 1997. A comparison of sap flow and eddy fluxes of water vapor from a boreal deciduous forest. J. Geophys. Res. 102, 28929–28937.
Horst, T.W., Weil, J.C., 1992. Footprint estimation for scalar flux measurements in the atmospheric boundary layer. Boundary-Layer Meteorol. 59, 279–296.
Huff, D.D., Luxmoore R.J., Begovich, C., 1977. TEHM: A terrestrial ecosystem hydrology model. ORNL/NSL/EATC-27. Oak Ridge National Laboratory, Oak Ridge, TN.
Hutchison, B.A., Matt, D.R., McMillen, R.T., Gross, L.J., Tajchman, S.J., Norman, J.M., 1986. The architecture of a deciduous forest canopy in eastern Tennessee USA. J. Ecol. 74, 635–646.
Jaeger, L., Kessler, A., 1997. Twenty years of heat and water balance climatology at the Hartheim pine forest Germany. Agric. For. Meteorol. 84, 25–36.
Johnson, D.W., Lindberg, S.E. (Eds.), 1992. Atmospheric Deposition and Nutrient Cycling in Forest Ecosystems. Springer, New York.
Johnson, D.W., Van Hook, R.I. (Eds.), 1989. Analysis of Biogeochemical Cycling Processes in Walker Branch Watershed. Springer, New York.
Joslin, J.D., Wolfe, M.H., 1998. Impacts of long-term water input manipulations on fine root production and mortality in mature hardwood forests. Plant Soil 204, 165–174.
Kalma, S.J., Thorburn, P.J., Dunn, G.M., 1998. A comparison of heat pulse and deuterium tracing techniques for estimating sap flow in Eucalyptus trees. Tree Physiol. 18, 697–705. Kelliher, F.M., Köstner, B.M.M., Hollinger, D.Y., Byers, J.N.,
Hunt, J.E., McSeveny, T.M., Meserth, R., Weir, P.L., Schulze, E.D., 1992. Evaporation, xylem sap flow, and tree transpiration in a New Zealand broad-leaved forest. Agric. For. Meteorol. 62, 53–73.
Köstner, B.M.M., Schulze, E.-D., Kelliher, F.M., Hollinger, D.Y., Byers, J.N., Hunt, J.E., McSeveny, T.M., Meserth, R., Weir, P.L., 1992. Transpiration and canopy conductance in a pristine broad-leaved forest of Nothfagus: an analysis of xylem sap flow and eddy correlation measurements. Oecologia 91, 350–359. Lee, X., Black, T.A., den Hartog, G., Newmann, H.H., Nesic,
Z., Olejnik, J., 1996. Carbon dioxide exchange and nocturnal processes over a mixed deciduous forest. Agric. For. Meteorol. 81, 13–29.
Luxmoore, R.J., 1983. Water budget of an eastern deciduous forest stand. Soil Sci. Soc. Am. J. 47, 785–791.
Luxmoore, R.J., Huff, D.D., 1989. Water. In: Johnson, D.W., Van Hook, R.I. (Eds.), Analysis of Biogeochemical Cycling Processes in Walker Branch Watershed. Springer, New York, pp. 164–196.
Luxmoore, R.J., Grizzard, T., Patterson, M.R., 1981. Hydraulic properties of Fullerton cherty silt loam. Soil Sci. Soc. Am. J. 45, 692–698.
Moore, K.E., Fitzjarrald, D.R., Sakai, R.K., Goulden, M.L., Munger, J.W., Wofsy, S.C., 1996. Season variation in radiative and turbulent exchange at a deciduous forest in central Massachusetts. J. Appl. Meteorol. 35, 122–134.
Moore, K.E., Fitzjarrald, D.R., Sakai, R.K., Freedman, J.M., 2000. Growing season water balance at a boreal Jack Pine forest. Water Resour. Res., in press.
advective effects and density fluxes. Boundary-Layer Meteorol., in press.
Phillips, N., Oren, R., Zimmermann, R., 1996. Radial patterns of xylem sap flow in non- or diffuse- and ring-porous species. Plant Cell Environ. 19, 983–990.
Priestly, C.H.B., Taylor, R.J., 1972. On the assessment of surface heat flux and evaporation using large-scale parameters. Monthly Weather Rev. 100, 81–92.
Rutter, A.J. 1968. Water consumption by forests. In: Kozlowski, T.T. (Ed.), Water Deficits and Plant Growth. Academic Press, New York, Chapter 2, pp. 23–84.
Saugier, B., Granier, A., Pontailler, J.Y., Dufrene, E., Baldocchi, D.D., 1997. Transpiration of a boreal pine forest measured by branch bag, sap flow and micrometerological methods. Tree Physiol. 17, 511–519.
Smith, D.M., Allen, S.J., 1996. Measurement of sap flow in plant stems. J. Exp. Bot. 47, 1833–1844.
Swift Jr., L.W., Cunningham, G.B., Douglass, J.E., 1988. Climate and hydrology. In: Swank, W.T., Crossley Jr., D.A. (Eds.), Forest Hydrology and Ecology at Coweeta. Springer, New York. Teskey, R.O., Sheriff, D.W., 1996. Water use by Pinus radiata
trees in a plantation. Tree Physiol. 16, 273–279.
Wilson, K.B., Baldocchi, D.D., 2000. Seasonal and interannual variability of energy fluxes over a broadleaved temperate deci-duous forest in North America. Agric. For. Meteorol. 100, 1–18.
Wilson, K.B., Meyers, T.P., 2000. The spatial variability of energy and carbon fluxes at the floor of a deciduous forest. Boundary-Layer Meteorol., in press.
Wilson, K.B., Hanson, P.J., Baldocchi, D.D., 2000a. Factors controlling evaporation and energy partitioning beneath a deciduous forest over an annual cycle. Agric. For. Meteorol. 102, 83–103.
Wilson, K.B., Baldocchi, D.D., Hanson, P.J., 2000b. Spatial and seasonal variability of photosynthetic parameters and their relationship to leaf nitrogen in a deciduous forest. Tree Physiol. 20, 565–578.
Wilson, K.B., Baldocchi, D.D., Hanson, P.J., 2000c. Quantifying stomatal and non-stomatal limitations to carbon assimilation rate as a result of leaf aging and drought in mature deciduous tree species. Tree Physiol. 20, 787–797.
Wullschleger, S.D., Meinzer, F.C., Vertessy, R.A., 1998. A review of whole-plant water use studies in trees. Tree Physiol. 18, 499–512.
Wullschleger, S.D., Hanson, P.J., Todd, D.E., 2000a. Transpiration from a multi-species deciduous forest as estimated by xylem sap flow techniques. For. Ecol. Manage., in press.