HIGH DENSITY AERIAL IMAGE MATCHING:
STATE-OF-THE-ART AND FUTURE PROSPECTS
N. Haala a *, S. Cavegn a, b
a Institute for Photogrammetry, University of Stuttgart, Germany - [email protected] b Institute of Geomatics Engineering, FHNW University of Applied Sciences and Arts Northwestern Switzerland,
Muttenz, Switzerland - [email protected]
SpS 12 - EuroSDR: Innovative technologies and methodologies for NMCAs
KEY WORDS: Matching, Surface, Three-dimensional, Point Cloud, Fusion, Triangulation
ABSTRACT:
Ongoing innovations in matching algorithms are continuously improving the quality of geometric surface representations generated automatically from aerial images. This development motivated the launch of the joint ISPRS/EuroSDR project “Benchmark on High Density Aerial Image Matching”, which aims on the evaluation of photogrammetric 3D data capture in view of the current developments in dense multi-view stereo-image matching. Originally, the test aimed on image based DSM computation from conventional aerial image flights for different landuse and image block configurations. The second phase then put an additional focus on high quality, high resolution 3D geometric data capture in complex urban areas. This includes both the extension of the test scenario to oblique aerial image flights as well as the generation of filtered point clouds as additional output of the respective multi-view reconstruction. The paper uses the preliminary outcomes of the benchmark to demonstrate the state-of-the-art in airborne image matching with a special focus of high quality geometric data capture in urban scenarios.
* Corresponding author
1. INTRODUCTION
The reconstruction of 3D surface representations from large sets of overlapping imagery has been, and still is, a vivid research topic in photogrammetry and computer vision. Driven by advances in digital airborne camera technology and algorithms, limits of automatic image based 3D data capture especially for complex scenes are still pushed regarding precision, robustness, processing speed and scale. While applications are manifold, this paper focuses on scene reconstruction from airborne imagery. Traditionally, this comprises the evaluation of nadir airborne image configurations for the reconstruction of Digital Surface Models (DSM). While such 2.5D surface representations are sufficient for applications at small or medium scale, a growing number of scenarios in complex urban environments require explicit 3D geometric information. This for example includes appropriate representations of façade elements like doors and windows as well as other vertical objects. To support the extraction of such features, façade imagery as captured from oblique camera systems or unmanned aerial vehicles (UAV) is increasingly used. Additionally, the respective matching pipelines for dense surface reconstruction have to be extended to true 3D processing, including the generation of output like 3D point clouds or meshes.
Within this paper, we discuss the potential of such pipelines and the state-of-the-art in photogrammetric 3D data capture on examples from the project “Benchmark on High Density Aerial Image Matching”. The basic scope of this joint ISPRS/EuroSDR initiative is the evaluation of 3D point clouds and DSM produced from aerial images with different software tools. Originally, the benchmark was limited to two image blocks captured with standard photogrammetric camera
systems. Section 2 briefly summarizes the evaluation based on results from this imagery provided by different software systems. Such multi-view matching pipelines for the evaluation of airborne nadir imagery usually generate DSM rasters at a grid size corresponding to the average pixel footprint. While such 2.5D models are suitable for a number of applications, data collection based on oblique airborne imagery has developed to an important alternative source of information especially in complex urban environments. This motivated the extension of the benchmark to an additional test scenario aiming at the evaluation of dense 3D point clouds from such imagery especially of building objects. Section 3 presents and discusses these results as the main contribution of this paper, while the concluding remarks in section 4 briefly summarizes the current state-of-the-art and future prospects in high density aerial image matching.
2. DSM FROM AIRBORNE NADIR IMAGERY
Important factors influencing the quality of DSM from dense airborne image matching are surface texture and image overlap. This motivated the provision of two data sets with different landuse and block geometry for the first phase of the benchmark. The data set Vaihingen/Enz was selected as an example for data usually collected during state-wide DSM generation at areas with varying landuse. It covers a semi-rural area of undulating terrain with elevation differences of 200m. The aerial images were collected at height above ground of 2900m and a ground sampling distance (GSD) of 20cm. The sub-block selected for the benchmark consists of three strips with 12 images each. The available overlap of 63% in flight and 62% cross flight results in variations of four to nine images per object point. Test participants had to generate a DSM at a size The International Archives of the Photogrammetry, Remote Sensing and Spatial Information Sciences, Volume XLI-B4, 2016
of 7.5km x 3.0km at a grid width of 0.2m, corresponding to the GSD of the imagery. The second test data set München is more typical for data collection in densely built-up urban areas. Since this presumes images at a higher overlap and resolution, the image sub-block to be processed consists of 3 image strips with 5 images each, captured with 80% in flight and 80% cross flight overlap. This results in a considerable redundancy of up to fifteen-folded object points. However, the available high buildings result in occlusions especially for surface parts close to the façades. Thus, visibility can be limited for such regions, which will potentially aggravate the matching processes during DSM generation. The area to be processed has a size of 1.5 x 1.7km in the central part of the city of München. The DSM had to be generated at a grid width of 10cm, again corresponding to the GSD of the image block.
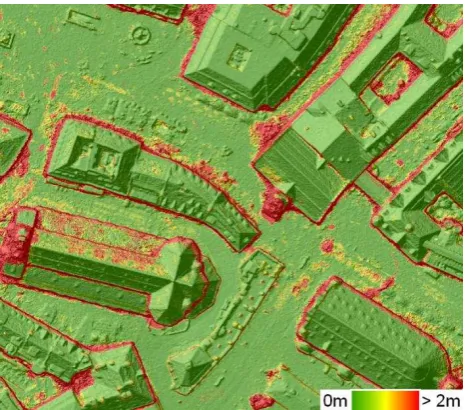
For a quality assessment of the generated DSM, the comparison to ground truth from independent measurements is most suitable. During the benchmark, a median DSM was generated alternatively from the different results as provided from the participants. Of course, this median DSM does not give independent ground truth at higher order accuracy. Still, since generated from more than 10 available software solutions, it is very useful to illustrate differences between the respective results. Figure 1 depicts the shaded relief of this reference DSM for a small section of the test area. Additionally overlaid is a colour-coded representation of the RMS values from all DSM solutions with respect to this median. Our accuracy investigations for the first test phase presented in more detail in (Haala, 2014) clearly show that a growing number of software tools allowing for detailed, reliable and accurate image based DSM generation are available. To eliminate erroneous matches reliably, processing especially takes advantage from large image overlaps.
Figure 1. Shaded DSM for test area München with RMS differences for all solutions overlaid
State-of-the-art stereo image matching algorithms provide a considerable reliability of DSM at vertical accuracies close to the sub-pixel level. The results of the nadir image benchmark additionally show acceptable run-times even if a standard hardware environment is used. Data sets like the provided benchmarks can be processed without problems. As it is exemplarily visible in Figure 1, some solutions showed decreasing accuracies at cast shadows. Differences between the respective results also increased at fine object structures close to
the resolution of the available images. Typically, the amount of captured 3D structure is limited if nadir views from standard aerial image flights are used. In such scenarios, the restricted look angles result in rather sparse reconstructions of 3D façade geometry.
The data set München features imagery captured by the DMC II 230 camera, which features a Field of View (FoV) of 49.9° cross track and 47.3° along track. If imagery from such a wide angle camera is available at a sufficient overlap (e.g. 80%/80% for this example) even standard nadir configurations can provide façade texture at resolution sufficient for a number of applications. As an example, the pipeline described by Haala and Rothermel (2015) follows an approach proposed by Waechter et al. (2014) to pick an adequate, consistent texture for such purposes.
Figure 2. Texture mapped triangulated DSM raster showing vertices (top) and faces (bottom)
As it is visible in Figure 2, such an approach already provides rather appealing results for visualisation by mapping aerial image texture against the available 2.5D DSM data. Since visualization pipelines use triangle meshes, these primitives have to be extracted from the reconstructed DSM raster as a first processing step. For this purpose, multi-resolution triangulations have been available in computer graphics for decades (Lindstrom et al., 1996). Since computational complexity of both, visualization and texture mapping directly depend on the number of triangles, it is desirable to construct meshes which solely consider elevation data contributing to the actual geometry and neglect data possessing elevation variances close to the noise level (Rothermel et al., 2014). While the top of Figure 2 depicts the wireframe of the model to visualize the structure of the generated meshes, the bottom image shows the respective triangles filled with their corresponding texture as provided from the aerial images.
3. DENSE IMAGE MATCHING IN COMPLEX BUILT-UP ENVIRONMENTS
While the nadir data sets presented in the previous section aim at the evaluation of software systems for DSM generation, an additional test scenario was set up to investigate the potential of The International Archives of the Photogrammetry, Remote Sensing and Spatial Information Sciences, Volume XLI-B4, 2016
high density image matching for oblique airborne imagery. This was motivated by the increasing use of oblique imagery for photogrammetric purposes (Rupnik et.al., 2015). Since oblique images depict building façades, they are easy to interpret for non-expert users also. Thus, they are frequently integrated for visualization in global map services such as Google Maps. Furthermore, they can be used for 2.5D or 3D information extraction in applications like monitoring, urban area classification or administration services. In principle, oblique images are also very suitable for image matching while aiming at the generation of dense 3D point clouds in the context of 3D city modelling. However, applying DIM algorithms to oblique imagery introduces some major new challenges to the processing pipeline. In addition to greater illumination changes, these include multiple occlusions as well as large scale variations due to a higher depth of field.
3.1 Benchmark data from oblique aerial imagery
The test data provided for the aerial oblique benchmark consists of two image blocks. The first block was acquired over the city of Zürich with the medium format camera Leica RCD30 Oblique Penta. The camera features a maltese cross configuration with one nadir and four oblique cameras. Nadir imagery is captured with a GSD of 6cm and an approximate overlap of 70% in flight and 50% across flight direction. The imagery of the four oblique views mounted at a tilt angle of 35° has a GSD of 6-13cm. Cavegn et al. (2014) present the test scenario and give preliminary results for this data set. Our paper discusses the evaluation of the second oblique data set collected for a part of the city of Dortmund. This data set was provided from the ISPRS Scientific Initiative on "Multi-platform Very High Resolution Photogrammetry" (Nex et al., 2015). It consists of images taken by AeroWest with the PentaCam IGI system. Similar to the Leica RCD30 Oblique Penta, the PentaCam IGI features a maltese cross configuration, but the tilt angle of its oblique views is 45°.
Figure 3. Exemplary image for test area Museum Zeche Zollern
The image subset for the DIM benchmark covers the Museum Zeche Zollern area close to the city of Dortmund. This area is also visible in the exemplary oblique image from the benchmark block depicted in Figure 3. The GSD is 10cm in the nadir images and varies from 8 to 12cm in the oblique views. Rather high overlap is available since it is 75/80% in along/across-track direction for the nadir views and 80/80% for the oblique images. While the complete image block consists of 881 images, a subset of 82 images was selected after bundle block adjustment for the dense image matching benchmark. For these
images lens distortion was eliminated by image rectification. Participants were asked to use the given orientation parameters without modification. All information concerning the Benchmark for Multi-Platform Photogrammetry and the Benchmark on High Density Aerial Image Matching, including a description and a link to the data is available on the websites
http://www2.isprs.org/commissions/comm1/icwg15b/benchmar k_main.html
and
http://www2.isprs.org/commissions/comm1/wg2/benchmark.ht ml.
3.2 Additional scenario from terrestrial and UAV imagery
As a further scenario for the dense matching benchmark, an image block captured by a rotary wing UAV platform and terrestrial views is additionally available. The UAV was equipped with a Sony Nex 7 camera, while the ground imagery was collected by a Canon D600 SLR camera.
Figure 4. Image configuration for combined terrestrial and UAV block
Figure 4 shows the block configuration for these 228 images. As is visible, data capture is limited to a single building of the Zeche Zollern area, the administration building (“Verwaltung”). With an average GSD of 5mm, the image resolution of the terrestrial and UAV imagery is comparably high and potentially provides a lot of detail. The terrestrial and UAV images show large differences in viewing directions, which potentially aggravates matching. However, a high overlap is available, which results in a high redundancy during matching.
3.3 Evaluation procedure
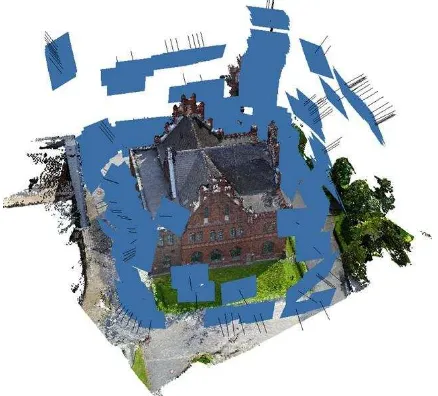
Participants of the test have to provide point clouds from their respective matching tools for evaluation. For this purpose, several high quality terrestrial laser scans were performed using a Z+F 5010C laser scanner in the test area. Figure 5 shows the TLS point cloud for the building “Verwaltung”. As it is visible, the available amount of detail is not only sufficient to evaluate the results from the oblique aerial images to be generated at a point distance of 10cm, but can also be used for the high resolution results from the UAV and terrestrial imagery, which are close to the sub-centimeter level. Similar TLS data sets are available for two additional buildings.
Figure 5. Point cloud from TLS for building “Verwaltung” with overlaid façade patches and profiles
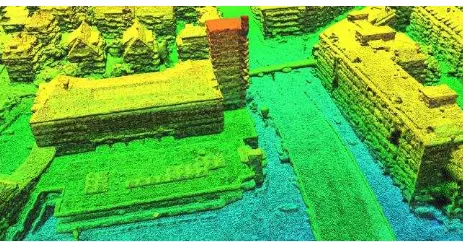
Figure 6. Coloured point cloud from software PhotoScan with overlaid TLS point cloud “Lohnhalle” in grey
Figure 6 shows the TLS reference point cloud for the building “Lohnhalle” in grey and additionally visualises a DIM point cloud for a part of the test area. For better discrimination, this point cloud as provided from the company AgiSoft by their software system PhotoScan is coloured using image texture from available oblique imagery. Figure 7 gives another example for a point cloud delivered from a benchmark participant. This result from the software system SURE processed by the company nFrames also shows some parts of the test area, which includes rather complex 3D structure like the shaft tower.
Figure 7. Exemplary point cloud generated with software SURE
For evaluation of the DIM point clouds provided by the participants, the approach already described in Cavegn et al. (2014) was used. In a first step, a simple surface representation is generated from the reference measures by TLS for patches at
building facades. These patches are already visualised for the TLS reference measures given in Figure 5.
Patch size
[m2]
Density [Points / m2]
RMSE DIM-TLS
[mm]
Mean DIM-TLS
[mm]
Fac.1 S 139 31 138 -6
Fac.1 PS 139 40 169 -84
Fac.2 S 102 29 100 -16
Fac.2 PS 102 40 145 -103
Fac.3 S 126 19 81 -16
Fac.3 PS 126 33 142 -46
Fac.4 S 101 28 94 -3
Fac.4 PS 101 39 112 29
Mean S 117 27 103 -10
Mean PS 117 38 142 -51
Table 1. Density and deviation values for all administration building facades using SURE (S) and PhotoScan (PS)
As is visible in Table 1, certain features like mean density of computed points as well as a mean difference or RMSE with respect to the TLS reference can be computed easily. However, the conclusiveness of these numbers is rather limited. In contrast, the point-to-point differences between the façade surfaces from DIM and the reference surface from TLS is much more useful. Still, this would presume a suitable surface representation e.g. by a meshed 3D point cloud. To simplify data processing and thus to increase the number of potential test participants, we requested raw 3D points as the final deliverable. For evaluation of these point clouds during the benchmark, we used a simple gridding process for surface computation at building facades, which is almost identical to standard DSM rasters as discussed in section 2. A DSM provides rasterized elevations, which refer to a horizontal plane. Similarly, we compute a raster, which refers to a plane defined by a patch of a building facade as e.g. depicted in Figure 5.
[m]
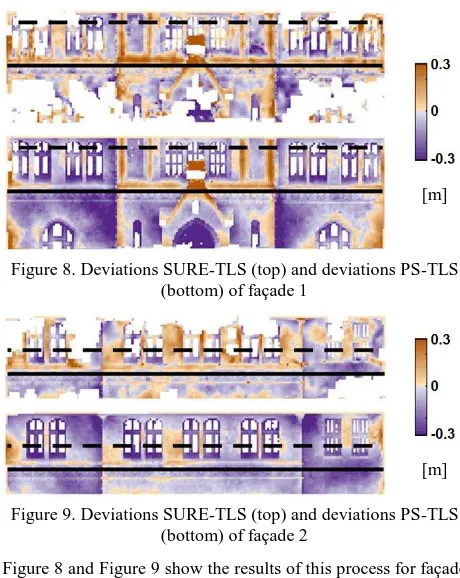
Figure 8. Deviations SURE-TLS (top) and deviations PS-TLS (bottom) of façade 1
[m]
Figure 9. Deviations SURE-TLS (top) and deviations PS-TLS (bottom) of façade 2
Figure 8 and Figure 9 show the results of this process for façade 1 and façade 2, which are highlighted in the TLS reference point cloud depicted in Figure 5. To generate raster surfaces The International Archives of the Photogrammetry, Remote Sensing and Spatial Information Sciences, Volume XLI-B4, 2016
from the TLS point cloud for these patches, we selected a grid width of 10cm, which corresponds to the average GSD of the available oblique aerial imagery. Similarly, our gridding process generated raster representations from the point clouds provided by the participants. By these means, differences between the respective surfaces can be computed very easily. As an example, the top of Figure 8 and Figure 9 shows the differences of a surface generated from a point cloud by the software SURE to the reference surface from TLS. For the images on the bottom, we subtracted this reference from results by the software PhotoScan.
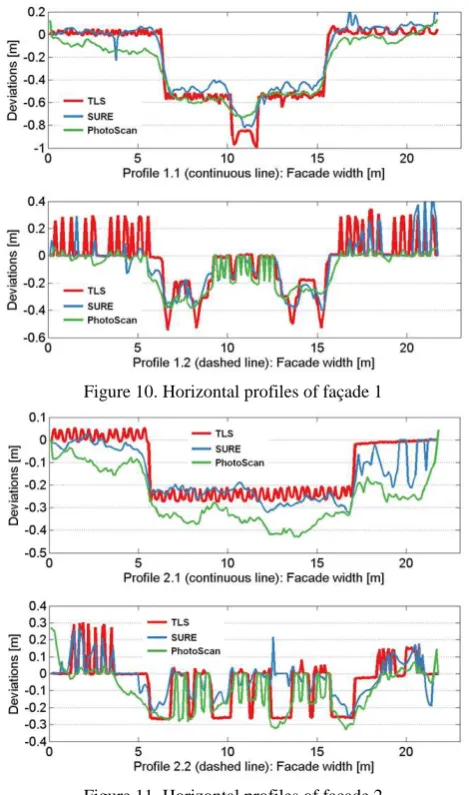
Figure 10. Horizontal profiles of façade 1
Figure 11. Horizontal profiles of façade 2
As is visible, these differences of the respective data from SURE and PhotoScan to the TLS reference in Figure 8 and Figure 9 were color-coded in an interval of ±0.3m. This already gives a first impression on the available amount of detail in the DIM results. Figure 10 and Figure 11 show some profiles extracted from the surfaces provided by TLS and DIM using SURE and PhotoScan, respectively, in order to give a better visualisation of numerical values. These profile lines are also shown in Figure 5. Due to the limited resolution of the oblique aerial imagery of 10cm, not all of the fine details could be reconstructed. However, the general shape of the building facades is given.
An increased amount of detail is of course available from the dataset described in section 3.2, which consists of the terrestrial and UAV imagery. Since these images provide a much higher
resolution, a DSM raster width of 2cm was selected for gridding, which is around four times larger than the mean GSD of the captured images. Furthermore, the respective differences were color-coded in an interval of ±5cm.
Figure 12. DIM from terrestrial and UAV imagery: Deviations DIM-TLS of façade 1
Figure 13. DIM from terrestrial and UAV imagery: Horizontal profiles of façade 1
Figure 12 and Figure 13 were generated from results provided by the DLR Institute of Robotics and Mechatronics. The amount of detail within the reconstructed surface geometry from the UAV and terrestrial image data set is much higher than for the results from oblique aerial imagery in Figure 8 to Figure 11. Apparently, the evaluation of the UAV and terrestrial image data set benefits from the high image resolution and the large overlap, which is available for this block. In such scenarios, the results from DIM are almost comparable to the quality of the TLS data.
4. CONCLUSIONS
Dense multi-view stereo in principle generates one 3D point for each pixel of an image block configuration. This results in considerable point densities also for standard airborne imagery. During DSM generation, these dense 3D point clouds can e.g. be fused by a simple gridding process, which computes the final height value of each grid cell as the median of the z-components of the points assigned to each single cell. This intuitively applies filtering of the points in a direction normal to the observed surface. Algorithms based on an optimization of these criteria are easy to implement for airborne nadir configurations. However, robust filtering of reconstructed 3D points can become rather complex for oblique scenarios. In contrast to nadir views with both homogenous look direction and resolution, such configurations are much more challenging. Now geometric processing is required in true 3D space, which is far from trivial. As an example Rothermel et al. (2016) present filtering and fusion of oriented point sets, which are very well suited for generation of meshed surfaces by standard Poisson surface reconstruction (Kazhdan & Hoppe, 2013). An The International Archives of the Photogrammetry, Remote Sensing and Spatial Information Sciences, Volume XLI-B4, 2016
example of this approach for the benchmark data set in the area of Zürich is given in Figure 14.
Figure 14. 3D meshes from multi-stereo matching of oblique aerial images
Within this paper, we presented the current state of 3D data capture in urban areas by dense multi-view-stereo for different scenarios and camera configurations based on results from the ISPRS/EuroSDR project “Benchmark on High Density Aerial Image Matching”. Meanwhile, a number of commercial software solutions can generate DSM raster grids at the resolution of the captured imagery from standard airborne nadir imagery. While such 2.5D raster representations are sufficient for a number of applications, data capture in urban environments presumes 3D object representations. Within our benchmark aiming at the evaluation of oblique aerial imagery, these representations are provided from 3D point clouds. Despite the challenges for the matching process, the preliminary results as provided from the participants already provide a remarkable quality of the delivered 3D point clouds. The results clearly show the potential of recent matching software to derive point clouds at an accuracy and resolution corresponding to the ground sampling distance (GSD) of the original images also for rather complex urban environments.
5. ACKNOWLEDGEMENTS
We acknowledge the work of Franceso Nex and Markus Gerke for providing the data sets used in this paper during the Benchmark for Multi-Platform Photogrammetry. Special thanks are due to Jens Kremer, IGI, Mathias Rothermel, nFrames, Martin Drauschke, DLR Institute of Robotics and Mechatronics, and Alexey Pasumansky, AgiSoft, for contributing their data and expertise.
6. REFERENCES
Cavegn, S., Haala, N., Nebiker, S., Rothermel, M. & Tutzauer, P., 2014. Benchmarking High Density Image Matching for Oblique Airborne Imagery. In: Int. Arch. Photogramm. Remote Sens. Spatial Inf. Sci., Zurich, Switzerland, Vol. XL-3, pp. 45-52.
Haala, N., 2014. Dense Image Matching Final Report. EuroSDR Publication Series, Official Publication No. 64, pp. 115-145.
Haala, N. & Rothermel, M., 2015. Image-based 3D Data Capture in Urban Scenarios. In: D. Fritsch (Ed.), Photogrammetric Week ’15. Wichmann, Berlin/Offenbach, pp. 119-130.
Kazhdan, M. & Hoppe, H., 2013. Screened Poisson Surface Reconstruction. ACM Transactions on Graphics (TOG), 32(3), pp. 29:1-13.
Lindstrom, P., Koller, D., Ribarsky, W., Hodges, L., Faust, N. & Turner, G., 1996. Real-time, Continuous Level of Detail Rendering of Height Fields. In: Proceedings of the 23rd annual conference on Computer graphics and intera ctive techniques (SIGGRAPH '96), pp. 109-118.
Nex, F., Gerke, M., Remondino, F., Przybilla, H.-J., Bäumker, M. & Zurhorst, A., 2015. ISPRS Benchmark for Multi-Platform Photogrammetry. In: ISPRS Ann. Photogramm. Remote Sens. Spatial Inf. Sci., Munich, Germany, Vol. II-3/W4, pp. 135-142.
Rothermel, M., Haala, N. & Fritsch, D., 2016. A Median-Based Depthmap Fusion Strategy for the Generation of Oriented Points. To be published in ISPRS Annals, XXIII ISPRS Congress, Commission III.
Rupnik, E., Nex, F., Toschi, I. & Remondino, F., 2015. Aerial multi-camera systems: Accuracy and block triangulation issues. ISPRS Journal of Photogrammetry and Remote Sensing, Vol. 101, pp. 233-246.
Waechter, M., Moehrle, N. & Goesele, M., 2014. Let There Be Color! Large-Scale Texturing of 3D Reconstructions. ECCV 2014, Lecture Notes in Computer Science, Vol. 8693, pp. 836-850.