MOSAICKING MEXICO - THE BIG PICTURE OF BIG DATA
F. Hruby a, *, S. Melamed b, R. Ressl a, D. Stanley b a
National Commission for Knowledge and Use of Biodiversity (CONABIO), 14010 Mexico City, Mexico - (florian.hruby, rainer.ressl)@conabio.gob.mx
b
PCI Geomatics, Markham, Ontario, L3R 6H3, Canada – (melamed, Stanley)@pcigeomatics.com
Commission II, WG II/6
KEY WORDS: Mosaicking, Geovisualization, Color Balancing, Satellite Imagery, Big Data
ABSTRACT:
The project presented in this article is to create a completely seamless and cloud-free mosaic of Mexico at a resolution of 5m, using approximately 4,500 RapidEye images. To complete this project in a timely manner and with limited operators, a number of processing architectures were required to handle a data volume of 12 terabytes. This paper will discuss the different operations realized to complete this project, which include, preprocessing, mosaic generation and post mosaic editing. Prior to mosaic generation, it was necessary to filter the 50,000 RapidEye images captured over Mexico between 2011 and 2014 to identify the top candidate images, based on season and cloud cover. Upon selecting the top candidate images, PCI Geomatics’ GXL system was used to reproject, color balance and generate seamlines for the output 1TB+ mosaic. This paper will also discuss innovative techniques used by the GXL for color balancing large volumes of imagery with substantial radiometric differences. Furthermore , post-mosaicking steps, such as, exposure correction, cloud and cloud shadow elimination will be presented.
* Corresponding author
1. INTRODUCTION
1.1 Background
During the last 50 years, spatial resolution of imaging sensors has been increasing constantly and significantly (Fugate et al., 2010). However, as spatial resolution of a scene is inversely proportional to its spatial extension, ever smaller areas are being captured at even higher level of detail so that “the region of interest (ROI) often cannot be included in a single image” (Li et al., 2015). Consequently, merging remote sensing images into a single homogeneous composite has become an increasingly important task, often referred to as “mosaicking” in recent literature (cf. Li et al., 2016; Yu et al., 2012; Wan et al., 2013).
The reasons making mosaicking a complex process are manifold (cf. Kerschner, 2001). In a nutshell, short-term factors like atmospheric (e.g. clouds), illumination and camera angles differences can be distinguished from long-term changes of vegetation and human infrastructure (cf. Helmer & Ruefenacht, 2005). To adjust differing characteristics of neighbouring scenes resulting from these factors, usually a three-part approach is proposed comprising color balancing, seamline optimization and image blending. While several methods on each of these three issues have been presented so far (cf. Li et al., 2015), a closer look into relevant literature (including the texts quoted so far) reveals that usually just a few scenes are being used for methodological testing. Studies on larger mosaics including several hundred of scenes are still rare (e.g. Bielske et al., 2007).
As we shall argue below, these three basic mosaicking tasks may fall short to define an operational design for large area mosaics for the following reasons: (1) To map large areas with
high resolution imagery, hundreds of scenes may be necessary. This number will increase significantly, when coverages of several seasons are taken into consideration. Defining a best-of set from such an amount of data is a task, which cannot be done manually/visually in a timely manner. (2) Mosaicking a big data set not only requires adaptions between adjacent scenes. Rather, local statistics need to be combined with global statistics to obtain acceptable results. (3) Depending on climatic and land cover diversity of the area to be mapped, different measures of post-processing (e.g. exposure correction, cloud replacement) are necessary.
This being said, the present paper argues the necessity of extending the three-part approach presented e.g. by Li et al. (2015) by methods of pre-selection and post-editing in order to compile a functional workflow for big data mosaicking. The resulting five-step design has been tried and tested on a completely seamless and cloud-free mosaic of Mexico and will be used to structure the rest of this article.
1.2 Study Area & Data
Main goal of the project behind this paper was to create a completely seamless and cloud-free mosaic of Mexico at a resolution of 5m, using RapidEye ortho-imagery. Given that Mexico is the world’s 13th
largest country with a continental territory of almost 2,000,000 km2, ca. 4,000 complete RapidEye scenes (each covering 25 km2) are necessary to map the country.
Moreover, Mexico is among the five biologically richest countries (cf. Mas et al., 2004), characterized by a large diversity of land cover classes (cf. Di Grigorio, 2005; Llamas et al., 2015; Colditz et al.; 2014). This diversity results in images having different radiometric profiles, ranging from very bright The International Archives of the Photogrammetry, Remote Sensing and Spatial Information Sciences, Volume XLI-B2, 2016
desert regions to dark dense vegetation with varying degrees of atmospheric contaminants (cloud and haze), most notably in the south-eastern regions of the country.
1.3 Technical Setup
Given that the amount of input imagery exceeded 12 terabytes (cf. chapter 2.1), a cluster-based processing approach was chosen. Two servers with the following parameters were used: Dell R720 with 2 Intel XEON processors, 10 cores a 2.5 GHz, 128 GB RAM; CentOS 6.5, Linux 2.6.32-431.
PCI’s GXL technology, which distributes processing among all available servers, was installed on the cluster to perform the automatic mosaicking operations (cf. section 2.2 – 2.4). Local enhancements were performed on a dynamic preview mosaic (prototype mosaic) using PCI Geomatica software, (cf. chapter 3).
2. MOSAICKING
2.1 Data Filtering
In total, seven complete RapidEye coverages of Mexico were acquired between 2011 and 2014; four in the dry season and three in the wet season (minus 2013). To maximize the quality of the automated mosaic processing, it was necessary to limit the input images to those with similar seasonal radiometry and minimal cloud cover, while maintaining a complete coverage. Two steps were performed to identify the best candidate images. First, bulk-removal of all scenes captured during the wet-season and second, identify the best images from the remaining batch for each tile location.
It was decided to first remove all images captured during the wet-season (May-September) for all available years, due to the higher probability of cloud formation during this time. The bulk-removal process reduced the number of input images from approx. 50,000 to 24,500, retaining the images with the lowest probability of cloud cover. The remaining 24,500 images were further filtered using an automated workflow developed in python. The automated workflow identified the scene(s) with the lowest percentage of cloud cover for each tile location, image is available). On the other hand, at least two scenes are necessary for all tiles imaged just incompletely (i.e. bit 0 in the unusable data mask file provided for each RapidEye image).
2.2 Color Balancing
Even neighboring images captured on the same day usually show enough radiometric difference to cause patchwork effects within a mosaic. Hence, histograms of individual scenes need to be adjusted by methods of color balancing in order to obtain a homogeneous composite. This task becomes particularly challenging when being performed at a country-scale, at high resolution (5m) and with diverse land cover.
Basic color balancing methods are (1) mean variance matching (MVM), (2) least square matching (LSM), (3) moment matching (MM) and (4) histogram matching (HM); (Li et al., 2015). While methods (1) - (3) balance colors calculating gain (contrast) and bias (brightness) values for each image, integrate large and heterogeneous data sets into balanced composites, providing rather uneven and patched results (cf. Li et al., 2015).
In view of the drawbacks mentioned, and given the large amount of data to be processed for a country wide mosaic of Mexico, we opted for an alternative, bundled approach comprising of the following two steps: Firstly, the gain and bias for each scene is adjusted using a technique similar to the histogram matching (HM) method, but without altering the mean and sigma values of the global histogram (all images). This improves the homogeneity of the mosaic, while maintaining the natural appearance of the colors in the images. A water mask was applied to exclude inland and coastal waters due to their very specific radiometric characteristics.
Secondly, the remaining differences between neighboring images are adjusted with automatic “dodging” (cf. section 3.1), which performs another adjustment to the pixels along each seamline. New gain and bias values are calculated for each unique seamline, which more aggressively attempts to establish local homogeneity between the two images that are cut by each seamline. The additional color balancing along each seamline are then faded into the rest of the image using a negative radial gradient. Hence, approaching color balancing of country-scale mosaics in two stages; initial global balancing, followed by more aggressive local balancing along seamlines, allows for a more homogenous mosaic, while better preserving the natural color of the original images (Figure 4).
2.3 Seamline Optimization
Tonal adjustment alone might be insufficient to visually disappear individual scenes within a mosaic, especially when adjacent images were captured on different days or at different times of the year. However, the results achieved through color balancing can be optimized by adapting the originally straight border of each image to the line of maximum similarity within the overlapping region of two neighbouring scenes (Kerschner, 2001). According to Li et al. (2015), this process of seamline optimization is the most important part of any mosaicking process, discussed in detail in current remote sensing literature (cf. Yu et al., 2012; Mills & McLeod, 2013; Li et al., 2016).
Basic methods of seamline detection processing only pixel-based information, e.g. on color or texture (cf. Kerschner, 2001; Bielske et al., 2007), can be distinguished from more advanced approaches that also consider semantic aspects (Yu et al., 2012). The latter option not only prevents seamlines from crossing objects like buildings or fields (cf. Saito et al., 2015), but also adjusts them to linear features like roads and rails (Wan et al., 2013).
Given the technical framework chosen for this project we opted for a pixel-based approach, which automatically defined optimal seamlines based on the minimum-squared-differences of gray values for all image channels. The results obtained from this step were improved manually where necessary. These modifications proved useful especially in the tropical regions in South-southeastern Mexico.
2.4 Image Blending
To further improve the results obtained from seamline optimization, image blending was done to provide for a smoother transition between images. Main blending (or feathering) techniques described in Li et al. (2015) share the common characteristics, that radiometric pixel values within a buffer along the seamline might be altered to produce a graduated cross fade (Yu et al., 2011). If this overlapping region does not match perfectly, ghosting effects due to perspective distortion will occur, especially in urban areas (Lloyd & Egbert, 2002).
3. POST-PROCESSING
The preceding chapter defined both the scenes to be included in the mosaic and the methods of stitching them together to obtain a single image file, hence describing the process of mosaicking in a narrower sense. However, the resulting mosaic can be significantly improved by the following steps of post-processing, which – for necessity or practical reasons – build on the prototype resulting from the procedure documented in chapter 2.
3.1 Manual Dodging
The two-step bundled color balancing approach we applied (cf. section 2.2), uses dodging to optimize the homogenization between neighboring scenes by creating one dodging line (represented by one dodging point; cf. also figure 1) between two overlapping images.
Figure 1. Detail of Lake Chapala, before (above) and after (below) manual dodging; dodging points as white circles
Each dodging point is connected to the seamlines between images (cf. section 2.3). Basically it is a focal point where adjustments regarding contrast and brightness can be made – either modifying both or just one of the two scenes in question. Using Geomatica’s semi-automatic dodging point tools, these modifications can be applied to the default dodging points or additional dodging points added where unbalanced image transition remains visible, as typical e.g. for inland waters (cf. figure 1).
3.2 Image Enhancement (Synthetic Exposure Correction)
Performing visual enhancements to imagery is a key operation during the mosaicking process, in order to improve the visual aesthetics of the mosaic. A number of standard enhancement functions can be applied to the original digital numbers (DN) of the pixels in the imagery to quickly improve contrast and brightness. Two very popular enhancement functions include the linear function and the equalization function. The linear function uniformly stretches the minimum and maximum values in the image over the entire extent of the display range (usually 0-255). The equalization function distributes the values equally over the entire output display range, resulting in a nearly uniform distribution. Both of these functions, as well as other custom functions often result in bright areas becoming over-exposed in the output enhanced image space. In practical terms, brighter features lose details after the enhancement, because the enhancement function being applied stretches and then truncates the upper-end of the original histogram to 255.
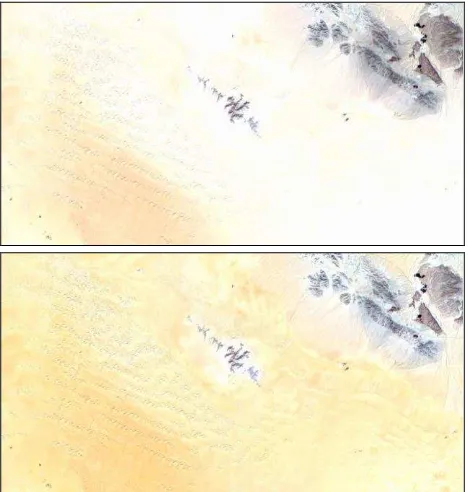
Figure 2. Detail of the Laguna Salada, a dry lake in the Sonoran Desert, before (above) and after (below) desaturation
The exposure correction algorithm automatically scans the mosaic for large groups of pixels with high values relative to the remaining pixels in the mosaic. The algorithm then proceeds to decrease the DN values for the group of bright pixels, this ensures that detail is retained when applying a histogram enhancement. Furthermore, a gradient along the edges of the group is applied to ensure a smooth transition from the unaltered pixels to the altered group of pixels. The International Archives of the Photogrammetry, Remote Sensing and Spatial Information Sciences, Volume XLI-B2, 2016
3.3 Cloud Stamping
Although the automatic image selection method mentioned in section 2.1 provided the least cloudy scene for each tile ID in accordance with the meta-data provided, clouds still remained in the prototype mosaic for two reasons: Firstly, despite the availability of multiple coverages, there are (particularly tropical) regions where no cloud-free image was captured algorithm with multiple scenes from the same tile and then cut out cloudy regions through manual seamline modification. However, this option would not only have been time consuming, but would have also degraded the color balancing result, since more scenes for a given tile ID will include more tonal variability.
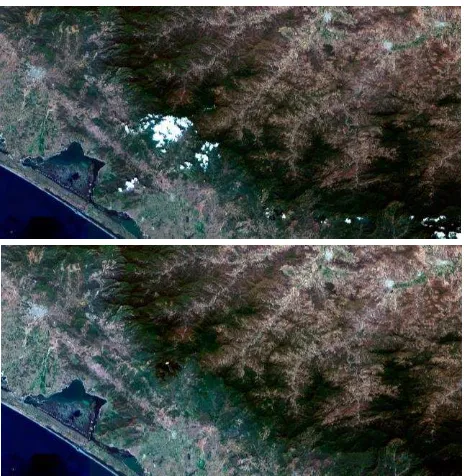
In view of this problem of erroneously introduced or permanent cloud coverage, we took advantage of the smart geofill tool, a feature of PCI´s Geomatica software, which allows to copy and paste image details between different scenes. In the present case, we used the tool to manually select a given cloud and its shadow in the mosaic, search through the remaining scenes for an appropriate image, where the affected area is free of clouds, copied this cloud-free area and pasted it over the prototype. This copy-paste routine was done with flexible settings for color balancing and blending (cf. section 2.2 and 2.4). Hence, the resulting procedure can also be understood as a micro-mosaicking process at a tile level, where partial information taken from several scenes produce one completely cloud-free image. As shown in figure 3, a systematic application of the smart geofill tool allowed us to improve the prototype version significantly, resulting in a virtually cloud-free mosaic (the interested reader is referred to the accordant scene in Google Maps to better understand the challenge of cloud-free mosaicking in tropical regions: https://goo.gl/8wuVwp).
Figure 3. Mosaic prototype (above) vs. cloud stamped version (below); detail from the state of Chiapas
4. FUTURE ISSUES & APPLICATIONS
4.1 Future Tasks
Figure 4 shows the results obtained from mosaicking and post-processing. Despite the reduced scale of this figure, the reader might notice that the mosaic is both cloud-free and seamless within the continental territory of Mexico. However, the reader might notice as well that the homogeneity achieved by land is contrasting with a considerable heterogeneity by sea, where individual tiles can still be distinguished along the coast. A feasible solution for this issue would be to clip the mosaic with a coastline vector to cut off all patchworked coastal waters. In practise such approach proves to be demanding, since coastlines, especially when shown at high resolution, are both dynamic and fuzzy features.
To avoid the problem of defining a sharp coastline vector, but also improve the mosaic´s aesthetics (without losing information on coastal dynamics), we opted to include not only the coastal waters shown in figure 4, but rather integrate also offshore regions in the Gulf of Mexico and Pacific areas to fill up all regions currently shown in black (cf. fig. 4) with Landsat 8 imagery. To enrich these rather monotone (in terms of RGB information) marine areas, blending with bathymetric data is planned. This marine mosaicking part of the project has not been completed yet.
4.2 Applications
The application spectrum of a cloud-free, nation-wide satellite mosaic is manifold. Firstly, the mosaic will be used as a reference base map in CONABIO´s geoportal complementing existing Web Map Services (WMS), e.g. services provided by Google. In the scale up to approximately 1:20,000 this will show significant quality enhancement in comparison to geobrowsers like Google Earth.
Secondly, the mosaic shows a high potential for deriving a nationwide chip database, which could be used as reference points for automated image co-registration. Mexico has a huge national image archive of historical SPOT-5 data, which sometimes show large displacements (up to 200m), especially in mountainous regions due to limited georreferencing accuracy. These datasets could be georreferenced in an automated manner recovering thousands of scenes with low geospatial accuracy.
Thirdly, the mosaic will provide cloud-free reference information for many users for future change detection applications with both regional and local focus, especially for a general audience with limited remote sensing skills applying old-fashioned visual image interpretation.
Finally, the mosaic will serve as an educational and esthetical product. The former, as we will produce thematic maps for public schools together with the Mexican ministry of education, again using the mosaic as homogeneous baseline reference information for all states of the country. Additionally CONABIO will use the data for 3D and 4D visualization purposes applying the mosaic as high resolution texture information within animations. Main goal is to make satellite remote sensing information more accessible and understandable for the general public.
ACKNOWLEDGEMENTS
This project was co-funded by the National Council of Science and Technology (CONACYT) and the Mexican Space Agency (AEM) within the “Fondo Sectorial de Investigación, Desarrollo Tecnológico e Innovación en Actividades Espaciales, CONACYT-AEM”; Project No. 262997.
REFERENCES
Braaten, J. D., Cohen, W. B., & Yang, Z., 2015. Automated cloud and cloud shadow identification in Landsat MSS imagery for temperate ecosystems. Remote Sensing of Environment, 169, pp. 128-138.
Lloyd, B., & Egbert, P., 2002. Histogram Painting for Better Photomosaics. Computer Graphics and Imaging, pp. 174-179.
Colditz, R. R., Pouliot, D., Llamas, R. M., Homer, C., Latifovic, R., Ressl, R. A., Meneses Tovar, C., Victoria Hernandez, A. & Richardson, K., 2014. Detection of North American Land Cover Change between 2005 and 2010 with 250m MODIS Data. Photogrammetric Engineering and Remote Sensing, 80(10), pp. 918-924.
Di Gregorio, A., 2005. Land cover classification system: classification concepts and user manual. Food & Agriculture Org., Rome.
Fugate, D., Tarnavsky, E., & Stow, D., 2010. A survey of the evolution of remote sensing imaging systems and urban remote sensing applications. In Remote sensing of urban and suburban areas. Springer, Berlin, New York, pp. 119-139
Helmer, E. H., & Ruefenacht, B., 2005. Cloud-free satellite image mosaics with regression trees and histogram matching. Photogrammetric Engineering & Remote Sensing, 71(9), pp. 1079-1089.
Kerschner, M., 2001. Seamline detection in colour orthoimage mosaicking by use of twin snakes. ISPRS journal of photogrammetry and remote sensing, 56(1), pp. 53-64.
Llamas Barba, R., Colditz, R., López Saldaña, F. & Hruby, F., 2015. Diversidad de la cobertura de suelo en México. Biodiversitas, 120, pp. 2-7.
Li, L., Yao, J., Lu, X., Tu, J., & Shan, J., 2016. Optimal seamline detection for multiple image mosaicking via graph cuts. ISPRS Journal of Photogrammetry and Remote Sensing, 113, pp. 1-16.
Li, X., Hui, N., Shen, H., Fu, Y., & Zhang, L., 2015. A robust mosaicking procedure for high spatial resolution remote sensing images. ISPRS Journal of Photogrammetry and Remote Sensing, 109, pp. 108-125.
Mas, J. F., Velázquez, A., Díaz-Gallegos, J. R., Mayorga-Saucedo, R., Alcántara, C., Bocco, G., Castro, R., Fernández, T. & Pérez-Vega, A., 2004. Assessing land use/cover changes: a nationwide multidate spatial database for Mexico. International Journal of Applied Earth Observation and Geoinformation, 5(4), pp. 249-261.
Mills, S., & McLeod, P., 2013. Global seamline networks for orthomosaic generation via local search. ISPRS Journal of Photogrammetry and Remote Sensing, 75, pp. 101-111.
Saito, S., Arai, R., & Aoki, Y., 2015. Seamline Determination Based on Semantic Segmentation for Aerial Image Mosaicking. IEEE Access, 3, pp. 2847-2856.
Wan, Y., Wang, D., Xiao, J., Lai, X., & Xu, J., 2013. Automatic determination of seamlines for aerial image mosaicking based on vector roads alone. ISPRS Journal of Photogrammetry and Remote Sensing, 76, pp. 1-10.
Yu, L., Holden, E. J., Dentith, M. C., & Zhang, H., 2012. Towards the automatic selection of optimal seam line locations when merging optical remote-sensing images. International journal of remote sensing, 33(4), pp. 1000-1014.
All online references last visited on April 7, 2016.
.
Revised February 2016
Figure 4. Prototype of the mosaic (incl. 4338 RapidEye scenes), detailing the Baja California Peninsula [1] and the Lacandon Jungle in Chiapas (Published online: http://www.biodiversidad.gob.mx/atlas/mosaico/CONABIO_MosMex_092015_leaflet.html).
![Figure 4. Prototype of the mosaic (incl. 4338 RapidEye scenes), detailing the Baja California Peninsula [1] and the Lacandon Jungle in Chiapas (Published online: http://www.biodiversidad.gob.mx/atlas/mosaico/CONABIO_MosMex_092015_leaflet.html)](https://thumb-ap.123doks.com/thumbv2/123dok/3290937.1403583/6.595.58.541.65.736/prototype-rapideye-detailing-california-peninsula-lacandon-published-biodiversidad.webp)
