EXPLORATORY USER STUDY TO EVALUATE THE EFFECT OF STREET NAME
CHANGES ON ROUTE PLANNING USING 2D MAPS
Victoria Rautenbach1, Serena Coetzee1, Melissa Hankel1,
1
Centre for Geoinformation Science, Department of Geography, Geoinformatics and Meteorology, University of Pretoria, Pretoria, South Africa, [email protected], [email protected], [email protected]
Commission II, WG II/6
KEY WORDS: Street name changes, Eye tracking, Route planning, 2D maps, User study
ABSTRACT:
This paper presents the results of an exploratory user study using 2D maps to observe and analyse the effect of street name changes on prospective route planning. The study is part of a larger research initiative to understand the effect of street name changes on wayfinding. The common perception is that street name changes affect our ability to navigate an environment, but this has not yet been tested with an empirical user study. A combination of a survey, the thinking aloud method and eye tracking was used with a group of 20 participants, mainly geoinformatics students. A within-subject participant assignment was used. Independent variables were the street network (regular and irregular) and orientation cues (street names and landmarks) portrayed on a 2D map. Dependent variables recorded were the performance (were the participant able to plan a route between the origin and destination?); the accuracy (was the shortest path identified?); the time taken to complete a task; and fixation points with eye tracking. Overall, the results of this exploratory study suggest that street name changes impact the prospective route planning performance and process that individuals use with 2D maps. The results contribute to understanding how route planning changes when street names are changed on 2D maps. It also contributes to the design of future user studies. To generalise the findings, the study needs to be repeated with a larger group of participants.
1. INTRODUCTION
The Greek philosopher, Heraclitus (535 – 475 BC) and French author François de la Rochefoucauld (1613 – 1680) are both quoted to have said that the only thing constant in life is change. This holds true also in post-apartheid South Africa, which has seen much change since 1994. Geographic name changes are an example and specifically street name changes occur frequently. In 2013, more than 20 streets concentrated in the city centre of the City of Tshwane, South Africa were changed and political parties and the general public are still debating these changes. The common perception is that street name changes affect our ability to navigate an environment because maps might be out-dated or old street names might be used when providing directions. However, this has not yet been tested with an empirical user study.
Wayfinding is the cognitive process of finding a route between two points - an origin and a destination (Xia et al. 2008). During this process, a cognitive map is used to mentally visualise the route between the two points. The route is created by connecting parts of a network graph to build a complete path between the origin and destination. This wayfinding task is commonly known as, route planning (or path planning). Route planning is the incremental process of identifying a sequence of movements between the current location of the wayfinder and the destination (Hölscher et al. 2011). Route planning can be divided into three types: situated (in the moment); prospective self (future planning for oneself); and prospective other (e.g. providing directions for another person). Street names, addresses and landmarks are vital aids in route planning. Individuals tend to use them as decision points when planning a route from the origin to the destination (Meilinger 2005). The decision-making process is unique for each individual and one cannot predict how an individual will plan a route.
This paper reports on a study that contributes to understanding the role of street names in decision-making during route planning. The study is part of a larger research initiative to understand the effect of street name changes on wayfinding. We present the results of an exploratory user study using 2D maps to observe and analyse the effect. The remainder of the paper is structured as follows: Section 2 provides an overview of results from related studies on route planning and background information on two research methods used in this study; in Section 3 the method is described; in Section 4 the results are presented; and Section 5 offers conclusions.
2. BACKGROUND
2.1. Related studies on route planning
Maps are considered to be one of the most important wayfinding aids. They may vary in level of detail and information displayed. Each of these variations may result in a different outcome when used for a wayfinding task, such as route planning (Meilinger 2005). Commonly, an individual plans multiple routes in case of unexpected barriers. The complexity and layout of an environment may have an effect on performance (Hölscher et al. 2006).
difference in performance between participants of two distinct age groups. They found that older individuals (about 70 years of age) struggle to recall the location of landmarks along a specified route (Head & Isom 2010).
Spiers and Maguire (2008) found that individuals produce very diverse results when planning a route. For example, when navigating, some participants only plan the next direction (street) that needs to be taken, while others specify all directions required to reach the destination before starting to navigate. Another common approach was to start planning the route from the destination and working backwards. Some participants reported that memorable street names assisted with the process. Spiers and Maguire (2008) also found that the distance and number of streets between the origin and destination influence the route selection.
Related studies investigate the use of landmarks versus street names when navigating through an environment (Hölscher et al. 2006; Kato & Takeuchi 2003; Montello & Sas 2006; Spiers & Maguire 2006; Spiers & Maguire 2008). Landmarks are generally seen as very important during navigation. As landmarks are easily recognisable, they are used to check one’s current position when executing a route plan. Reports on the effect of street name changes on route planning were not found in the reviewed scientific literature.
2.2. Eye tracking and the Santa Barbara sense of direction scale
Eye tracking and the Santa Barbara sense of direction (SBSOD) are used in this research to evaluate and predict an individual’s route planning ability. Eye tracking used with the think aloud protocol can indicate every feature looked at by an individual, even if the individual did not mention it during the verbalisation process (Gerjets et al. 2011).
Eye tracking has been successfully used to investigate how individuals read maps (Ooms et al. 2012; Atrey et al. 2012; Dong et al. 2014; Bektaş & Çöltekin 2011), and understand 3D geovisualizations (Taylor et al. 2013). Eye tracking provides researchers with a new tool to understand how individuals view and memorize information. For example, Afrooz et al. (2014) employed eye tracking to investigate how navigational cues in a built environment assist travellers in wayfinding. They evaluated individuals’ visual memory of landmarks by presenting them with photographs in a scene recognition task. The results contribute towards the design of buildings, open spaces and computer-assisted guidance applications. In this study, we used an inexpensive device, called EyeTribe eye tracker1. Dalmaijer (2014) found that the device could be used successfully for this type of user studies.
Predicting an individual’s environmental spatial ability (i.e. route planning and learning the layout of a building/city) has improved as self-reporting measures became more reliable. Hegarty et al. (2002) found a strong correlation between self-reported sense of direction (SOD) and environmental spatial cognition. As a result, they developed the SBSOD, a standardised self-reporting scale of environmental spatial ability. SBSOD requires individuals to rate their SOD as good or poor; in the process they are actually rating themselves on map tasks, such as route planning, orientation, learning the layout of an environment, and navigating (Hegarty et al. 2002; Montello & Sas 2006). Poor SOD has been connected to
1https://theeyetribe.com
frequent disorientation and general anxiety when completing wayfinding tasks, such as route planning and execution.
3. METHOD
3.1. Overview
This paper presents an exploratory user study employing 2D maps to understand the impact of street name changes on prospective route planning. Ideally, participants navigating through a real world environment should be studied. Unfortunately, due to time and cost constraints, it was not possible to eliminate distractions in a real world environment and to guarantee the safety of participants. Thus, as a first step towards the ultimate goal of understanding the effect of street name changes on wayfinding, this study focussed on route planning using 2D maps. The user study was designed to investigate route planning, and to provide insight into how individuals perform route planning in a changing environment.
For this user study, a combination of three methods was used to capture the responses: a survey, the thinking aloud protocol and eye tracking. These methods were selected as they provide a wide range of rich data for subsequent analysis. The participants were mainly geoinformatics students, and a within-subject participant assignment was used. The independent variables in this study were the street network (regular and irregular) and orientation cues (street names) portrayed on a 2D map. The following dependent variables were captured: performance (was the participant able to plan a route between the origin and destination?); the accuracy (was the shortest path identified?) deducted from the verbal description provided; the time taken to complete a task; and fixation points captured with eye tracking. The accuracy was measured by examining (post-experiment) the route described by the participant to navigate between origin and destination; a short or direct route is considered more accurate than a longer route with unnecessary turns. Additionally, basic demographic information was also captured for each participant. To complement the data, the SBSOD test (refer to Section 2.2 for a description) was used to record participants’ self- reported SOD, which directly impacts their route planning ability.
3.2. Materials
This section describes the four maps used in this user study: • Regular structured street network (grid) with
landmarks and:
o old street names (RO). See Figure 1. o new street names (RN).
• Irregular structured street network (free flowing patterns) with landmarks and:
o old street names (IO). See Figure 2. o new street names (IN).
F consisted of two sessions, described below.
Session 1:
The first session started with the moderator providing the participant with an overview of what to expect during the user study. The EyeTribe eye tracker was used on the 60Hz mode (sampling rate) and calibration was done with 12 points. A 23-inch screen (1920 x 1080 pixels) was used to display the stimuli
within the open gaze and mouse analyzer (OGAMA)2 using the fixation detection algorithms from LC Technologies.
The remainder of the session consisted of four parts, carried out for the regular and irregular street network respectively (summarized in Table 1):
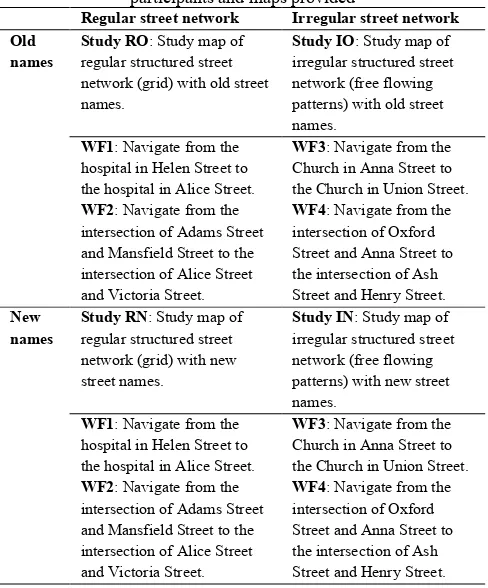
1. Firstly, during the learning phase each participant was provided with the first map with old street names and landmarks (RO and IO) (refer to Figure 1 and Figure 2 respectively). The participant was given five minutes to become familiar with and study the map (referred to as Study RO and Study IO respectively). 2. The participant was asked to complete two
wayfinding tasks, specifically prospective route planning between a specified origin and destination (WF1 and WF2 for the regular network; WF3 and WF4 for the irregular network), using the map with old street names and landmarks (RO and IO). The eye tracker was used to gather fixation points and the participant was also asked to provide detailed verbal directions on how to navigate between the origin and destination. Verbal directions were recorded.
3. This was followed by a five minute learning phase of the respective maps with new street names and landmarks (Study RN and Study IN). A table with the ten street name changes was provided.
4. Lastly, the participant was asked to perform the same route planning instructions (WF1 to WF4) on the maps with new street names (RN and IN).
Table 1. Summary of the route planning tasks as presented to participants and maps provided
Fixation data recorded during all tasks can be analysed through various techniques. This paper presents only results of fixations, attention maps and area of interest (AOI). These techniques provide insight into the distribution of fixations and AOIs,
which are relevant to the use of street names or landmarks for route planning. Methods, such as scan paths or saliency maps, would complement the results, but are considered supplementary techniques and not primary for this user study.
Session 2:
During this session, basic demographic data (e.g. age, gender, and expertise) and the self-reported SOD of each participant was collected using the SBSOD test. Responses were captured via the Qualtrics3 online survey platform.
4. RESULTS
In this section, the results of two sessions of the user study are presented. Twenty (ten male and ten female) participants between the age of 20 and 26 (average age of 23) took part in the study. The majority of the participants (75%) were geoinformatics students, and the remaining participants were software developers (15%), a survey technician (5%) and a GIS intern (5%).
4.1. Session 1
Results of the dependent variables are presented and discussed in the following order: performance; accuracy deducted from the verbal descriptions; and fixation points captured.
All the participants successfully completed (performance) the route planning tasks on the RO, RN and IO maps. However, only 75% of participants were able to complete the tasks on the irregular street network with new street names (IN+WF3 and IN+WF4). Additionally, fewer participants were able to plan a route along the shortest path in these tasks.
When considering accuracy, participants performed better in the route planning tasks that started from a specified landmark only 3% of the area, thus landmarks drew more attention.
Figure 3. Average duration in seconds per route planning task
Figure 3 shows the average number of seconds spent on the learning phases and the route planning tasks (as specified in Table 1). Participants spent more time completing individual tasks than studying the maps during the learning phase. On
3http://www.qualtrics.com
average, only eighty seconds were used to study the map when five minutes were available. The tasks involving the irregular street network (IO+WF3, IO+WF4, IN+WF3 and IN+WF4) were on average completed in less time than the tasks based on the regular street network (RO+WF1, RO+WF2, RN+WF1 and RN+WF2). Because the irregular network was presented to the participants after the regular network, one cannot conclude whether this difference is due to the fact that the participants were now familiar with the procedure to be followed, or due to the irregular network providing more visual clues (unique vs. repetitive pattern) that makes it easier to memorize. To confirm this, the study needs to be repeated with networks being presented in a different order.
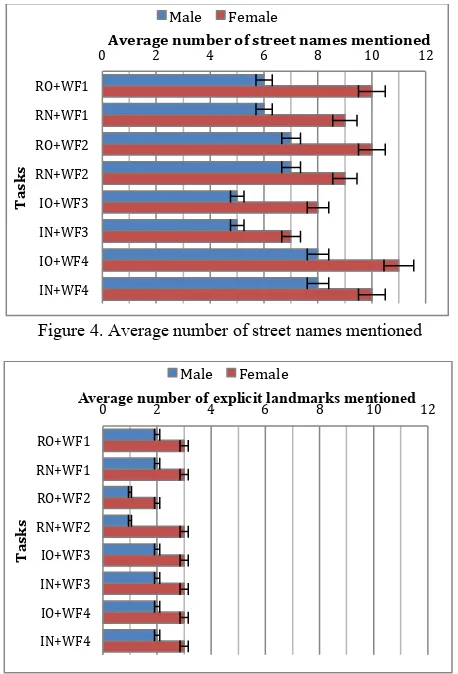
Participants were asked to provide detailed verbal instructions for navigating between the origin and destination. These instructions were recorded and afterwards transcribed. The transcriptions were reviewed and the number of times a street name, an explicit landmark (e.g. a church or school) and an implicit landmark (e.g. crossing of two streets) is mentioned, was counted. Results are depicted in Figure 4, Figure 5 and Figure 6 respectively. Female participants mentioned at least two more street names than male participants; they also mentioned explicit landmarks more often than their male counterparts. However, landmarks (both explicit and implicit) are mentioned fewer times than street names. See Figure 7.
Figure 4. Average number of street names mentioned
Figure 5. Average number of explicit landmarks mentioned
If participants do not keep their heads still when eye tracking data is captured, the data may be incomplete or inaccurate. Unfortunately, the eye tracking data of five participants were incomplete and could therefore not be included in the analysis presented here, i.e. data for only 15 participants (eight females and seven males) is presented. The data captured for Study RN 0
Average number of street names mentioned
T
Average number of explicit landmarks mentioned
T
a
sk
s
and Study IN was incomplete for all participants and is also not included.
Figure 6. Average number of implicit landmarks mentioned
Figure 7. Street name and landmark mentions
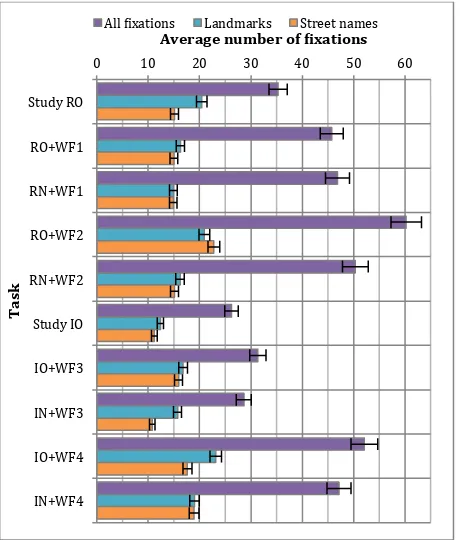
Figure 8. Fixations on landmarks and street names
For all tasks, the average number of fixations on landmarks (17.6) was higher than on street names (15.7). See Figure 8. This can be attributed to the fact that the landmarks are displayed in red and cover a larger area on the maps, as previously mentioned. The average number of fixations per second was almost constant (around 0.4s) with very little variation between the different maps and tasks. The average mean duration of fixations shows that most participants took time to look at the map, specifically the RO map, which was presented first, before proceeding with the route planning tasks.
Generally, the average mean fixation duration (i.e. time spend at each fixation point) after street name changes was longer (RN+WF2, IN+WF3 and IN+WF4). The average mean fixation duration for RN+WF1 was the highest when compared to the other maps; this could be because it is the first map with street name changes presented to participants. Generally, the average mean fixation duration for the irregular street network maps was longer, suggesting that due to their complexity the participants focussed more on different aspects of the map. The complexity of the irregular map might have also contributed to a higher cognitive load that would affect the individuals’ performance.
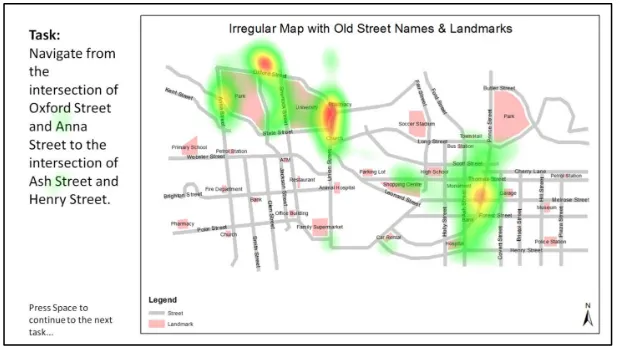
An attention map (calculated using the Gaussian distribution) allows the visualization of fixation data merged from selected participants; this provides insight into the areas of the map that attracted the most attention. Figure 9 and Figure 10 are two examples of attention maps for tasks RO+WF2 and RN+WF2. It can be observed that most of the attention in both cases was on the origin (start location) and the surrounding area (refer to Figure 9). With RN+WF2, even more attention was placed on the origin, which could be due to participants searching for the correct starting location given in new street names. Interestingly, with RN+WF2 some focus was also on the new street names in the task description (refer to Figure 11 and Figure 12). The attention map for IN+WF4 shows that less time is spent on fewer fixation points, compared to IO+WF4. This suggests that participants may have memorized the pattern of the irregular street network and therefore were able to do the route planning faster, despite the street name changes.
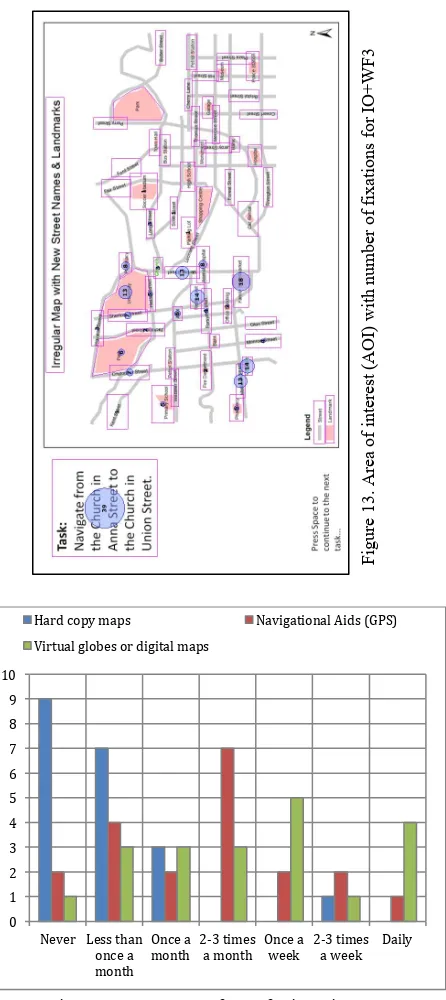
AOIs were drawn over all the landmark and street names in the maps, so that the following parameters could be calculated: fixation time, average fixation duration and number of fixations on a specific AOI or AOI group. AOIs were divided into two categories: street names and landmarks. The AOI maps show that specifically for IO+WF3 most fixations occurred on the task description. When a task was repeated with new street names, less attention was given to the task description, and more attention was placed on the familiar landmarks, suggesting that participants used the landmarks as ‘anchors’ to orientate themselves on the map (refer to Figure 13).
4.2. Session 2
In Session 2, basic demographic data were collected and the participants were also asked to complete the SBSOD test. To better understand which orientation cues the participants preferred, they were asked to indicate the frequency of use. A noticeable trend was that hard copy maps are not used as often as digital wayfinding aids, such as GPSs.
0 2 4 6 8 10 12
RO+WF1
RN+WF1
RO+WF2
RN+WF2
IO+WF3
IN+WF3
IO+WF4
IN+WF4
Average number of implicit landmarks mentioned
T
a
sk
Male Female
0 4 8 12 16 20 24
RO+WF1
RN+WF1
RO+WF2
RN+WF2
IO+WF3
IN+WF3
IO+WF4
IN+WF4
Average number of mentions
T
a
sk
Street names Landmarks
0 10 20 30 40 50 60
Study RO
RO+WF1
RN+WF1
RO+WF2
RN+WF2
Study IO
IO+WF3
IN+WF3
IO+WF4
IN+WF4
Average number of 7ixations
T
a
sk
Figure 9. Attention map of RO+WF2 showing fixation hotspots for all participants
Figure 10. Attention map of RN+WF2 showing the fixation hotspots for all participants Figure 11. Attention map of IO+WF4 showing fixation hotspots for all participants
Figure 12. Attention map of IN+WF4 showing fixation hotspots for all participants
When asked (yes or no) whether street name changes affected how they planned a route, 70% of the participants answered yes. However, only 35% of the participants responded that their daily activities were influenced by street name changes. Participants were also asked whether they generally used landmarks when navigating, and the majority (95%) responded in the affirmative. Refer to Figure 14. When asked which orienting aid – street name or landmark – they generally preferred, the results were 50/50, indicating that some individuals seem to prefer street names even though they use landmarks for route planning.
F
Figure 14. Frequency of use of orientation cues
5. DISCUSSION AND CONCLUSION when street names are changed, and contributes to the design of similar user studies in the future.
Analysis of the verbal instructions suggests that both street names and landmarks are used for route planning with 2D maps, even though participants indicated a preference for street names when asked. Fixation points collected during the study indicate slightly more fixation on landmarks than on street names. This can be attributed to the fact that the landmarks cover a larger area on the map and are displayed in red, thus capturing more attention. Furthermore, verbalising the planned route could have impacted the eye movements of the participants. For a next street names when navigating. Our results suggested that female participants provided more detailed verbal instructions than the male participants. Female participants also took more time to complete the tasks. These two factors suggest that female participants took more care in planning the route and verbalising the instructions. The effect of street name changes could be further isolated in future studies by removing any landmarks from the maps.
The tasks involving the irregular street network were on average completed in less time than the tasks based on the regular street network. Because the irregular network was presented to the participants after the regular network, one cannot conclude whether this difference is due to the fact that the participants were now familiar with the procedure to be followed, or due to the irregular network providing more visual clues (unique vs. repetitive pattern) that makes it easier to memorize. To confirm the reason, the study needs to be repeated with networks presented in a different order.
Tasks relying on street crossings as the origin and destination took more time, as participants struggled to locate the crossings, especially after the street name changes. Analysis of the attention maps confirmed that the origin on maps with new street names drew more attention than on maps with old street names. This is probably due to participants searching for the correct starting location in the correct vicinity but unable to immediately recognize the new street names.
Results of the SBSOD test suggest that the participants have above average route planning competences (4,84), and that 25% of the participants fall in the top quantile. These results were confirmed in the user study, as all participants were able to successfully complete the route planning tasks for RO, RN and IO (only 75% successfully completed tasks associated with IN).
Overall, the results of this exploratory study suggest that street name changes impact prospective route planning (i.e. performance, accuracy and time taken to complete the task). After street names are changed, individuals commonly take more time to orientate themselves on the map. Performance of
Hard copy maps Navigational Aids (GPS)
entire South African population, the study needs to be repeated with a larger group of participants.
In future work, we plan to repeat this user study using a 3D environment to simulate being in an actual outdoor situation. This could overcome some of the limitations of using 2D maps. For example, an individual navigating through an environment relies on more than just a map because various visual clues are combined. Another limitation of this study stems from the fact that an individual is only able to build a partial cognitive map from the information presented on the map. Furthermore, in future we would also like to measure the level of anxiety that participants experience when faced with an environment where street names have been changed.
REFERENCES
Afrooz, A.E., White, D. & Neuman, M., 2014. Which visual cues are important in way - finding? Measuring the influence of travel mode on visual memory for built environments. In Universal Design 2014: Three days of creativity and diversity. IOS Press, pp. 394–403.
Atrey, T., Gupta, P. & Atrey, P.K., 2012. Unobtrusive map navigation using eye tracking. In 2012 25th IEEE Canadian Conference on Electrical and Computer Engineering (CCECE). pp. 1–4.
Bektaş, K. & Çöltekin, A., 2011. An Approach to Modeling Spatial Perception for Geovisualization. Procedia - Social and Behavioral Sciences, 21, pp.53–62.
Dalmaijer, E., 2014. Is the low-cost EyeTribe eye tracker any
good for research?. PeerJ PrePrints , DOI:
10.7287/peerj.preprints.585v1.
Dong, W.H., Liao, H., Xu, F. & Zhang, S., 2014. Using eye tracking to evaluate the usability of animated maps. Science China Earth Sciences, 57(3), pp.512–522.
Gerjets, P., Kammerer, Y. & Werner, B., 2011. Measuring spontaneous and instructed evaluation processes during Web search: Integrating concurrent thinking-aloud protocols and eye-tracking data. Learning and Instruction, 21(2), pp.220–231.
Head, D. & Isom, M., 2010. Age effects on wayfinding and route learning skills. Behavioural Brain Research, 209(1), pp.49–58.
Hegarty, M., Richerdson, A.E., Montello, D.R., Lovelace, K. & Subbiah, I., 2002. Development of a self-report measure of environmental spatial ability. Intelligence, 30, pp.425–447.
Hölscher, C., Meilinger, T., Vrachliotis, G., Brosamle, M. & Knauff, M., 2006. Up the down staircase: Wayfinding strategies
in multi-level buildings. Journal of Environmental Psychology, 26(2006), pp.284–299.
Hölscher, C., Tenbrink, T. & Wiener, J.M., 2011. Would you follow your own route description? Cognitive strategies in urban route planning. Cognition, 121(2), pp.228–247.
Hund, A.M. & Minarik, J.L., 2006. Getting From Here to There: Spatial Anxiety, Wayfinding Strategies, Direction Type, and Wayfinding Efficiency. Spatial Cognition & Computation, 6(3), pp.179–201.
Hund, A.M. & Nazarczuk, S.N., 2009. The effects of sense of direction and training experience on wayfinding efficiency. Journal of Environmental Psychology, 29(1), pp.151–159.
Kato, Y. & Takeuchi, Y., 2003. Individual differences in wayfinding strategies. Journal of Environmental Psychology, 23, pp.171–188.
Lövdén, M., Herlitz, A., Schellenbach, M., Grossman-Hutter, B., Kruger, A. & Lindenberger, U., 2007. Quantitative and qualitative sex differences in spatial navigation. Scandinavian journal of psychology, 48, pp.353–358.
Meilinger, T., 2005. Wayfinding with maps and verbal directions. Cognitive Science, pp.1–6.
Montello, D.R. & Sas, C., 2006. Human Factors of Wayfinding in Navigation. In W. Karwowski, Ed. International Encyclopedia of Ergonomics and Human Factors. CRC Press/Taylor & Francis, Ltd., pp. 2003–2008.
Ooms, K., de Maeyer, P., Fack, V., van Assche, E. & Witlox, F., 2012. Interpreting maps through the eyes of expert and novice users. International Journal of Geographical Information Science, 26(10), pp.1773–1788.
Spiers, H.J. & Maguire, E., 2006. Thoughts, behaviour, and brain dynamics during navigation in the real world. NeuroImage, 31(4), pp.1826–40.
Spiers, H.J. & Maguire, E.A., 2008. The dynamic nature of cognition during wayfinding. Journal of Environmental Psychology, 28(3), pp.232–249.
Taylor, P., Wilkening, J. & Fabrikant, S.I., 2013. How users interact with a 3D geo-browser under time pressure. Cartography and Geographic Information Science, 40, pp.40– 52.