THE INFLUENCE OF FLIGHT PLANNING AND CAMERA ORIENTATION IN UAVs
PHOTOGRAMMETRY.
A TEST IN THE AREA OF ROCCA SAN SILVESTRO (LI), TUSCANY.
F. Chiabrando a, A. Lingua b, P. Maschio b, L. Teppati Losèa *
a DAD, Dept. of Architecture and Design, Politecnico di Torino, 10125 Viale Pier Andrea Mattioli, Torino, Italy -
(filiberto.chiabrando, lorenzo.teppati)@polito.it
b DIATI, Dept. of Environment, Land and Infrastructure Engineering, Politecnico di Torino, 10129 Corso Duca degli Abruzzi,
Torino, Italy - (andrea.lingua, paolo.maschio)@polito.it
Commission II
KEY WORDS: UAVs Photogrammetry, Flight Planning, Camera Orientation, 3D documentation
ABSTRACT:
The purpose of this paper is to discuss how much the phases of flight planning and the setting of the camera orientation can affect a UAVs photogrammetric survey. The test site chosen for these evaluations was the Rocca of San Silvestro, a medieval monumental castle near Livorno, Tuscany (Italy). During the fieldwork, different sets of data have been acquired using different parameters for the camera orientation and for the set up of flight plans. Acquisition with both nadiral and oblique orientation of the camera have been performed, as well as flights with different direction of the flight lines (related with the shape of the object of the survey). The different datasets were then processed in several blocks using Pix4D software and the results of the processing were analysed and compared. Our aim was to evaluate how much the parameters described above can affect the generation of the final products of the survey, in particular the product chosen for this evaluation was the point cloud.
* Corresponding author
1. INTRODUCTION
1.1 UAVs photogrammetry for Cultural Heritage data recording
Aerial photogrammetry has become in the last years a widespread technique for the metric documentation of Cultural Heritage. Collection and processing of UAVs data are a fairly consolidated practice and is possible to find many case studies in the scientific literature to acquire RGB images (just to mention a few of them: Aicardi et al., 2016; Fiorillo et al., 2013; Georgopoulos et al., 2016; Gruen, 2009; Nex & Remondino, 2014; Sauerbier & Eisenbeiss, 2010), also in multitemporal application (Aicardi et al., 2016) or multispectral data (Aicardi et al., 2016; Piras et al., 2016; Masiero et al., 2015; Spanò et al., 2016). Many authors have successfully used UAVs in different contexts and with different purposes for large-scale documentation of Cultural Heritage. Moreover, these platforms represent a low-cost alternative to the classical aerial photogrammetry technique (Colomina & Molina, 2014; Irschara et al., 2010) The recent developments of the software for the Structure from Motion (SfM) and the continuous improvements of increasingly automated algorithms for digital photogrammetry brought to an intensive use of this technique in the last years.
In addition, the reliability of these techniques in terms of precision and accuracy, for large-scale documentation purposes, has been already demonstrated by different researchers (Georgopoulos et al., 2016; Harwin & Lucieer, 2012; Rinaudo et al., 2012).
1.2 Integrating oblique cameras
The advantages coming from the integration of nadiral and oblique images acquired by UAVs platform for purposes of metric documentation have aroused the interest of different researchers in the last years. The use of these acquisitions, where the lens axis of the camera is configured with a variable inclination, has a considerable impact in the generation of a 3D model from a photogrammetric survey, especially in case of complex objects or sites that present standing structures with a considerable height. As mentioned before, several researchers focussed their attention on the study of these specific images and in the optimization of the algorithms for the use of these “non-conventional” views (Gerke, 2009; Höhle, 2008; Remondino et al., 2016; Rupnik et al., 2014). Two previous experiences that were developed by the Geomatic group of the Politecnico di Torino were connected to the topic of oblique cameras utilization: one was conducted on the S. Maria Chapel, part of the Novalesa Abbey, and the other one on the Hercules Fountain in the gardens of Venaria Reale (Aicardi et al., 2016; Chiabrando et al., 2016). In both the test sites different aerial acquisitions with oblique cameras were performed and analyses between the expected and actual results were realized. These experiences allowed us the chance to test for the first time the impact of integration between nadiral and oblique cameras in the context of architectural and archaeological objects with well-preserved structures in terms of elevation above ground surface and texture-complexity of the masonries.
1.3 The test site: Rocca San Silvestro
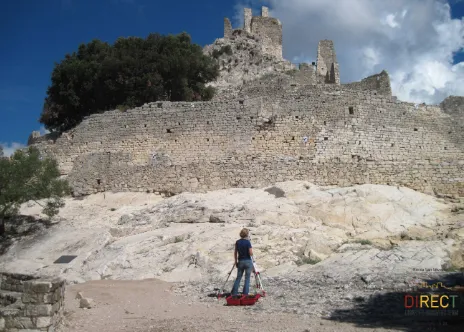
The Rocca of San Silvestro (Figure 1) is a medieval fortified village (founded in the tenth century A.D.) near the The International Archives of the Photogrammetry, Remote Sensing and Spatial Information Sciences, Volume XLII-2/W3, 2017
municipality of Campiglia Marittima (LI), Italy. The Rocca is part of an Archaeological Mines Park and is included in the Parchi della Val di Cornia (a system of archaeological parks, natural parks and museums in the south-west of Tuscany). This stunning archaeological site is included in a rich and complex territory tightly tied with the mining activity. The
Rocca of San Silvestro was a stronghold founded to control the mineral resources and monitor their extraction. The central point of the settlement was represented by a tower, around which all the other structures would have been built during the centuries. During the period of maximum splendour (twelfth century A.D.) the village was encompassed by massive defensive walls that included several houses for the miners, a church dedicated to S. Silvestro (that will lately name the site), a cemetery and different other structures (bread oven, ceramic kiln, forge, oil mill, etc..). Starting from the 1984 the site was excavated and studied by the late Professor Riccardo Francovich and his team (Bianchi, 1997; Francovich & Parenti, 1987; Francovich & Wickham, 1994); in the 1996 the Archaological Mining Park was founded (Guideri, 2008). The site presented well conserved structures of the medieval period (Bianchi, 1996; Semplici, 2011), that are still standing for a considerable height; this factor and the complexity of the site were some of the reasons that suggested us the integrated use of aerial oblique images.
Figure 1. Rocca San Silvestro, south view of the site-starting point of the guided tour.
2. FIELDWORK AND DATA ACQUISITION 2.1 On site survey
In September 2016, in the context of an agreement between the system of Parchi della Val di Cornia and the Politecnico di Torino, was possible to realize a week of fieldwork with a team of students, coordinated by professors and researchers, in the site of Rocca San Silvestro. A multi-sensors survey was planned and realised with the aim of integrate different techniques (UAV, Terrestrial Laser Scanning (TLS), close-range photogrammetry etc). As usual, the first step (preliminar to all the acquisitions) was the creation of a topographic network measured by standard techniques such as GPS\GNSS and Total Station. Afterwards, pre-signalized Ground Control Points (GCPs), in the form of paper and plastic targets, were placed to cover the whole extension of the site and to be used for the phases of processing and georeferencing of the subsequent acquisitions. The GCPs placed to be use for the flights were
then measured with Real Time Kinematic (RTK) GPS\GNSS and Total Station side shot operation. On the other hand, the GCPs for TLS and for close-range photogrammetry were measured only with the prism-less Total Station. The measurement of several GCPs was fundamental to georeference all the survey products to the same coordinate system. After the first topographic phase both aerial and terrestrial acquisitions were carried-out: in parallel with the acquisitions of aerial photogrammetry, terrestrial acquisition for close-range photogrammetry and TLS acquisitions were completed as well.
2.2 The UAV platform
The platform (UBIK DIATI MK01) is a multi-rotor platform equipped by the Pixhawk flight controller (Figure 2). The system is composed of six motors and the electronic equipment required for both the remote control and the automatic flight, as well as one computer serving as the ground control station. The system has a payload of about 1 kg with a maximum flight time of about 12–15 min at a nominal cruise speed between 3 and 5 m/s. For this survey the multi-rotor platform was equipped with a Sony Alpha 5100 digital mirror less camera with the following main characteristics: 24.3 MPixel CMOS sensor, 6000*4000 max image size, sensor size 23.5 x 15.6 mm, pixel size 3.92 μm, weight 283 g (batteries included) equipped with a 20 mm lens. The digital camera is mounted on a servo-assisted support that grants electronically-controlled rotations along the principal axes. This system was essential to set up the different camera configurations and orient the lens axis during the acquisition phases.
Figure 2. The employed platform - UBIK DIATI MK01
2.3 Flights planning
The planning of the flights was realized according to different factors: the overall extension of the site, the shape and the development of the ground, the height of the standing structures and the expected output of the survey. Especially the particular shape of the object has led the operators to strongly consider the oblique images as fundamental data for a complete documentation of the Rocca San Silvestro. The afore mentioned parameters were considered in addition to other standard set-up that are generally controlled as well: wind, cruise speed, parameters of the camera such as exposure, white balance, etc. The flights were also planned to ensure a large overlap between the different images (>80% along strips, >70 % across strips). The employed software for mission planning was Mission Planner, created by Michael Oborne, that connects the platform to the ground station. This tool is used to set all the parameters of the flight plan, using as a reference map of the area (e.g., Google Maps, Bing Maps, etc.). The flight planning approach chosen was the traditional one, based on the definition of waypoints (a reference point in the physical space used for the navigation, usually placed at the beginning and at the end of the stripes).
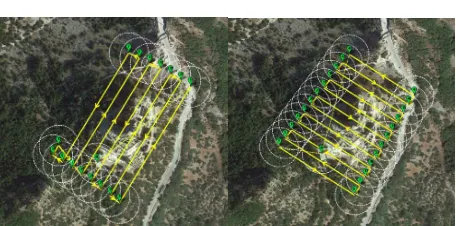
The flights were planned and executed with the following modalities (summarized in the Figures 3 a-c):
1. Nadiral configuration of the camera. Flight lines direction North-South.
2. Nadiral configuration of the camera. Flight lines direction West-Est.
3. Oblique configuration of the camera (≈45°). Flight lines direction North-South.
4. Oblique configuration of the camera (≈45°). Flight lines direction West-Est.
5. Oblique configuration of the camera (≈45°). Circular flight lines with the centre of the circle in the middle of the site.
The duration of each flight was around 15 minutes and the five flights were performed at flight elevation of about 30-40 m above ground surface. For all the flights a total of 1119 images was acquired:
- Nadiral configuration (North-South): 118 images - Nadiral configuration (West-Est.): 153 images - Oblique configuration (North-South): 278 images - Oblique configuration (West-Est):177 images - Circular: 393 images
Figure 3 a. Flight plans and camera configuration: 1) Nadiral-N-S; 2) Nadiral-W-E
Figure 3 b. Flight plans and camera configuration: 3) Oblique-N-S; 4) Oblique-W-E
Figure 3 c. Flight plans and camera configuration: 5)Oblique-Circular
3. PROCESSING OF THE UAV ACQUISITIONS 3.1 Processing workflow with Pix4D
The next phase of the work was the processing of the on site acquired data; the images of the different flights were processed
in several blocks with the software Pix4D Mapper (Gini et al., 2013; Ostrowski & Hanus 2016; Rodrigues et al., 2016). As previously reported, we decided to use a specific product for our evaluations about the main topic of this article, then the processes of all the seven projects were stopped at the phase of point cloud generation (no other products such as meshes or ortophotos were created in this phase).
The steps for the generation of the point cloud were the following: camera orientation and tie point (TPs) extraction with the initial processing, images georeferencing using ground control points (GCPs), point cloud densification. The interior and exterior camera orientation, performed into a relative coordinate system, was automatically calculated using the data extracted by the on-board GPS in the initial processing. Then a sparse model using the computed TPs, measured using the SIFT algorithm was realized with an automatic aerial triangulation (bundle block adjustment). In the second phase, the user could manually adjust the results by introducing known real world coordinates of several points using the measured on ground GCPs. Naturally in order to evaluate the accuracy of the results several measured GCPs were used as check points (CPs). Finally, the next used step was the densification. This part is typically performed by the process known as dense matching and uses the sparse model and initial estimation of camera orientation to reproject individual pixels in real coordinate space, according to the different parameters that could be set-up in the software. The achieved point clouds have been obtained using the half image size setting.
3.2 Combination of the different sets of data
In order to test some different configurations, we decided to combine the different set of aerial data in the following projects:
1. The two nadiral acquisitions 2. The two oblique acquisitions 3. The circular acquisition
After this first phase the different flights were combined between each other in the following projects:
4. The two nadiral and the circular acquisitions 5. The two oblique and the circular acquisitions 6. The two nadiral and the two oblique acquisitions 7. All the five flight
All these projects were processed using the same set of GCPs and with at least six CPs (i.e. left outside of the processing phases and used to assess the accuracy of the project). As was partially reported before the parameters that the user can set in the software were fixed with the same values in all the projects, in particular:
• In the initial processing the keypoints image scale was fixed as full (original image size)
• In the point cloud densification in order to speed up the process the image scale was fixed as ½ half image size (considered as default in Pix4D), with a point density setup on Optimal (one 3D point is computed every 8 pixels of the original image) with a minimum number of matches equal to three (each 3D point has to be correctly re-projected in at least 3 images).
3.3 Consideration about processing, accuracy and final products
As stated in the previous paragraph the accuracy of the different projects was assessed through the use of six CPs. The root mean squares (RMSs) of the seven project are reported in Table 1. The International Archives of the Photogrammetry, Remote Sensing and Spatial Information Sciences, Volume XLII-2/W3, 2017
RMS X(m) RMS Y(m) RMS Z(m)
1 0.009 0.010 0.010
2 0.007 0.008 0.017
3 0.008 0.008 0.018
4 0.011 0.013 0.015
5 0.007 0.007 0.019
6 0.009 0.008 0.019
7 0.012 0.009 0.018
Table 1. RMSs (mean) of the check points (CPs) used in the seven projects
According to the achieved results, all the flights could be considered suitable for a correct production of the typical image based survey products such us point clouds 3D models and orthophoto.
Starting from this assumption we decided to investigate another issue that was not considered in the first phases of the data processing. The number and the type of the images used can also affect the initial processing? We used the same set of GCPs (in a total number of 20) in all the project, independently from the number and type of images. Are all these points necessary to ensure an accurate georeferencing of the model or the minimum number of points to be used is related with the number and/or type of images? To evaluate this factor another short test was performed as well, according to some interesting consideration that are reported in several papers that deal with the photogrammetric simulation using robust statistical approach (Dall’Asta et al., 2015; Hastedt, 2004; Luhmann, 2011) According to this assumption, the attention was focused on two projects, selected on the base of the results of the research presented in this paper. The idea of evaluate the impact of the camera and flight configuration also on the accuracy of the bundle block adjustment of the projects is a second step of research. The combinations of configurations that has been chosen for this evaluation were the following: the one that we considered to have generated the lowest number of information (the two nadiral acquisitions), the one that we considered to have produced the highest number of information (all the five flights). In the two selected projects four point were used as GCPs (the points were selected to be at the external limits of the surveyed area – Figure 4) and all the other points were used as check points.
The results of this test are show in Table 2.
RMS X(m) RMS Y(m) RMS Z(m)
1 0.020 0.018 0.047
7 0.012 0.011 0.027
Table 2. RMSs (mean) of the check points (CPs) used to evaluate the impact of camera and flight configuration on the
accuracy of the bundle block adjustment
This first preliminary analysis showed a clear reduction of the RMS of the CPs (near 50%) between the two considered projects. Is necessary to say that the analysed sample is small and that further tests need to be performed, nevertheless these are interesting results that need to be deeply investigate, also considering the statistical impact of other different set of data.
4. ANALYSIS AND COMPARISON OF THE RESULTS A complex and stratified site, as Rocca San Silvestro, combined with the purpose of testing the different configuration parameters of camera orientation and flight planning has led
inexorably to an intensive collection of data in terms of quantity and quality.
All these factors allow the generation of dense point clouds that present large dimensions in terms of bytes and that are not always easily manageable. To solve this problem, we decided to report in the present paper quantitative/qualitative analyses of the photogrammetric products only on two significant samples and not on the whole point cloud.
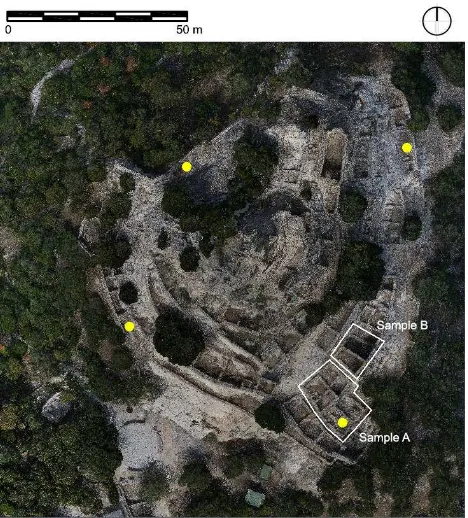
The samples were not accidentally chosen, but we tried to identify peculiar areas of the site to represent specific features of the surveyed object (horizontal and vertical developments of the walls and the development of the ground). The two samples cover part of the ancient residential area of the site (Figure 4).
Figure 4. Position of the two selected samples and of the 4 GCPs (in yellow) used to evaluate the impact of the different
configuration on the initial processing of the projects
Sample A encloses different residential blocks developed in two levels and their internal road system; the walls preserved are not really high, but are close to each other and the urbanistic system is quite dense in this part of the site. Sample B cover another building of the medieval village where part of the structures is really well preserved; an entire façade is preserved from the ground till the ancient roof support (Figure 5).
Figure 5. Sample A (left) and Sample B (right)
4.1 Evaluation of the point clouds through the density analysis
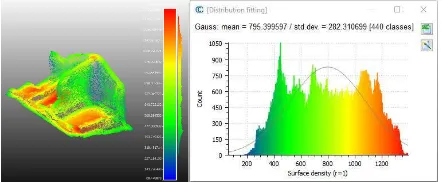
Moreover, another analysis was performed using the density tool of the CloudCompare software. To evaluate the quality of the information contained in the point clouds derived from the different projects the tool was applied on every product and the results were then compared. The tool was applied on the point clouds with the following values: method set as precise (radius 1) and surface density as output. These analyses were very useful and allowed us to evaluate the impact of the different configurations in terms of numbers and distribution of points. The output of this tool can be represented in different forms: one of these is showed in Figures 9 and 10, illustrated as a map coloured by scale with the related graph of distribution of density (images of the tool applied on projects number 1 and 7, i.e. the two nadiral acquisitions and the project with the five flight together, are reported here as example and both sample A and B are represented).
Figure 9a. Density analysis of the project 1 (the two nadiral acquisitions) – Sample A
Figure 9b. Density analysis of the project 1 (the two nadiral acquisitions) – Sample B
Figure 10a. Density analysis of the project 7 (all the five acquisitions) – Sample A
Figure 10b. Density analysis of the project 7 (all the five acquisitions) – Sample B
The results of the density analyses of the other projects are reported in Table 3 and 4.
Density (pt/m²) Tot. Number of points Mean St. dev.
1 1505 894 231
2 1680 1021 235
3 2590 1544 395
4 3365 2166 545
5 3453 2121 495
6 2395 1429 355
7 4114 2574 623
Table 3. Results of density analysis, Sample A
We want to report here some considerations coming from the results of this specific analysis. As expected, the use of oblique images is crucial to improve the density of the point cloud, especially in connection to peculiar features of the surveyed object.
Density (pt/m²) Tot. Number of points Mean St. dev.
1 1393 795 282
2 1848 904 223
3 2881 1372 464
4 3806 1793 642
5 3661 1829 548
6 2150 1175 324
7 4341 2133 701
Table 4. Results of density analysis, Sample B
This element is particular evident on the vertical development of the walls and in the corners between the intersections of the masonries. We also assessed that oblique images can provide a good contribution in the generation of information in the area of connection between walls and ground.
The two aspects mentioned above are particularly marked in Sample B where the standing structures are much more preserved in terms of height compared with the ones of Sample A. It is also interesting to notice here the impact of the phase of flight planning and the consequent relative position of the camera in the moment of image acquisition. On the two samples considered, the impact of the circular flight seems to be really high if compared with the other oblique images. The other two oblique acquisitions were performed following a regular grid of flight lines as showed in Figure 3 b. If we focus our attention on projects 4 (the two nadiral and the circular acquisitions) and 6 (the two nadiral and the two oblique acquisitions) we can notice that the contribution of the circular flight is more substantial if compared with the other two oblique acquisitions. The circular flight is easier to plan and requires shorter time of flight; also in a single flight is possible to acquire a bigger number of images. In our case, it could have represented a good alternative to the two other acquisitions performed to obtain oblique images and a good compromise between operation time on site and quantity and quality of gathered information.
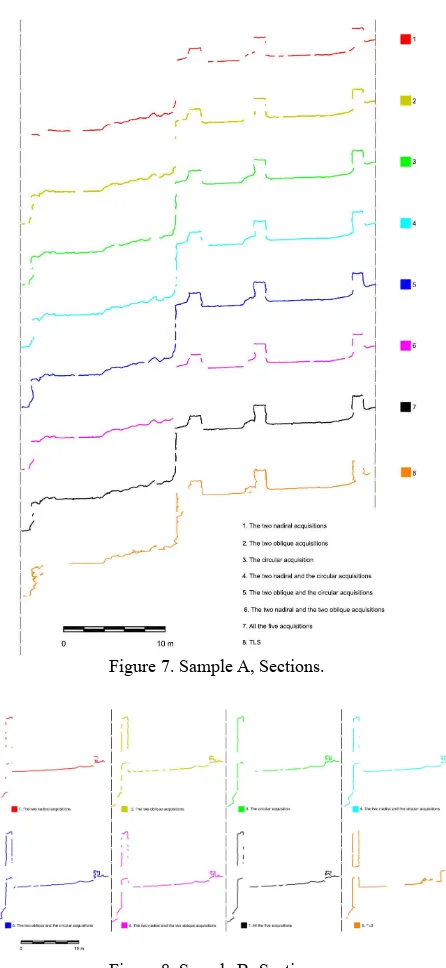
4.2 Evaluation of the clouds through vertical sections To evaluate the quality in the information produced by the different combinations of the aerial images we decided to generate punctual sections of the two samples using 3D Reshaper software by Hexagon. All the seven point clouds, generated from different projects, were sectioned in the same points and using the same values. From the model were extracted the contours using a plane with a width of 4 centimetres and all the points that in this interval presented a distance ≥ 20 centimetre were merged with a line. Different values for the automatic generation of the section were tested and as a result in this specific case the values mentioned above were the best to underline the discrepancies between the different models. The sections extracted from Sample A are showed in Figure 7, the ones extracted from Sample B in Figure 8; the position of the two realized sections is showed in Figure 6.
5. CONCLUSIONS
The achieved results confirmed the interesting improvements that nowadays are connected to the employment of oblique images in UAV acquisition and processing using photogrammetric SfM based software.
Figure 6. Position of the two sections in Sample A (left) and Sample B (right)
Figure 7. Sample A, Sections.
Figure 8. Sample B, Sections.
The comments could be separated in two main parts: concerning the use of GCPs; as was reported before the use of images The International Archives of the Photogrammetry, Remote Sensing and Spatial Information Sciences, Volume XLII-2/W3, 2017
acquired from several points of view allow to reduce the number of GCPs during the data acquisition. This aspect is very important since is one of the most time spending activity during a survey. The reduction of the topographic survey operations for the GCPs collection on the field is an important aspect in terms of cost as well.
The second part is connected to the obtained improvement in the point clouds using oblique images as well. In this scenario, starting from the assumption that for documentation and studying purposes of Cultural Heritage is necessary to extract sections and plans, as is reported in the two sample areas we can notice that using the convergent images is possible to almost extract all the needed information for the realization of a typical archaeological or architectural section. Furthermore, is important to underline that the selected archaeological area, with low height walls and structures is not the perfect environment for testing the improvement of oblique images that allow to extract better information in urban areas where the elevation component is more important and clearly identifiable. Nevertheless, the improvement of the vertical information in the extracted point cloud underline the importance of the oblique images in those kinds of environment as well.
Other analyses are still in progress, firstly a correct approach to the flight planning need to be defined in order to optimize the flight time. Actually, the different analysed configurations seem to drive the preference in the direction of the employment of nadiral images with circular acquisition but further consideration and tests are under evaluation. In this direction, the photogrammetric simulations could help the operators in order to better define the strategy and even more the GCPs position and number.
Finally, in the next data processing step, the study will move to the other available products, that could be obtained from the photogrammetric approach. Starting from the orthophotos (in the vertical direction for documenting the walls) up to the complete textured 3D models that could be easily obtained and easily uploaded nowadays on the web using the different available platforms (Potenziani et al., 2015; Behr et al., 2009; Trautner, T., 2015).
ACKNOWLEDGEMENTS
The authors would like to thank all the persons involved in the project:
• The direction and the staff of Parchi della Val di Cornia (http://www.parchivaldicornia.it/it/) for the logistic and material support, in particular in the person of Debora Brocchini
• All the tutors and students of “Team Direct”
(https://www.facebook.com/Team-Direct-461829537253316/): Manuel Cazzola, Elisabetta Colucci, Albana Dervishi, Francesca Noardo, Giulia Sammartano, Nannina Spanò, Stefano Perri, Simone Rando, Alessandro Spitalieri, Giuseppe Terramagna, Chiara Tosti, Alice Villa.
REFERENCES
Aicardi, I., Chiabrando, F., Grasso, N., Lingua, A. M., Noardo, F., Spanò, A. T.,2016. UAV photogrammetry with oblique images: First analysis on data acquisition and processing. In:
ISPRS-International Archives of the Photogrammetry, Remote Sensing and Spatial Information Sciences, XLI, pp. 835-842.
Aicardi, I.; Chiabrando, F.; Lingua, A.M.; Noardo, F.; Piras, M.; Vigna, B., 2016. A methodology for acquisition and processing of thermal data acquired by UAVs: a test about subfluvial springs' investigations. In: Geomatics, Natural Hazards & Risk, pp. 1-13. - ISSN 1947-5705
Aicardi, I.; Nex, F.; Gerke, M.; Lingua, A., 2016. An Image-Based Approach for the Co-Registration of Multi-Temporal UAV Image Datasets. In: Remote Sensing, vol. 8 n. 9, pp. 779-798. - ISSN 2072-4292
Behr, J., Eschler, P., Jung, Y., Zöllner, M., 2009. X3DOM: a DOM-based HTML5/X3D integration model. In Proceedings of the 14th international conference on 3D web technology, pp. 127-135.
Bianchi, G., 1996. Trasmissione dei saperi tecnici e analisi dei procedimenti costruttivi. In: Archeologia dell’Architettura, I,, pp. 53-65.
Bianchi, G., 1997. Rocca S. Silvestro e Campiglia M. ma: storia parallela di due insediamenti toscani attraverso la lettura delle strutture murarie. In: 1st Congresso Nazionale di Archeologia
Medievale (Pisa, 29-31 May 1997), Florencia, pp. 437-444.
Chiabrando, F., Sammartano, G., Spanò, A. T., Teppati Losè, L., 2016. UAV oblique data and laser scanning in an excavated area. In: 8th International Congress on Archaeology, Computer Graphics, Cultural Heritage and Innovation ARQUEOLÓGICA 2.0, Valencia (Spain), Sept. 5-7, 2016. pp. 350-353
Colomina, I., Molina, P., 2014. Unmanned aerial systems for photogrammetry and remote sensing: A review. In: ISPRS Journal of Photogrammetry and Remote Sensing, 92, pp. 79-97.
Dall'Asta, E., Thoeni, K., Santise, M., Forlani, G., Giacomini, A., Roncella, R., 2015. Network design and quality checks in automatic orientation of close-range photogrammetric blocks. Sensors, 15(4), 7985-8008.
Fiorillo, F., Fernández-Palacios, B. J., Remondino, F., Barba, S., 2013. 3D Surveying and modelling of the Archaeological Area of Paestum, Italy. In: Virtual Archaeology Review, 4(8), pp. 55-60.
Francovich, R., Parenti, R., 1984, (edited by) Rocca San Silvestro e Campiglia. Prime indagini archeologiche. In:
Quaderni del Dipartimento di Archeologia e Storia delle Arti. Sezione Archeologica. Università di Siena, All’insegna del Giglio.
Francovich R., Wickham C. 1994, Uno scavo archeologico ed il problema dello sviluppo della signoria territoriale: Rocca San Silvestro e i rapporti di produzione minerari In: Archeologia Medievale XXI, pp. 7-30
Georgopoulos, A., Oikonomou, C., Adamopoulos, E., Stathopoulou, E. K., 2016. Evaluating unmanned aerial platforms for cultural heritage large scale mapping. In: ISPRS-International Archives of the Photogrammetry, Remote Sensing and Spatial Information Sciences, XLI-B5, pp. 355-362.
Gerke, M., 2009. Dense matching in high resolution oblique airborne images. In: ISPRS-International Archives of the Photogrammetry, Remote Sensing and Spatial Information Sciences, 38, W4.
Gini, R., Pagliari, D., Passoni, D., Pinto, L., Sona, G., Dosso, P., 2013. UAV photogrammetry: Block triangulation comparisons. In: ISPRS-The International Archives of the Photogrammetry, Remote Sensing and Spatial Information Sciences, XL-1/W2, pp. 157-162.
Gruen, A., 2009. Image-based 3D recording and modeling of landscapes and large cultural heritage sites. In: ARCHAIA – Case Studies on Research Planning, Characterization, Conservation and Management of Archaeological Sites.
Guideri, S., 2008. Il Sistema dei Parchi della Val di Cornia e il Parco Archeominerario di San Silvestro (1996-2006). In: Bailly-Maitre, M. C., Jourdanne-Annequin, C., Clermont-Joly, M., (edited by), Archéologie et paysage des mines anciennes: de la fouille au musée, Picard, Paris, pp. 187-195.
Harwin, S., Lucieer, A, 2012. Assessing the accuracy of georeferenced point clouds produced via multi-view stereopsis from unmanned aerial vehicle (UAV) imagery. In: Remote Sensing, 4(6), pp. 1573-1599.
Hastedt, H. (2004). Monte-carlo-simulation in close-range photogrammetry. In: ISPRS International Archives of the Photogrammetry, Remote Sensing and Spatial Information Science. Vol. 35, No. 5, pp. 18-23.
Höhle, J., 2008. Photogrammetric measurements in oblique aerial images. Photogrammetrie, Fernerkundung, Geoinformation, I, pp. 7-14.
Irschara, A., Kaufmann, V., Klopschitz, M., Bischof, H., Leberl, F., 2010. Towards fully automatic photogrammetric reconstruction using digital images taken from UAVs. In:
Proceedings International Society for Photogrammetry and Remote Sensing Symposium, 100 Years ISPRS. Advancing Remote Sensing Science, pp. 65-70
Luhmann, T., 2011. 3D imaging: how to achieve highest accuracy. In: SPIE Optical Metrology International Society for Optics and Photonic, pp. 808502-808502.
A Masiero, F Fissore, A Guarnieri, F Pirotti, A Vettore, 2016. UAV positioning and collision avoidance based on RSS measurements. In: The International Archives of the Photogrammetry, Remote Sensing and Spatial Information Science. Volume XL-1/W4, 2015, pp. 219-225, DOI: 10.5194/isprsarchives-XL-1-W4-219-2015
Nex, F., Remondino, F., 2014. UAV for 3D mapping applications: a review. In: Applied Geomatics, 6(1), 1-15.
Ostrowski, W., Hanus, K., 2016. Budget UAV systems for the prospection of small and medium scale archaeological sites. In:
Proceedings International Society for Photogrammetry and Remote Sensing Symposium, 100 Years ISPRS. Advancing Remote Sensing Science.
Piras, M.; Taddia, G.; Forno, M.G.; Gattiglio, M.; Aicardi, I.; Dabove, P.; Lo Russo, S.; Lingua, A., 2016. Detailed geological mapping in mountain areas using an unmanned aerial vehicle: application to the Rodoretto Valley, NW Italian Alps. In:
Geomatics, Natural Hazards & Risk, pp. 1-13. - ISSN 1947-5705
Potenziani, M., Callieri, M., Dellepiane, M., Corsini, M., Ponchio, F., & Scopigno, R., 2015. 3dhop: 3d heritage online presenter. Computers & Graphics, 52, pp. 129-141.
Remondino, F., Toschi, I., Gerke, M., Nex, F., Holland, D., McGill, A., Talaya Lopez, J. and Magarinos, A., 2016. Oblique Aerial Imagery for NMA - Some Best Practices. In: ISPRS-International Archives of the Photogrammetry, Remote Sensing and Spatial Information Sciences, XXXIX-B5, pp. 583-588., Vol. XLI-B4, pp. 639-645
Rinaudo, F., Chiabrando, F., Lingua, A., Spanò, A.T., 2012. Archaeological site monitoring: UAV photogrammetry can be an answer. In: ISPRS-International Archives of the Photogrammetry, Remote Sensing and Spatial Information Sciences, XXXIX-B5, pp. 583-588.
Rodrigues, J., Figueiredo, M., Bernardes, J., & Gonçalves, C., 2016. 3D Modeling of the Milreu Roman Heritage with UAVs. In: International Conference on Universal Access in Human-Computer Interaction, Springer International Publishing, pp. 329-337.
Rupnik, E., Nex, F., Remondino, F., 2014. Oblique multi-camera systems-orientation and dense matching issues. In:
ISPRS- International Archives of Photogrammetry, Remote Sensing and Spatial Information Sciences, IL-3, pp. 107-114.
Sauerbier, M., Eisenbeiss, H., 2010. UAVs for the documentation of archaeological excavations. In: IAPRS&SIS, Vol. 38(5), Newcastle upon Tyne, UK
Semplici, A., Brocchini, D. & Guideri. S. (edited by), 2011. “Bianca e sfolgorante appare la Rocca…”. Guida al parco archeominerario di San Silvestro. Fotolito Toscana, Firenze.
Spanò, A.; Chiabrando, F.; Dezzani, L.; Prencipe, A., 2016. Digital Segusio: from models generation to urban reconstruction. In: Virtual Archaeology Review, vol. 7 n. 15, pp. 87-97. - ISSN 1989-9947
Trautner, T., 2015. Visualizing Archaeological Excavations based on Unity3D. In Proceedings of Central European Seminar on Computer Graphics.