VISUALIZATION OF THE CONSTRUCTION OF ANCIENT ROMAN BUILDINGS IN
OSTIA USING POINT CLOUD DATA
Y. Hori a, T. Ogawa b a
Dept. of Architecture and Urban Design, Kyushu University, 6-10-1, Hakozaki, Fukuoka 812-8581 - [email protected] b Faculty of Human-Environment Studies, Kyushu University, 6-10-1, Hakozaki, Fukuoka 812-8581 [email protected]
Commission II
KEY WORDS: Laser scanning, Automatic feature-matching algorithm, Plane mapping, Revision, Ostia, Architecture
ABSTRACT:
The implementation of laser scanning in the field of archaeology provides us with an entirely new dimension in research and surveying. It allows us to digitally recreate individual objects, or entire cities, using millions of three-dimensional points grouped together in what is referred to as ‘point clouds’. In addition, the visualization of the point cloud data, which can be used in the final report by archaeologists and architects, should usually be produced as a JPG or TIFF file. Not only the visualization of point cloud data, but also re-examination of older data and new survey of the construction of Roman building applying remote-sensing technology for precise and detailed measurements afford new information that may lead to revising drawings of ancient buildings which had been adduced as evidence without any consideration of a degree of accuracy, and finally can provide new research of ancient buildings. We used laser scanners at fields because of its speed, comprehensive coverage, accuracy and flexibility of data manipulation. Therefore, we “skipped” many of post-processing and focused on the images created from the meta-data simply aligned using a tool which extended automatic feature-matching algorithm and a popular renderer that can provide graphic results.
1. INTORODUCTION
The implementation of laser scanning in the field of archaeology provides us with an entirely new dimension in research and surveying. It allows us to digitally recreate individual objects, or entire cities, using millions of three-dimensional points grouped together in what is referred to as
‘point clouds’. And the visualization of the point cloud data,
which can be used in the final report by archaeologists and architects, should usually be produced as a JPG or TIFF file, although it is now also possible to have them in a 3D PDF, PDS or true vision file in html format, or as a OBJ file.
Not only the visualization of point cloud data, but also re-examination of older data and new survey of the construction of Roman building applying remote-sensing technology for precise and detailed measurements afford new information that may lead to revising drawings of ancient buildings that had been adduced as evidence without any consideration of a degree of accuracy, and finally can provide new research of ancient buildings.
We used phase-comparison laser scanners at fields because of its speed in image capturing, comprehensive coverage, accuracy and flexibility of data manipulation. And the terrestrial laser scanner mounted on a tripod collects 3D coordinates of a given region of a surface automatically and gives that result in near real time.
Architectural historians including us, who have some knowledge of engineering, have sometimes modified previously held notions regarding the structure and planning of ancient buildings, which had been developed by archaeologists who did not necessarily have backgrounds in engineering. Furthermore how the engineer can make a contribution to archaeologists? In
this paper, we “skipped” many of post-processing, which do not
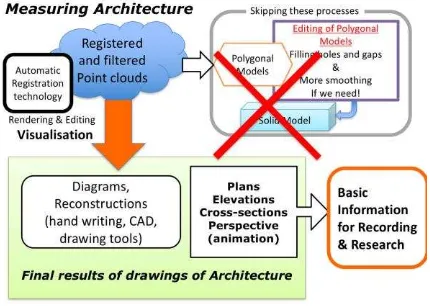
interest archaeologists, and focused on the images created from the meta-data simply aligned using a tool that extended automatic feature-matching algorithm and a popular renderer that can provide graphic results (figure 1).
Figure 1. The conceptual image of a case study in this paper
2. TECHNICAL BACKGROUND
The field survey involved many different researchers, including archaeologists, architects, engineers and historians, so primary survey data was considered the most complete and accessible object have both tested their views by fieldwork and excavation,
and would revise their current views if confronted by evidence which did not support them.
Raw data covering hundreds of square meters, which can be firstly provided to archaeologists, resulting in a few terabytes of data, could be unwieldy if read into memory on an average instead, the most preferred data source for reprocessing, which could include tasks such as realignment of scans, (Linsen, 2001). Because no classification or filtering process will be entirely accurate, manual editing of the point cloud could classification is an essential step in the post-processing in laboratory to create polygonal models, (Mills and Andrews, 2011). Consequently total post-processing times were significantly longer and the classification relies heavily on the experience of the operator.
Again, how can engineers provide images, which make a contribution of recording and researching by archaeologists, at early stage of the processing, not after several weeks?
Full automatic registration technology of point clouds is the key to provide those images, which can be share with archaeologists and engineers at the site. Some development of this technology is proceeding these 10 years, (Akca, 2003a) and (Makadia et al., 2006a), and commercial software is available now.
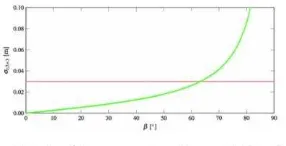
First of all, the range reliability of estimates of the scanned data improves as incidence angles as seen on Figure 2, and we put the scanner along a distance from the object of 2 -3 m to avoid scanning at an incidence angle of more than 60 degree. Secondary, we organized ordered scans providing the similarity to the neighboring scans for a successive pair-wise registration as possible as we can (Figure 3). Since, by automatic registration algorithm, local feature can be extracted from either acquired 3D point clouds (Bienert and Maas, 2009a) or 2D images derived from the 3D point clouds, (Dold and Brenner, 2004a) and (Dold and Brenner, 2006a).
Figure 2. The range reliability of estimates of the scanned data ©Springer International Publishing Switzerland 2016 [M. Weinmann, Reconstruction and Analysis of 3D Scenes
From Irregularly Distributed 3D Points to Object Classes, Karsruhe, 2016, Fig. 2.8]
The following is a case study of the images, which immediately created from point cloud data skipping post-processing and make some contribution to the research on archaeology at Ostia. Each point cloud is automatically registered using coarse registration, which only provides a coarse, but fast initial
estimate of the transformation between two point clouds, and then by the fine registration this initial estimate is refined in order to recover the transformation as accurately as possible.
Figure 3. The diagram of merging the Terme del Mitra using full automatic registration technology of point cloud
3. ADVANTAGES OF IMAGES CREATED FROM
POINT CLOUD DATA
Some laser scanners use a similar form of technology, knowing
as ‘time-of-flight’, to that of total stations. Generally speaking, a laser scanner does not provide any greater accuracy in recording than a total station, but it can produce a much more detailed representation. A total station requires two points to measure: a machine and reference points. New measured and recorded points result from the distance from the machine and angle with the reference point. To create an image the machine will join structures which cannot be seen with the human eye.
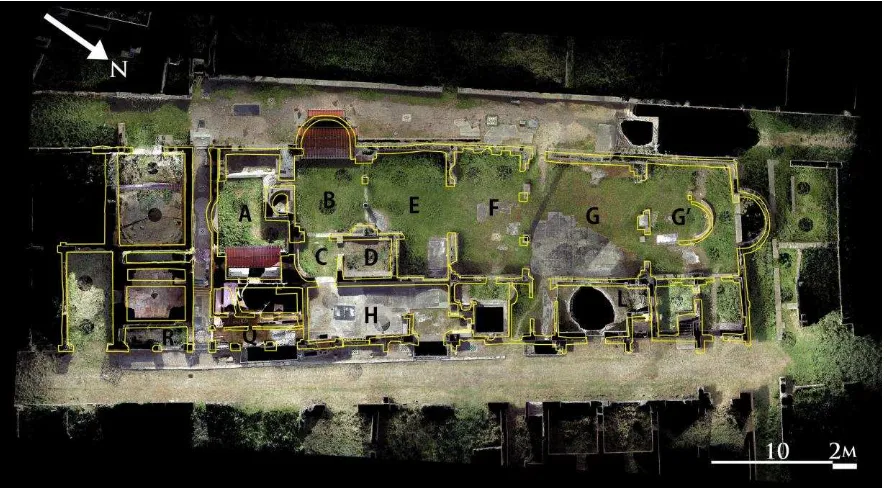
Figure 4 is a plan of the Baths of Mithras at Ostia, recorded by Nielsen and Schioler published in 1980, and figure 5 is the laser scanned image of the same building (Figures 4 and 5). We created an overlapping image of laser scanned image with a
1980’s drawing. Although Nielsen and Schioler’s plan is quite
accurate, they did not observe the subtle curves in the walls that have been detected in the laser scan.
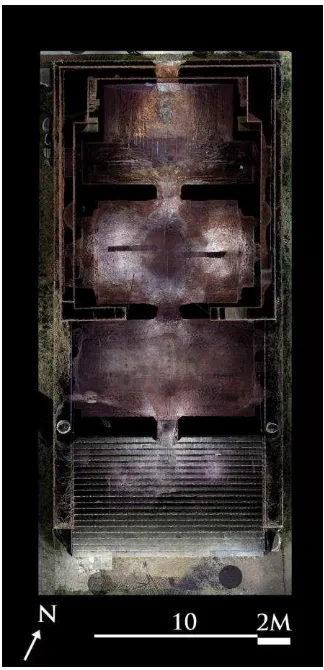
The underground service area whose plan was also published by Nielsen and Schioler, but unfortunately includes some errors comparing with the result of laser scanning, contains several furnaces, a large water-boiler, and a well with water-lifting devices, as seen in overlapped image with laser scanned data (Figures 6 and 7).
Figure 4. The Baths of Mithras with lables on rooms and network Figure 6. The basement with the drain system © Analecta Romana Instituti Danici © Analecta Romana Instituti Danici [I.Nielsen & T.Schioler, The Water System in the Baths of [Nilsen, 1980, fig 4] Mithra in Ostia, in:Analecta Romana Institute Danici, vol.9, 1980,fig 2]
Figure 5. The overlapping image of the ground floor of the Terme del Mitra
Figure 7. The overlapping image of the basement of the Terme del Mitra
The plans, which are recorded by Albo published in 2002, show the Capitolium which was constructed in Hadrian period, (Albo, 2002a). This temple building has mainly two spaces; one is the Cella which is sanctuary surrounded large walls upper floor and the other is the magazine which is accessed from behind of this building on the ground floor.
In 2015, 5 separate point clouds are collected by laser scanning the inside walls of the Cella of the Capitolium in Ostia they can be aligned to produce a single coherent point cloud as same as the case of the Terme del Mitra. We created the image of the Cella and overlapped the trace of Albo’s plan on this image (Figure 8). Through this overlapping image, we can see that the outline of the drawing which was published by Albo is accuracy but the front right wall of Cella and two walls next to the stairs are slightly different from those of point cloud data.
Figure 8. The overlapping image of the Cella
4. SOME CONSIDERATION OF THE CONSTRUCTION
PROCESS OF ROMAN
4.1 Orthographic Images of Plans and Cross Sections
4.1.1 Capitolium
Just as the introduction of the total station was a massive innovation in archaeological practice in 1970s and 1980s, laser scanning has the potential for the same impact. Point cloud technology allows us to view to the various floors of buildings in plan at the same time by making certain areas transparent, so as to produce unobtainable images from conventional survey.
On the cross sections in Figures 9 and 10, the structure of this high-raised building was mainly divided onto two proccess of the platform and the Cella. The platform includes four bays, of which the south bay supports the entrance steps. The partition walls between bays are strictly aligned with the walls of the Cella above and this fact reveals that weight of the wall above was mainly supported by the partition walls.
In addition, we created detailed plan of the Capitolium showing both the ground magazine inside the platform and the Cella of the Capitolium and the walls of the Cella were built above the walls forming the platform (Figure 11). However, we can see that the walls which partition the rooms of magazine on the ground floor and the front wall of Cella are on slightly different alignments, possibly indicating the mistakes by the Hadrian builders. Actually the left front wall of the Cella does not make a right angle to the side wall. In the north bay of the magazine, the depth is slightly shorter than that of the middle bay and this shortness could be attributed to those mistakes.
Such images make it possible to analyse the structure in similar way to a doctor diagnosing a patient from an x-ray.
Figure 9. A cross section of the Capitolium in front view
Figure 10. A cross section of the Capitolium in side view
Figure 11. The Cella and the magazine of point cloud data
4.1.2 Terme del Mitra
Figure 12. A cross section of the Terme del Mitra
Figure 13. A cross section of Mithreum
Figure 14. The overlapping image of the ground and underground floor of the Terme del Mitra
Figures 12 and 13 are images created from 3 dimensional data collected by a laser scanner in the Baths of Mithras. Of course, the results of laser scanning can include unavoidable errors, such the cross-section of this coherent point cloud, which is 1.20mm thick, a relatively small for a margin of error. Figure 12 is the cross-section of the Baths of Mithras, of which the underground was installed in the late 2nd or early 3rd century, while Figure 13 is a cross-section of a Mithraeum of the Baths, (Nielsen and Schioler, 1982a).
On the overlapping image of the underground rooms with the walls on the ground in Figure 14, in the area in red, the walls of underground structure are completely on the alignment of the outward face of ground walls above, while the underground
walls belongs to the area in blue are on slightly different alignment. In the area in blue, its underground part is roughly aligned with inward face of the ground wall above. The types of construction process can be reconstructed.
Type I: Firstly, the foundation trench has been dug down to the floor level of the basement. Secondary the whole structure was constructed on that level. Probably the buildings existed on the ground had been demolished before that construction.
Type II: Firstly, the foundation trench has been dug down avoiding the existing walls on the ground. Secondary the underground rooms were covered with vaults.
Figure 15. The axonometric view of the type I
Figure 16. The axonometric view of the type II
Additionally the tunnels in the area pained in yellow were independently constructed connecting the existing rooms.
The construction work of the many elements associated with Roman bath, such as water pipes, furnaces, and heating systems, service tunnels were hidden underground, beneath the floors of Rooms H, I, and L and the pedestrians at the east front of the building (figures 4, 5 and 7). While the underground corridor giving access to the western part and Mithraeum with vaulted ceilings, was built on the low ground dug around the existing building and covered with a new floor. The rooms of western part including the Mithraeum ware vaulted.
By creating such digital models, we are able to further our understanding as to how and why these buildings were constructed, which can in turn provide us with greater an insight into the minds of the Roman architects and builders.
4.2 Orthographic Images of Elevations
4.2.1 Capitolium
Point cloud data with RGB can provide more information about the material and texture of the surface, and we are able to render the images in high-resolution using software. By using a qualitative procedure of image mapping, this allows us to employ a more 'objective' methodology and create a final product that is incredibly detailed. In figure 17 of the Cella of the Capitolium in Ostia, the large bricks forming the levelling courses which are also called ‘bonding courses’ are visible, (DeLaine, 1997a). Not only on the plan, but also the elevation allow us the new information about the building phasing.
Figure 17. Levelling courses on the back wall of the Cella
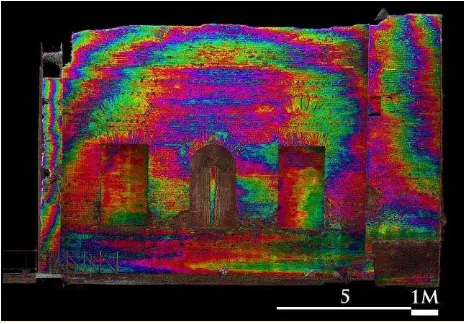
Plane mapping is a useful tool for analysing the unevenness of a surface, allowing us to see almost indiscernible changes in projections. Figures 18, 19 and 20 are images of the inside wall of the Cella, plane mapped in hue depending on the projection of the surface (20mm from violet to blue). We can not only view the boundary between the different phases of the construction work, but can also identify that the levering courses is not relevant to the construction process.
Figure 18. Plane mapping image: Inside surface of the back wall of the Cella
Figure 19. Plane mapping image: Inside surface of the right wall of the Cella
Figure 20. Plane mapping image: Inside surface of the left wall of the Cella
Plane-mapping images of the back wall of the Capitolium identifies the surface was inclined above the middle with a precise measurement of approximately 120 mm (Figure 18). Since on the outside of the back wall, the inclination inwards is not observed, and this means that the back wall increases the thickness as to the upper half. Of course, several cracks on the walls could cause that inclination after the construction. On the side walls, their surfaces are faithfully inclined with measurement of 60 mm on the west and 100 mm on the east inward to narrow the span between side walls at the joint of the adjacent walls (Figures 19 and 20).
The curved surfaces of the side walls of the Cella furnish the some opportunity to study the normally invisible structure of the ancient buildings and other very interesting features inside the Cella of the Capitolium as seen in Figure 21.
Figure 21. The shape-emphasized perspective drawing of the Cella of the Capitolium
4.2.2 Terme del Mithra
Plane mapping tool puts more information on the images of point cloud data as we described above. In the Terme del Mithra unearthed in 1939-1940, the reconstruction work spending the time more than 70 years, at which the original material excavated has been sometimes used, is difficult to be identified. Plane mapping allows au to see the different level of the objects. On the images of the ceiling of the basement of Figure 22, which coloured with violet and blue having a 10 cm difference in height, a circle is slightly higher than other parts. This means that the circle had been previously a hole and filled with original material later.
Figure 22. Plane mapping image: The west underground ceiling
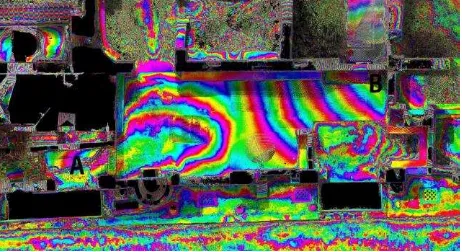
Plane-mapping also allows us to create contour lines (Figure 23, violet and blue having a 5cm difference in height), such as in this image of the ground floor. Judging from these contour lines, the bedding of the mosaic floor was deliberately sunken by 15cm, providing a smooth flow of water from the surface towards the sewer B, and the water was probably preserved for two laundries below, (Nielsen and Schioler, 1982a). As no threshold was found between these rooms and the adjoining toilet A, which has contours lines sloping up towards the mosaic floors, it appears that the water was drained into the toilet from this room as well.
Figure 23. Plane mapping image: The mosaic in room H
Throughout this paper, the benefits of a visualization of point cloud data in the light of the construction process have been made clear, both as they affect the underground building of the Terme del Mitra and the Capitolium, and as they contribute to our understanding of Roman building practice.
5. CONCLUSION
Having the data in widely used formats, such as JPG, TIFF and PNG for two dimensional images and PTX and XYZ in three dimensional images, they have been easy to distribute to colleagues and other researchers, and could be used to enhanced understandings and provide new perspectives of existing sites.
ACKNOWLEDGEMENTS
The fieldworks in Ostia is a part of History of Architecture as Reverse-Engineering (director Prof. Yoshiki HORI in Kyushu University), which is financed by Japan Society of Promotion of Science (J.S.P.S.) from April in 2013 to March in 2016. The authors would like to thank the Soprintendenza Speciale per i Beni Archeologici di Roma, Ostia Section, notably P. Germoni and M. Sangiorgio, for permission to carry out this work, and support on site at Ostia.
REFERENCES
Albo, C., 2002a. Il Capitolium di Ostia : alcune considerazioni sulla tecnica edilizia ed ipotesi ricostruttiva. Mélanges de l'Ecole française de Rome. Antiquité no. 114, 1, Rome, pp. 363-390.
Barber, D. and J. Mills, J. (revised by Mills, J and Andrews, D), 2011. 3D Laser Scanning for Heritage (second edition) Advice and guidance to users on laser scanning in archaeology and architecture, Swindon
Bienert, A., and Maas, H. G., 2009a. Methods for the automatic geometric registration of terrestrial laser scanner point clouds in forest stands. International archives of the photogrammetry, remote sensing and spatial information sciences, 38(part 3), W8.
DeLaine, J., 1997a. The baths of Caracalla. A study in the design, cosntruction and economics of large-scale building projects in imperial Rome, Journal of Roman Archaology, 25, Portsmouth, pp.143-145
Devrim, A. K. C. A., 2003a. “Full Automatic Registration of
Laser Scanner Point Clouds”. Optical, 3, Zurich, pp.22-25.
Dold, C., and Brenner, C., 2004a. Automatic matching of terrestrial scan data as a basis for the generation of detailed 3D city models. International Archives of Photogrammetry, Remote Sensing and Spatial Information Sciences, 35(B3), 1091-1096.
Dold, C., and Brenner, C., 2006a. Registration of terrestrial laser scanning data using planar patches and image data. International Archives of Photogrammetry, Remote Sensing and Spatial Information Sciences, 36(5), 78-83.
Linsen, L., 2001. Point Cloud representation, Univ., Fak. für Informatik, Bibliothek ,Karsruhe
Makadia, A., Patterson IV, A. and Daniilidis, K., 2006a. Fully automatic registration of 3D point clouds. In Computer Vision and Pattern Recognition, 2006 IEEE Computer Society Conference on (Vol. 1, pp. 1297-1304). IEEE, Philadelphia
Nielsen, I. and Schioler, T., 1980a. The Water System in the Baths of Mithras in Ostia. Analecta Romana Instituti Danici 9, pp. 149-159+Plate
Weinmann, M. 2016. Reconstruction and Analysis of 3D Scenes From Irregularly Distributed 3D Points to Object Classes, Karsruhe