Intervention Study of Home Insulation Retrofit and Blood Pressure
for the Prevention of Cardiovascular Diseases
February 2019
Wataru Umishio
A Thesis for the Degree of
Ph.D. in Engineering
Intervention Study of Home Insulation Retrofit and Blood Pressure
for the Prevention of Cardiovascular Diseases
February 2019
Graduate School of Science and Technology
Keio University
-Abstract-
Abstract of Ph.D. Dissertation
Intervention Study of Home Insulation Retrofit and Blood Pressurefor the Prevention of Cardiovascular Diseases
Cardiovascular diseases (CVDs), the world's leading cause of death, cause 17.9 million deaths each year. Mortality due to CVDs rises in winter, a phenomenon known as "Excess winter mortality (EWM)". The rise is especially sharp in cold homes. EWM is partially explained by cold exposure-induced hypertension. Nevertheless, existing countermeasures for the prevention of hypertension and CVDs place emphasis only on improving lifestyle habits. While diet, physical activity, alcohol consumption, and smoking are included in existing policies, housing environment is not because the scientific evidence is insufficient. Therefore, we aim to examine the preventive effects of improving housing environment on the incidence of CVDs. In particular, this study focuses on the relationship between thermal environment inside houses and blood pressure, which is a widely used risk factor for CVDs. This dissertation consists of the 8 chapters summarized below.
Chapter 1 describes the background, motivations and objectives of the study.
Chapter 2 summarizes domestic and foreign policies and previous research on housing and health.
Chapter 3 introduces the field surveys which became the basis of the nationwide survey in the next chapter. The results from the field surveys reveal 1) the impact of bedroom temperature on blood pressure variability in the early morning, and 2) the causal correlation between a rise in room temperature and a drop in blood pressure when subjects moved to houses with high thermal insulation. Issues associated with implementing the nationwide survey are summarized according to these results.
Chapter 4 outlines the before-and-after insulation retrofit surveys conducted throughout Japan (SWH survey: Smart Wellness Housing survey). The research question, study design, intervention, and measurement items are described, and the ethical issues and online registration are summarized. Furthermore, the number of participants and baseline characteristics of participants are summarized.
Chapter 5 describes findings on 1) the relationship between home blood pressure and room temperature, and 2) the sensitivity of home blood pressure to changes in room temperature, obtained in the baseline survey (before insulation retrofit). In addition, the nationwide survey was used to identify the areas with low indoor temperatures and the attributes of the residents who live in cold homes.
Chapter 6 describes the results of comparative analysis between the "insulation retrofit group" and the "control group". The results were used to determine the causal relationship between a drop in blood pressure and insulation retrofit intervention.
Chapter 7 shows the results of comparative analysis of health exam data between warm houses (indoor temperature ≥18°C) and cold houses (indoor temperature <18°C). A cross-sectional analysis is used to examine whether the risk of "arteriosclerosis" and "electrocardiogram abnormality", indices strongly related to CVDs, increases in cold houses.
Chapter 8 summarizes the achievements of the present research. In addition, this chapter suggests the need to verify the long-term health effects of housing environment using a long-term cohort study.
-要旨-
論文要旨
-循環器疾患の予防に向けた
住宅の断熱改修と家庭血圧の関連に関する介入研究-
循環器疾患は、毎年約1,790万人が命を落とす世界の死因第一位の病である。循環器疾患
による死亡は冬季に増加し、「Excess Winter Mortality (EWM)」と称される。EWMは特に寒
冷な住宅で顕著であり、寒冷への曝露に伴う血圧上昇によりその一部が説明できる。にも かかわらず、現状の高血圧及び循環器疾患対策は生活習慣改善のみに重点が置かれている。 食事や運動、飲酒、喫煙の対策は政策に取り入れられている一方で、科学的エビデンスが 不足している住環境は取り入れられていない。従って、住環境改善による循環器疾患予防 効果を検証することを本研究の目的とする。特に循環器疾患の危険因子とされ、測定が広 く普及している「血圧」に焦点を当て、「住宅内温熱環境と血圧の関係」の分析を行う。本 論文は、以下に示す全8章から構成される。 第1章では、序論として、本研究の背景と意義、目的を示す。 第2章では、住宅と健康に関する国内外の政策及び先行研究についてまとめる。 第 3 章では、第 4章以降の全国調査のベースとなった実態調査を紹介する。結果の一部 として、1) 寝室の室温が早朝血圧変動に及ぼす影響、2) 高断熱住宅への転居による室温上 昇と血圧低下の因果関係、の 2 点に触れ、全国調査を実施するにあたっての課題点を整理 する。 第 4 章では、日本全国で実施した住宅の断熱改修前後調査(スマートウェルネス住宅研 究)の概要を述べる。リサーチクエスチョン、調査デザイン、介入内容、調査項目につい て解説するとともに、倫理的問題、調査のオンライン登録について触れる。更に、調査対 象者数並びにベースライン調査時点の調査対象者の属性を整理する。 第 5章では、断熱改修前のベースライン調査から得られた成果である、1) 家庭血圧と室 温の関係、2) 室温変化に対する家庭血圧の感度分析、の2点をまとめる。加えて、全国調 査の強みを活かし、寒冷な住宅で暮らしている地域や居住者の属性(ハイリスク居住者) を明らかにする。 第6章では、断熱改修を行った「断熱改修群(介入群)」と、断熱改修を行わなかった「対 照群」の比較分析により、断熱改修の介入による血圧低下の因果関係の検証を行う。 第7章では、温暖な住宅(室温18℃以上)と寒冷な住宅(室温18℃未満)の比較分析を 行い、健康診断データから得られた循環器疾患との関連が強い指標である「動脈硬化」や 「心電図の異常」が寒冷な住宅で助長されるのか、を断面分析により検討する。 第 8 章では、本研究の成果を総括するとともに、長期コホートスタディにより、住環境 による健康影響を長期的な視点で検証する必要性を述べる。
-Contents-
Intervention Study of Home Insulation Retrofit and Blood Pressure
for the Prevention of Cardiovascular Diseases
-
Contents
-
List of figures ... 1 List of tables... 4 Abbreviations ... 6 Acknowledgements ... 9 Chapter 1 | Introduction ... 151.1 Efforts to prevent cardiovascular diseases and hypertension around the world ... 17
1.2 Efforts to prevent cardiovascular diseases and hypertension in Japan ... 21
1.2.1 Medical and nursing care financial crisis ... 21
1.2.2 Policies for preventing cardiovascular disease ... 28
1.2.3 Present status and efforts for preventing hypertension ... 29
1.3 Excess winter mortality ... 31
1.4 Necessity of improving the thermal environment inside houses in Japan ... 34
1.5 Hypotheses on the effects of cold exposure on cardiovascular events ... 37
1.6 Purpose of this research and the structure of this thesis ... 38
Chapter 2 | Domestic and international trends and research on housing and health ... 43
2.1 Efforts to prevent health injuries due to cold ... 45
2.1.1 Efforts in the UK ... 45
2.1.2 Efforts in New Zealand ... 47
2.1.3 Efforts in Japan ... 49
2.2 Review of previous research on housing and health ... 50
2.2.1 Clinical trials related to housing and health ... 50
2.2.2 Clinical trials related to housing and hypertension/cardiovascular disease ... 53
Chapter 3 | Field surveys on housing thermal environment and blood pressure ... 63
3.1 Outline of field surveys on housing thermal environment and blood pressure ... 65
3.2 Influence of indoor temperature on morning surge in blood pressure ... 72
3.2.1 Objective ... 72
3.2.2 Data analysis ... 72
3.2.3 Influence of indoor temperature on morning surge ... 73
3.3 Causal relationship between rise in room temperature and decrease in blood pressure ... 76
3.3.1 Objective ... 76
3.3.2 Data analysis ... 76
3.3.3 Comparison of attributes before and after relocation ... 77
3.3.4 Comparison of indoor temperature before and after relocation ... 80
3.3.5 Comparison of blood pressure before and after relocation ... 81
3.4 Summary of chapter 3 ... 84
Chapter 4 | Outline of the before and after insulation retrofit survey in Japan (SWH survey) ... 85
4.1 Introduction ... 87
4.2 Method ... 88
4.2.1 Ethics ... 88
4.2.2 Study design ... 88
4.2.3 Recruitment ... 89
4.2.4 Sample size determination ... 89
4.2.5 Intervention ... 89
4.2.6 Measurements ... 90
4.2.7 Statistical analysis ... 93
4.3 Results ... 94
4.3.1 Participant numbers and characteristics ... 94
4.3.2 Baseline characteristics of participants ... 96
4.3.3 Baseline characteristics of homes ... 99
4.4 Discussion ... 101
4.4.1 Present status of housing in Japan ... 101
-Contents-
Chapter 5 | Relationship between indoor temperature and home blood pressure ... 105
5.1 Introduction ... 107
5.2 Method ... 108
5.2.1 Study design ... 108
5.2.2 Area classification in Japan ... 108
5.2.3 Home blood pressure and other measurements ... 109
5.2.4 Statistical analysis ... 110
5.3 Results ... 112
5.3.1 Blood pressure indices used for analysis ... 112
5.3.2 Patterns of participation in home blood pressure measurement ... 113
5.3.3 Comparison of home blood pressure between summer and winter ... 114
5.3.4 Attributes of participants in the winter survey ... 117
5.3.5 Relationship between indoor temperature and home blood pressure in winter ... 119
5.3.6 Sensitivity analysis of the effect of indoor temperature on home blood pressure ... 125
5.3.7 Identification of residents living in low room temperatures ... 127
5.4 Discussion ... 130
5.4.1 Nonlinear relationship between indoor temperature and blood pressure ... 130
5.4.2 Impact of the living room and bedroom temperature disparity ... 131
5.4.3 Recommendations for home temperature ... 131
5.4.4 Residents at high risk of hypertension and cardiovascular disease ... 132
Chapter 6 | Effect of insulation retrofit on home blood pressure ... 133
6.1 Introduction ... 135
6.2 Method ... 136
6.2.1 Procedures ... 136
6.2.2 Statistical analysis ... 138
6.3 Results ... 139
6.3.1 Attributes of participants in the intervention group and control group ... 139
6.3.2 Changes in indoor temperature due to insulation retrofit ... 141
6.3.3 Causal relationship between insulation retrofit and home blood pressure ... 143
6.4 Discussion ... 145
6.4.1 Previous intervention studies on housing and blood pressure ... 145
Chapter 7 | Relationship between indoor temperature and biomarkers of CVD... 149 7.1 Introduction ... 151 7.2 Method ... 151 7.2.1 Measurements ... 151 7.2.2 Statistical analysis ... 153 7.3 Results ... 154
7.3.1 Relationship between health exam data and self-reported hospital visits ... 154
7.3.2 Comparison of health exam data between warm houses and cold houses ... 155
7.4 Discussion ... 159
7.4.1 Ambient temperature and biomarkers of cardiovascular disease ... 159
7.4.2 Cholesterol level and risk of cardiovascular disease ... 159
7.4.3 Cold homes and arteriosclerosis ... 160
Chapter 8 | Conclusions and future studies ... 161
8.1 Relationship between indoor temperature and home blood pressure ... 163
8.2 Identification of residents living in low room temperature environments ... 163
8.3 Effect of insulation retrofit on home blood pressure ... 164
8.4 Relationship between indoor temperature and biomarkers of CVD ... 164
8.5 Conclusions ... 165
8.6 Future prospects ... 168
References ... 173
Publications ... 197
Appendix ... 209
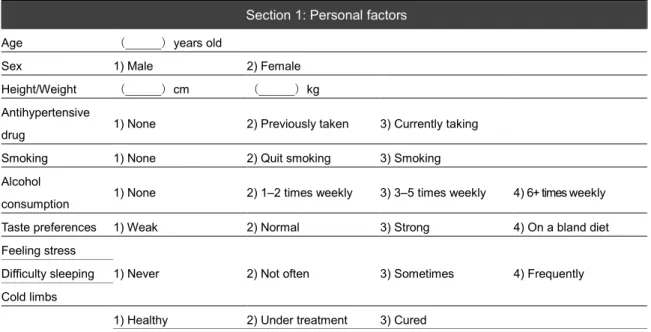
Appendix 1: Questionnaire for residents ... 211
Appendix 2: Diary for residents ... 234
List of figures
|
1List of figures
Chapter 1
Fig.1-1 | Global age-standardized death rates for males versus females, 2015 ... 17
Fig.1-2 | WHO and ISH cardiovascular risk prediction chart ... 18
Fig.1-3 | (a) Stroke mortality rate in each decade of age versus usual SBP. (b) Ischaemic heart disease mortality rate in each decade of age versus usual SBP... 20
Fig.1-4 | Main factors that contribute to the development of high BP and its complications ... 20
Fig.1-5 | Aging rate of countries around the world ... 21
Fig.1-6 | Prospects for medical and nursing care expenses in Japan ... 21
Fig.1-7 | Breakdown of medical costs by age and disease ... 22
Fig.1-8 | Breakdown of diseases that cause patients to require nursing care ... 22
Fig.1-9 | Age- and sex-adjusted incidence of stroke by type according to BP category ... 23
Fig.1-10 | Risk assessment chart for 10-year probability of death due to all CVDs ... 24
Fig.1-11 | Stroke and coronary artery disease risks according to morning or evening home systolic blood pressure categories ... 25
Fig.1-12 | HSBP and incidence rate of stroke and CAD events during follow-up ... 26
Fig.1-13 | Relationship between the primary end point (CVD events) and SBP divided into 9 categories ... 27
Fig.1-14 | Hierarchical structure of Health Japan 21 (the second term) for prevention of CVDs ... 28
Fig.1-15 | Estimated number of hypertensive patients in Japan ... 29
Fig.1-16 | Coefficient of seasonal variation in mortality in Europe ... 31
Fig.1-17 | Seasonal fluctuation in CVD mortality in cold and warm homes ... 31
Fig.1-18 |Coefficient of seasonal variation in mortality by prefecture in Japan ... 32
Fig.1-19 | Seasonal fluctuation in mortality inside houses by disease ... 32
Fig.1-20 | Conceptualization of community-based integrated care systems in 2025 ... 33
Fig.1-21 | Adiabatic level of existing dwellings in Japan ... 34
Fig.1-22 | Standards for the average heat transmission coefficient for the outer skin (UA-value) of the main countries ... 35
Fig.1-23 | Standards for the heat transmission coefficient for windows (UW-value) of the main countries ... 35
Fig.1-24 | Annual national average of residential energy consumption of the main countries ... 36
Fig.1-25 | Synergistic resonance hypothesis on blood pressure variability and the effects of cold .... 37
Fig.1-26 | Hypothesis of Ph.D. dissertation ... 38
Fig.1-27 | Suggested hierarchical structure for prevention of CVDs including housing ... 39
Chapter 2
Fig.2-1 | The Cold Weather Plan for England and cold weather alert system ... 46
Fig.2-2 | Fluctuations in systolic blood pressure, mean skin temperature, bed temperature and indoor temperature ... 53
Fig.2-3 | Fluctuation of living room temperature, physical activity, and SBP ... 54
Fig.2-4 | Kaplan-Meier survival estimates for the circulatory subcohort ... 57
Chapter 3 Fig.3-1 | Surveyed areas, periods and number of participants of field surveys in 2012–15... 65
Fig.3-2 | Series of briefing sessions for field surveys ... 66
Fig.3-3 | Circadian rhythm of blood pressure in survey case A ... 71
Fig.3-4 | Time-specific onset number of cardiovascular diseases for 2-h intervals ... 71
Fig.3-5 | Location, period and number of participants of the field survey in 2012 ... 72
Fig.3-6 | Morning surge on days with the highest/lowest temperature in each room (left). Morning surge on days with the highest/lowest bedroom temperature according to time period (right) ... 74
Fig.3-7 | Fluctuations in bedroom temperature before and after getting out of bed ... 75
Fig.3-8 | Fluctuations in systolic blood pressure before and after getting out of bed ... 75
Fig.3-9 | Location, period and number of participants of field surveys in 2014–15 ... 76
Fig.3-10 | Conditions of each room before and after relocation ... 79
Fig.3-11 | Fluctuations in indoor and outdoor temperature before and after relocation ... 80
Fig.3-12 | Comparison of temperatures before and after relocation ... 81
Fig.3-13 | Living room temperature and morning SBP of each subject before and after relocation ... 82
Fig.3-14 | Average blood pressure in the room temperature increased/decreased groups before and after relocation ... 83
Fig.3-15 | Relationship between changes in living room temperature and BP following relocation .. 83
Chapter 4 Fig.4-1 | Overview of the before and after insulation retrofit survey in Japan (SWH survey) ... 88
Fig.4-2 | Flowchart of recruitment of participants for the Smart Wellness Health survey in winter ... 94
Fig.4-3 | Flowchart of recruitment of participants for the Smart Wellness Health survey in summer ... 95
Fig.4-4 | Average (left) and minimum (right) living room temperature at home ... 99
Fig.4-5 | Average (left) and minimum (right) bedroom temperature during sleep ... 100
List of figures
|
3Chapter 5
Fig.5-1 | Residential area of participants conducting home blood pressure measurements ... 114 Fig.5-2 | Seasonal variation in home blood pressure and temperature ... 115 Fig.5-3 | Seasonal variation in home blood pressure and temperature in the stable/unstable living
room temperature groups ... 116 Fig.5-4 | Subject flow of valid samples ... 117 Fig.5-5 | Relationship between living room temperature and morning SBP ... 123 Fig.5-6 | Relationship between living room/bedroom/changing room temperature and morning SBP .. 124 Fig.5-7 | Sensitivity analysis of changes to morning SBP due to changes in living room temperature ... 126 Fig.5-8 | Average living room temperature in the morning in each prefecture ... 127
Chapter 6
Fig.6-1 | Flow of participants through the before and after insulation retrofit study ... 137 Fig.6-2 | Changes in indoor/outdoor temperature throughout one day ... 141 Fig.6-3 | Indoor/outdoor temperature before and after intervention ... 142 Fig.6-4 | Average blood pressure of intervention and control groups before and after intervention .... 143 Fig.6-5 | Preventive effect of housing improvement on cardiovascular diseases ... 147
Chapter 7
Fig.7-1 | Changes in indoor/outdoor temperature throughout one day ... 155
Chapter 8
Fig.8-1 | A new concept of “life-environment disease” for hypertension and cardiovascular disease .... 166 Fig.8-2 | Overview of the long-term cohort study in Japan (SWH survey) ... 168 Fig.8-3 | Synergistic resonance hypothesis on blood pressure variability and the chronic effects of cold .. 169 Fig.8-4 | Analogy between building and human circulation systems ... 170 Fig.8-5 | Modeling the human circulatory system by applying methods of the building circulation
List of tables
Chapter 1
Table 1-1 | Publications focusing on prevention of cardiovascular diseases by WHO ... 18
Table 1-2 | Lifestyle modification items for prevention of hypertension ... 30
Table 1-3 | Recommended grade for prevention of hypertension ... 30
Table 1-4 | Evidence level in medicine ... 30
Table 1-5 | Recommendations for minimum room temperature ... 36
Chapter 2 Table 2-1 | Profiles of potential health and safety hazards in dwellings in HHSRS ... 45
Table 2-2 | Healthy Housing Index hazards and odds ratios of reported injuries over three years ... 47
Table 2-3 | Cost benefit analysis of the Warm Up New Zealand: Heat Smart Programme ... 48
Table 2-4 | Categories of health and safety hazards in CASBEE Housing Health Checklist ... 49
Table 2-5 | Summary of findings on the effectiveness of clinical trials ... 50
Table 2-6 | Covariate-adjusted associations between "treatment group" membership (heating recipients vs comparison group households) and health outcomes (2002–06) ... 55
Table 2-7 | Changes in blood pressure in intervention and control group ... 56
Table 2-8 | Adjusted cox proportional hazards model results: circulatory subcohort ... 57
Table 2-9 | Summary of studies on ambient temperature and blood pressure in adults ... 58
Table 2-10 | Multilevel linear regression analysis of the association between ambulatory blood pressure and temperature ... 60
Table 2-11 | Regression analyses on the relationship between indoor temperature and SBP (Woodhouse et al.) ... 61
Table 2-12 | Regression analyses on the relationship between indoor temperature and SBP (Kunutsor and Powles) ... 61
Table 2-13 | Models for mean SBP quantifying the effects of season and temperature ... 62
Chapter 3 Table 3-1 | Outline of actual measurements in 2012–15 ... 67
Table 3-2 | Specifications of instruments used for actual measurements in 2012–15 ... 68
Table 3-3 | Outline of questionnaire surveys for field measurements in 2012–15 ... 69
Table 3-4 | Part of the questionnaire contents for field measurements in 2012–15... 70
List of tables
|
5Chapter 4
Table 4-1 | Summary of subjective data collected in the Smart Wellness Housing survey ... 91
Table 4-2 | Summary of objective data collected in the Smart Wellness Housing survey ... 92
Table 4-3 | Specifications of instruments for actual measurements in the SWH survey ... 93
Table 4-4 | Characteristics of the participants in the baseline survey ... 97
Table 4-5 | Results of actual measurements in the baseline survey ... 98
Chapter 5 Table 5-1 | Area classification based on heating degree-day values ... 108
Table 5-2 | Relationship between home/clinic blood pressure and cardiovascular disease ... 112
Table 5-3 | Summary of the number of participants in home blood pressure measurements ... 113
Table 5-4 | Patterns of participation in home blood pressure measurements ... 113
Table 5-5 | Comparison of BP and CV of BP between summer and winter ... 115
Table 5-6 | Characteristics of participants in the baseline survey in winter ... 118
Table 5-7 | Multilevel model of the relationship between living room temperature and BP in the morning and evening ... 119
Table 5-8 | Multilevel model of the relationship between living room temperature and BP in the morning and evening (detailed models of Table 5-7) ... 120
Table 5-9 | Multilevel model of morning SBP ... 122
Table 5-10 | Average living room temperature in the morning for each personal attribute ... 128
Table 5-11 | Multilevel model of living room temperature in the morning ... 129
Chapter 6 Table 6-1 | Patterns of participation in home blood pressure measurements ... 137
Table 6-2 | Characteristics of participants in the intervention and control groups (mean ±SD) ... 139
Table 6-3 | Characteristics of participants in the intervention and control groups (number, %) ... 140
Table 6-4 | Effect of insulation retrofit on home blood pressure in the morning and evening ... 144
Table 6-5 | Estimation of decreases in CVDs due to decreases in average SBP ... 146
Chapter 7 Table 7-1 | Health exam items and standard ranges [181] ... 152
Table 7-2 | Relationship between health exam data and self-reported hospital visits ... 154
Table 7-3 | Health exam data of participants living in warm houses (≥12.5°C) and cold houses (<12.5°C) .. 156
Table 7-4 | Cold houses (<12.5°C) and odds ratio of being outside the standard range ... 156
Table 7-5 | Health exam data of participants living in warm houses (≥18°C) and cold houses (<18°C) ... 157
Abbreviations
General terms
ABPM Ambulatory blood pressure monitoring AIC Akaike’s information criterion
ANCOVA Analysis of covariance BMI Body mass index
BP Blood pressure
CAD Coronary artery disease CBP Clinic blood pressure CI Confidence interval CV Coefficient of variation CVD Cardiovascular disease DBP Diastolic blood pressure EWM Excess winter mortality HBP Home blood pressure
HDBP Home diastolic blood pressure HDD Heating degree-day
HDL High-density lipoprotein
HR Hazard ratio
HSBP Home systolic blood pressure IHD Ischemic heart disease LDL Low-density lipoprotein RCT Randomized control trial RH Relative humidity SBP Systolic blood pressure SD Standard deviation
SE Standard error
TempBr Bedroom temperature TempCr Changing room temperature TempLr Living room temperature TempIn Indoor temperature TempOut Outdoor temperature
Abbreviations
|
7Proper nouns
ACC American College of Cardiology AHA American Heart Association BRE Building Research Establishment
CASBEE Comprehensive Assessment System for Built Environment Efficiency CWP Cold Weather Plan
ESC European Society of Cardiology ESH European Society of Hypertension HHI Healthy Housing Index
HHSRS Housing Health and Safety Rating System
ICMJE International Committee of Medical Journal Editors ISH International Society of Hypertension
JNC Joint National Committee on Detection, Evaluation, and Treatment of High Blood Pressure
JSBC Japan Sustainable Building Consortium
MLIT Ministry of Land, Infrastructure, Transport and Tourism MHLW Ministry of Health, Labour and Welfare
NICE National Institute for Health and Clinical Excellence SWH Smart Wellness Housing
USA United States of America
UK United Kingdom
WHO World Health Organization
Acknowledgements
|
9Acknowledgements
|
11Acknowledgements
In carrying out this research, I was blessed with the cooperation and guidance of many individuals who are experts in the fields of built environmental engineering, medicine, and public health. I would like to take this opportunity to extend my gratitude to them.
Professor Toshiharu Ikaga of the Faculty of Science and Technology at Keio University was a constant inspiration to me over the seven years during which I was in the laboratory. In addition, he trusted me and provided me with many opportunities. I am grateful to him for giving me valuable experiences that I would not have been able to have elsewhere. I extend to you my deepest gratitude. When I was contemplating returning to the laboratory as a Ph.D. student, he very kindly sat down and talked to me. It was not an easy path, balancing my job and academic pursuits, but I believe that it was the best decision to take on the challenge of completing this doctoral program. I would like to continue to devote myself to what I have learned from Professor Ikaga; I look forward to your guidance and encouragement in the future.
I would like to thank Professor Akira Mita, Professor Yasue Mitsukura and Associate Professor Jorge Almazan for reviewing the manuscript and for providing very valuable suggestions for improving the quality of the research and the completeness of the manuscript. I would like to take this opportunity to extend my gratitude to them.
Professor Shuzo Murakami, Professor Emeritus of the University of Tokyo, Former Professor of Keio University and President of the Institute for Building Environment and Energy Conservation, taught me the importance of having curiosity and ambition as a researcher. His uncompromising attitude towards research is one on which I model my own attitude. Under my belief that "maintaining the status quo is equivalent to degeneracy," I would like to continue to emulate Professor Murakami’s ambition. I would like to take this opportunity to extend my gratitude to him.
I would like to thank Professor Kazuomi Kario of the Division of Cardiovascular Medicine, Department of Medicine, Jichi Medical University, and Professor Yoshihisa Fujino of the Institute of Industrial Ecological Sciences, University of Occupational and Environmental Health, for the kind advice they provided me, to improve my poor knowledge of medicine and public health. I believe the fact that I advanced analyses by seeking new results to enhance the meaningfulness of discussions with the professors was the driving force for assembling this doctoral dissertation. I thank these professors for the enthusiastic guidance they have provided, which has allowed me to engage in research whole heartedly. I would like to take this opportunity to extend my deepest gratitude to them. I look forward to your guidance in the future.
I would like to thank Lecturer Shintaro Ando of the Faculty of Environmental Engineering, University of Kitakyushu, for teaching me about the attitude of engaging in research and the behavior that one should have as a researcher. The days spent running around compiling data from the field studies conducted in Tosa Town and Yusuhara Town in Kochi Prefecture, as well as Yamaguchi Prefecture, remain unforgettable memories. The things he taught me and his words, which were kind yet stern at times, now form my foundation. Thank you very much. I would be grateful for your continued guidance.
I would like to thank Associate Professor Shun Kawakubo of the Faculty of Engineering and Design in Hosei University for providing consultation on my research theme, right from the start, when I joined the Ikaga Laboratory. I am glad that I could share the same time with him in the laboratory because I was deeply inspired by his enthusiasm and sincere efforts in his research. Thank you very much for your support. I would be grateful for your continued guidance.
I would like to thank the members of the Smart Wellness Housing Promotion Committee, the Research Planning Committee and the Investigative Analysis Committee, established under the Japan Sustainable Building Consortium, for providing valuable advice for the entirety of this research. In particular, we received a lot of advice that improved the quality of the research from Professor Takesumi Yoshimura, Professor Emeritus of the University of Occupational and Environmental Health; Professor Hiroshi Yoshino, Professor Emeritus of Tohoku University; Professor Kuniaki Otsuka, Professor Emeritus of Tokyo Women’s Medical University; Professor Tanji Hoshi, Professor Emeritus of Tokyo Metropolitan University; Associate Professor Tatsuhiko Kubo, Institute of Industrial Ecological Sciences, University of Occupational and Environmental Health; and Professor Masaru Suzuki, Department of Emergency Medicine, Tokyo Dental College Ichikawa General Hospital. We also received a great deal of general support from Mr. Masatsugu Aoki, Ms. Masayo Yoshida, Ms. Kaoru Tsuge, Ms. Chinami Kurihara, and Mr. Akiro Nagaoka of the Smart Wellness Housing Promotion Committee Secretariat. I would like to express my gratitude to them.
I would like to thank Professors Hiroto Izumi and Masako Yoneda, who are specially-appointed professors of the Keio Advanced Researched Centers, for looking after me not only in terms of my research, but also in terms of my private life. They shared stories about various fields based on their own vast experiences and provided me the opportunity to expand my horizons. I want to take this opportunity to show them my appreciation.
Acknowledgements
|
13 Significant support was also provided by everybody at Kajima Corporation, my place of employment. Thank you very much for agreeing to allow me to take on the challenge of being a Ph.D. student from the Architectural Design Division, an arrangement that is unprecedented. I would like to take this opportunity to express my deepest gratitude to them.Ms. Takako Suzuki and Ms. Miho Baba, the secretaries in the Ikaga Laboratory, were very helpful in general during my research activities. It is thanks to them that I have been able to dedicate my time to research. I would like to express my gratitude to them.
Joint researchers Mr. Hiroshi Kojima and Ms. Maki Ito, who handled the Smart Wellness Housing Survey, helped me in various aspects of the research. I learned a lot from these researchers, who had experience being company employees.
Those senior to me in the Ikaga Laboratory, who have already graduated, provided me with guidance regarding general laboratory activities and ways to advance my research from the time I joined the laboratory. In particular, my seniors on the research team, Mr. Takashi Shinozuka, Ms. Reina Yamamoto, and Ms. Mai Miura supported my research activities and laboratory life in every way. I am where I am today thanks to them. I would like to extend my gratitude to them all.
Ms. Sena Aoki, Ms. Takako Amemiya, Mr. Naoto Takayama, Mr. Masaki Takigami, and Ms. Megumi Yanagisawa, who were affiliated with the laboratory during my time there, provided me with support in many aspects of laboratory life. They taught me, despite me tending to keep my concerns to myself, the importance of trusting one’s colleagues.
I also received a lot of support from those who were junior to me in the laboratory. Ms. Chika Ushiro, Ms. Eri Honda, and Mr. Yusuke Nakajima, the juniors in the healthy housing team, always provided motivation to me in my research activities. In particular, Ms. Yukie Nakajima, through her vivid imagination provided me with flashes of insight and was always attentive and caring about my situation, being also a company employee. Thank you very much for your support.
Finally, I would like to extend my appreciation to my father, my mother, and my brother for warmly looking after me while I spent my days completing this research. I will never forget how you listened to me when I expressed that “I wanted to aim for a doctorate, while continuing to work in the company,” the positivity with which you discussed how to realize this with me, and how you worried about my health. I hope to show this feeling of appreciation not just in words, but also in my actions.
Although still in progress, I want to report here, along with my appreciation and gratitude to all associated personnel, that I have completed my doctoral dissertation. I intend to devote myself in the future, with new conviction, to reducing as many health injuries and accidental deaths in the household as possible.
Chapter 1
|
15Chapter 1
Introduction
Chapter 1
|
17Chapter 1 | Introduction
1.1 Efforts to prevent cardiovascular diseases and hypertension around the world
Cardiovascular diseases (CVDs) are the number one cause of death globally [1] (Fig.1-1). An estimated 17.9 million people died from CVDs in 2016, representing 31% of all global deaths. Of these deaths, 85% were due to heart attack and stroke[2]. Estimations predict that deaths due to CVDs will increase to 23.6 million in 2030[3], making prevention of CVDs an urgent issue.
Fig.1-1 | Global age-standardized death rates for males versus females, 2015 [1]
The World Health Organization (WHO) has issued various reports on the prevention of CVDs
(Table 1-1). These reports highlight four important risk factors for CVDs: (1) unhealthy diet, (2) physical inactivity, (3) tobacco use, and (4) harmful use of alcohol. These inappropriate lifestyle habits cause four intermediate risk factors: (1) hypertension (increase in blood pressure), (2) diabetes (increase in blood glucose level), (3) hyperlipidemia (increase in blood lipids), and (4) obesity (increase in body weight), which lead to CVDs. Based on these risk factors, the WHO depicted the 10-year probability of onset of CVDs in a risk chart (Fig.1-2). Additionally, in 2016, WHO launched the "Global Hearts Initiative" and campaigns to promote changes to improve lifestyle habits such as reducing salt intake (SHAKE[4]) and improving smoking habit (MPOWER[5]).
Communicable, maternal, neonatal, nutritional diseases
Non-communicable diseases
Injuries
Global age-standardized death rate (male) [-]
G lo ba l ag e-st an da rd iz e d de at h r at e (f em al e) [ -] 10-7 10-6 10-5 10-4 10-3 10-2 10-7 10-6 10-5 10-4 10-3 10-2
Ischaemic heart disease Cerebrovascular disease
COPD Lower respiratory infections
Road injuries FallsSelf-harm
Malaria
Breast cancer
Alcohol use disorders
Yellow fever Rheumatoid arthritis Oesophageal cancer HIV/AIDS Bladder cancer Interpersonal violence Mesothelioma Tracheal, bronchus, lung cancer
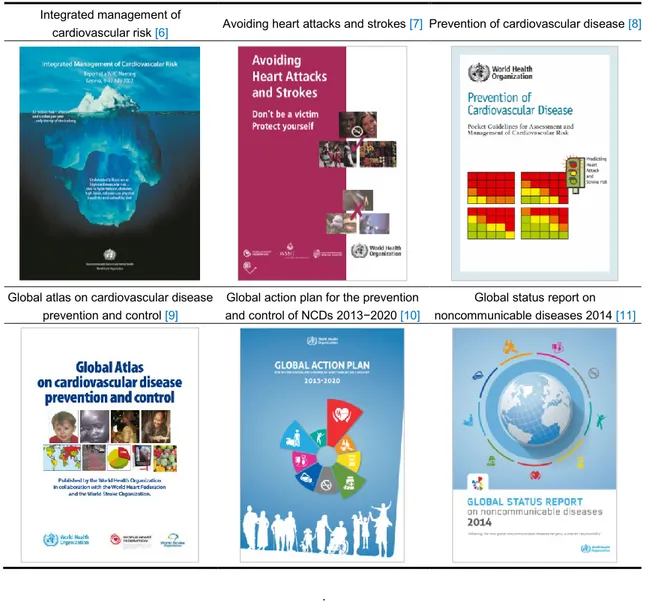
Table 1-1 | Publications focusing on prevention of cardiovascular diseases by WHO
Integrated management of
cardiovascular risk [6] Avoiding heart attacks and strokes [7] Prevention of cardiovascular disease [8]
Global atlas on cardiovascular disease
prevention and control [9]
Global action plan for the prevention
and control of NCDs 2013−2020 [10]
Global status report on
noncommunicable diseases 2014 [11]
People with diabetes
Age (years) 70 60 50 40 70 60 50 40
People without diabetes
Men Women
Non-smoker Smoker Non-smoker Smoker
Systolic blood pressure (mmHg) 180 160 140 120 180 160 140 120 180 160 140 120 180 160 140 120 Age
(years) Men Women
Non-smoker Smoker Non-smoker Smoker
Systolic blood pressure (mmHg) 180 160 140 120 180 160 140 120 180 160 140 120 180 160 140 120 <10% 10-19.9% 20-29.9% 30-39.9% 40-49.9% Risk level
Chapter 1
|
19 Our knowledge of the risks associated with CVDs has improved following advances from early research methods. In particular, the Framingham Heart Study [12], launched in 1948 in the town of Framingham, Massachusetts, in the eastern United States, is considered the pioneer study in cardiovascular clinical epidemiology around the world. The study aimed to prevent CVD, which accounted for 80% of deaths in the United States at the time. It was the first study to bring epidemiology, which was then regarded as an infectious disease research method, to the field of CVD. This study is widely regarded as a representative epidemiological research study, and halved the incidence of CVD in the United States in 30 years as a result of pursuing the cause of coronary heart disease. Findings from this research are the basis for the reports in Table 1-1 and the development of the risk chart for CVDs in Fig.1-2.The Framingham Heart Study set the following 11 hypotheses [13]: 1) coronary heart disease increases with age and occurs earlier and more frequently in males; 2) persons with hypertension develop coronary heart disease at a greater rate than those who are normotensive; 3) elevated blood cholesterol level is associated with an increased risk of coronary heart disease; 4) tobacco smoking is associated with an increased occurrence of coronary heart disease; 5) habitual use of alcohol is associated with increased incidence of coronary heart disease; 6) increased physical activity is associated with decreased development of coronary heart disease; 7) an increase in thyroid function is associated with decreased development of coronary heart disease; 8) a high blood hemoglobin or hematocrit level is associated with an increased rate of developing coronary heart disease; 9) an increase in body weight predisposes a person to coronary heart disease; 10) the rate of development of coronary heart disease is increased in patients with diabetes mellitus; and 11) the incidence of coronary heart disease is increased in patients with gout. By proving these hypotheses, the study identified the risk factors of CVD, including age, high blood pressure, high cholesterol, and tobacco smoking.
The relationship between CVD and high blood pressure based on 61 prospective observational studies, including the Framingham Heart Study, is summarized in Fig.1-3. These studies indicate that high systolic blood pressure is associated with a high incidence of stroke and ischemic heart disease
Fig.1-3 | (a) Stroke mortality rate in each decade of age versus usual SBP. (b) Ischaemic
heart disease mortality rate in each decade of age versus usual SBP [14]
Among the four intermediate risk factors for CVDs (hypertension, diabetes, hyperlipidemia and obesity) identified in these previous studies, management of hypertension is considered the most important for preventing CVDs. Accordingly, WHO has released an independent report on the prevention of hypertension [15]. This report highlights the main factors contributing to the development of high blood pressure, with "housing" identified as a social factor. However, housing was absolutely treated as "hotbeds of inappropriate lifestyles," and its direct impact on high blood pressure has not been demonstrated (Fig.1-4).
Fig.1-4 | Main factors that contribute to the development of high BP and its complications
[15] 256 128 64 32 16 8 4 2 1 120 140 160 180
Usual systolic blood pressure [mmHg]
S tro ke m o rta lity (f loa tin g a b so lut e risk a n d 9 5 %CI) Age at risk: 80-89 years 70-79 years 60-69 years 50-59 years (a) Stroke 256 128 64 32 16 8 4 2 1 120 140 160 180
Usual systolic blood pressure [mmHg]
Isch a e m ic h e a rt d isea se m o rta lity (f loa tin g a b so lut e risk a n d 9 5 %CI) Age at risk: 80-89 years 70-79 years 60-69 years 50-59 years 40-49 years
(b) Ischaemic heart disease
Social determinants and drivers
・Globalization ・Urbanization ・Ageing ・Income ・Education ・Housing ・Unhealthy diet ・Tobacco use ・Physical inactivity ・Harmful use of alcohol
Behavioral risk factors
・High blood pressure
・Obesity ・Diabetes ・Raised blood lipids
Metabolic risk factors
・Heart attacks ・Strokes ・Heart failure
Cardiovascular disease
Chapter 1
|
211.2 Efforts to prevent cardiovascular diseases and hypertension in Japan
1.2.1 Medical and nursing care financial crisis
Japan is one of the first countries to be confronted with the problems associated with an aging population. The number of people aged 65 years or older reached a record 34.59 million, or 27.3%, among a total population of 126.93 million in 2016. The proportion of people aged 65 years or older was 1 in 10 in 1985, 1 in 4 in 2010, and is estimated to increase to 1 in 2.5 in 2060[16] (Fig.1-5).
As a consequence of this increase, medical and nursing care expenditure are also increasing, causing severe strain on government finances. Medical and nursing care expenses reached 37 and 8 trillion yen in 2010, and are expected to double to 68 trillion yen and triple to 24 trillion yen, respectively, by 2025 [17−19](Fig.1-6). [17][18][19]
Fig.1-5 | Aging rate of countries around the world (graphed using data from[16])
Fig.1-6 | Prospects for medical and nursing care expenses in Japan (translated from[19])
0 5 10 15 20 25 30 35 40 1 9 50 1 9 55 1 9 60 1 9 65 1 9 70 1 9 75 1 9 80 1 9 85 1 9 90 1 9 95 2 0 00 2 0 05 2 0 10 2 0 15 2 0 20 2 0 25 2 0 30 2 0 35 2 0 40 2 0 45 2 0 50 2 0 55 2 0 60 Japan China Spain Germany United Kingdom United States of America 2017 Estimated P o p u la tio n a g in g r at e[ % ] 0 20 40 60 80 100 2000 2005 2010 2015 2020 2025 介護費 医療費 M ed ic al -c ar e ex pe ns es , N ur si ng -c ar e ex pe ns es [t ril lio n ye n] Nearly double [year] Nearly triple 37 8 68 24 Medical-care expenses Nursing-care expenses
Factors associated with the medical and nursing care financial crisis can be identified by breaking down medical costs reported in yearly surveys conducted by the Ministry of Health, Labour and Welfare by age and disease (Fig.1-7). According to these surveys, the proportion of costs due to CVDs is the largest among people aged 65 years or older, accounting for about a quarter of total medical expenditure[20]. There is therefore concern that medical expenses will increase as the aging population rises. Meanwhile, cerebrovascular disease and heart disease were the second and sixth most prevalent among diseases that cause patients to require nursing care, respectively. Moreover, among cases of dementia, the most prevalent disease to cause patients to require nursing care, 30% were caused by cerebrovascular disease (Fig.1-8). These findings indicate that CVDs account for more than a quarter of nursing care cases[21, 22]. Therefore, as suggested above, an effective measure for the prevention of CVDs is needed to reduce these expenditures.
Fig.1-7 | Breakdown of medical costs by age and disease (translated from[20])
Fig.1-8 | Breakdown of diseases that cause patients to require nursing care
(modified and translated from[21, 22])
Several studies have identified the risk factors for CVDs in Japan, which include hypertension, diabetes, hyperlipidemia and tobacco smoking[23]. Among these, hypertension has the greatest population-attributable risk ratio for the onset of CVDs and death from CVDs [23−25]. This suggests that prevention of hypertension will lead to a reduction in the risk of death due to CVDs. Some of the studies that have verified the relationship between CVDs and hypertension in Japan are
0% 20% 40% 60% 80% 100% Under 65 years old Malignant neoplasm 13.2% Cardio -vascular diseases 10.9% Respiratory diseases 10.3% Mental illness 9.1% Other factors 49.4% Genital diseases 7.1% Total: 11.5 trillion yen 0% 10% 20% 30% 40% 50% 60% 70% 80% 90% 100% 65 years old and above Total: 18.6 trillion yen Malignant neoplasm 14.6% Cardiovascular diseases 25.1% Musculo -skeletal Illness 8.5% Injury, Toxicosis 8.0% Other factors 36.6% Genital diseases 7.2% 0% 10% 20% 30% 40% 50% 60% 70% 80% 90% 100% Dementia 18.0% Debilitation 13.3% Joint diseases 10.2% Other factors 23.2% Heart diseases 4.3% Cerebrovascular diseases 16.6% Falling, fracture 12.1% 0% 20% 40% 60% 80% 100% Cerebrovascular diseases 30% Alzheimer’s 50 % Other factors 20 %
Chapter 1
|
23(1) Hisayama Study
The Hisayama Study began with the aim of clarifying the actual state of stroke, which was the leading cause of death in Japan in 1961[26]. A prospective cohort survey was conducted in residents over 40 years old in the town of Hisayama, Kasaya-gun, adjacent to Fukuoka City. The study is characterized by a high follow-up accuracy, with a participation rate of 99% in the cohort survey. Analysis of data from 588 males and females aged over 60 years who were followed for 32 years suggested that high blood pressure was associated with a higher incidence of stroke, even after adjusting for gender and age[27] (Fig.1-9).
Fig.1-9 | Age- and sex-adjusted incidence of stroke by type according to BP category[27]
(2) Ohasama Study
The Ohasama Study was a prospective cohort study started in 1986 on hypertension and CVDs in residents in the town of Ohasama, Iwate Prefecture [28]. It was the world's first epidemiological study to use blood pressure indices obtained in non-medical environments, such as 24-hour ambulatory blood pressure and home blood pressure (self-measured blood pressure at home). These results based on ambulatory blood pressure in 1,500 people and home blood pressure in 2,000 people over the age of 40 years were recognized globally. The study was cited in a description on the clinical significance of ambulatory blood pressure and home blood pressure in “The Sixth Report of the Joint National Committee on Prevention, Detection, Evaluation, and Treatment of High Blood Pressure [29]” in 1997, the “1999 WHO/ISH Guidelines for the Management of Hypertension [30]” and the “2003 ESH - ESC guidelines for the management of arterial hypertension [31].”
In ci de n ce o f st ro ke [pe rs on / ( 10 00 pe rs on -y ea rs )] SBP[mmHg] DBP[mmHg] <120 <80 and 120-129 80-84 or 130-139 85-89 or 140-159 90-99 or 160-179 100-109 or 180≤ 110≤ or
*
*
*
61.7 60 50 40 30 20 10 0 23.8 23.8 12.5 8.9 7.3 p<0.05(vs 120/80mmHg)*
70(3) NIPPON DATA
NIPPON DATA 80 was a follow-up study of subjects of the Third National Survey on Circulatory Disorders, conducted in 1980. It examined the relationship between the risk factors for CVD and the risk of death. Similarly, NIPPON DATA 90 was a follow-up study of subjects of the Fourth National Survey on Circulatory Disorders, conducted in 1990[32]. NIPPON DATA 80 followed 9,638 men and women for 19 years, and their data were used to develop risk assessment charts of the 10-year probability of death due to coronary heart disease, stroke and CVD. These risk charts have been released as a health education tool to improve lifestyle habits[33](Fig.1-10).
CARDIOVASCULAR DISEASE RISK ASSESSMENT CHART 10-year CVD death probability in women
Casual glucose level <200 mg/dl Nonsmoker Smoker
Total cholesterol category
Total cholesterol category 1=160-179, 2=180-199, 3=200-219, 4=220-239, 5=240-259, 6=260-279
70-79 60-69 50-59 40-49 Age (years)
Casual glucose level ≥200 mg/dl Nonsmoker Smoker
Total cholesterol category
1 2 3 4 5 6 1 2 3 4 5 6 Systolic BP (mmHg) 180-199 160-179 140-159 120-139 100-119 180-199 160-179 140-159 120-139 100-119 180-199 160-179 140-159 120-139 100-119 180-199 160-179 140-159 120-139 100-119 1 2 3 4 5 6 1 2 3 4 5 6 <1% 1-3% 3-7% 7-15% 15-30% ≥30%
CARDIOVASCULAR DISEASE RISK ASSESSMENT CHART 10-year CVD death probability in men
Casual glucose level <200 mg/dl Nonsmoker Smoker
Total cholesterol category
70-79 60-69 50-59 40-49 Age (years)
Casual glucose level ≥200 mg/dl Nonsmoker Smoker
Total cholesterol category
1 2 3 4 5 6 1 2 3 4 5 6 Systolic BP (mmHg) 180-199 160-179 140-159 120-139 100-119 180-199 160-179 140-159 120-139 100-119 180-199 160-179 140-159 120-139 100-119 180-199 160-179 140-159 120-139 100-119 1 2 3 4 5 6 1 2 3 4 5 6 <1% 1-3% 3-7% 7-15% 15-30% ≥30%
Chapter 1
|
25(4) J-HOP Study
The J-HOP (Japan Morning Surge - Home Blood Pressure) Study began in 2005 as a prospective observational study that evaluated the "prognostic ability of home blood pressure for cardiovascular disease events" in about 4,500 people nationwide [34]. Blood pressure measurements were conducted at home for 2 weeks. The results showed that blood pressure measured at home in the morning was a better prognostic factor for stroke than that measured in the evening [35] (Fig.1-11).
Fig.1-11 | Stroke and coronary artery disease risks according to morning or evening home
systolic blood pressure categories [35]
0 5 10 15 20 <135 135-144 145-154 155-164 ≥165
Home systolic blood pressure [mmHg]
Event number/ Total number (Morning) (Evening) 12/1,958 35/2,851 20/1,044 20/787 16/687 7/366 11/342 6/177 15/247 6/97 Morning Evening p < 0.05 p < 0.01 p < 0.001 H az ar d r at io f o r in ci d en t st ro ke [ -] * † † ‡ * * † ‡
(5) HONEST Study
The HONEST (Home blood pressure measurement with Olmesartan Naive patients to Establish Standard Target blood pressure) Study was a prospective observational study started in 2009 which aimed to examine the association between home blood pressure and CVD events during follow-up
[36, 37]. It is regarded as the world's biggest study of its kind, conducting follow-up surveys for over 2 years in 21,591 hypertensive patients who were administered antihypertensive drugs. The study showed that blood pressure measured at home in the morning was associated with the risk of cerebrovascular and heart disease [38] (Fig.1-12). In addition, even when clinical blood pressure was controlled to <130 mmHg, the hazard ratio for CVD events increased to 2.47 when home blood pressure was poorly controlled (145 mmHg or more) [39] (Fig.1-13).
Stroke
In cid en ce r at e (e ve n ts/ 1 0 0 0 p at ie n t-ye ar s) No. of patients No. of antihypertensive drugs (mean±SD) 15 10 5 0 <125 125 to < 135 135 to < 145 145 to < 155 ≥155 3007 7348 7169 2562 917 1.3±0.8 1.5±0.8 1.6±0.9 1.7±1.0 1.7±1.2 1.79 1.71 2.32 3.97 12.57*
‡ Morning home SBP (mmHg) p < 0.05 p < 0.01 p < 0.001 * † ‡ In ci de n ce r at e (e ve n ts/ 1 0 0 0 p atie n t-ye ar s) No. of patients No. of antihypertensive 15 10 5 0 <125 125 to < 135 135 to < 145 145 to < 155 ≥155 3010 7340 7171 2573 914 1.3±0.8 1.5±0.8 1.6±0.9 1.7±1.0 1.7±1.2 1.46 1.71 2.46 4.15 12.61 † ‡ Morning home SBP (mmHg)Coronary artery disease
p < 0.05 p < 0.01 p < 0.001 * † ‡
Chapter 1
|
27Fig.1-13 | Relationship between the primary end point (CVD events) and SBP divided into 9
1.2.2 Policies for preventing cardiovascular disease
From 2000 to 2012, the Ministry of Health, Labor and Welfare in Japan set guidelines aimed at improving strategies for the prevention of CVDs, such as "The first term of the National Health Promotion Movement in the Twenty-First Century" (Health Japan 21 (the first term)). Health Japan 21 focused on "primary prevention: prevent diseases in advance" rather than "secondary prevention: early detection and early treatment." Specific targets for 2010 were set for 80 items in nine fields, namely nutrition, physical activity, rest, smoking, alcohol consumption, dental health, diabetes, CVDs and cancer. One of the items under CVDs was improvement of hypertension, specifically to reduce the average systolic blood pressure by 4.2 mmHg over the next decade[40].
Additionally, Health Japan 21 (the second term) was established in 2012 and set a target to minimize the incidence of hypertension by reducing the average systolic blood pressure by 4 mmHg over the next decade through lifestyle modification[41]. According to Healthy Japan 21 (the second term), reducing the average systolic blood pressure (SBP) of Japanese aged 40 to 89 years by 4 mmHg (men: 138→134 mmHg, women: 133→129 mmHg) will prevent an estimated 14,000 deaths from CVDs each year in Japan, including 9,300 deaths from cerebrovascular disease and 4,700 from ischemic heart disease (Fig.1-14). Therefore, prevention of hypertension is considered critical to the prevention of CVDs.
Fig.1-14 | Hierarchical structure of Health Japan 21 (the second term) for prevention of
CVDs (translated from[41])
Decrease SBP by
4.0 mmHg
Hyperlipidemia
Smoking Diabetes
Hypertension
2.3 mmHg↓ 1.5 mmHg↓ 0.12 mmHg↓ 0.17 mmHg↓
Boundaries of Health Japan 21 (second term)
■Prevention effects Male : 6,100 deaths/year↓ Female: 3,200 deaths/year ↓ Cerebrovascular disease ■Prevention effects Male : 2,500 deaths/year↓ Female: 2,200 deaths/year ↓
Ischemic heart disease Cardiovascular
diseases
Four risk factors
Diet
Salt intake ↓ Vegetable intake ↑ Obesity rate ↓Activity
Steps ↑ Regular exercise↑Alcohol
Heavy alcohol consumption↓Drugs
Taking antihypertensive drugs 10% ↑Chapter 1
|
291.2.3 Present status and efforts for preventing hypertension
A 2014 survey of hospital patients released by the Ministry of Health, Labor and Welfare estimated that there were 10.11 million hypertensive patients in Japan [42]. However, because hypertension is an asymptomatic disease, also known as a “silent killer”, a large number of patients with hypertension do not visit a hospital. In fact, it is estimated that there are actually 43 million hypertensive patients[43] (Fig.1-15), which is equivalent to about one-third of the population. Moreover, the incidence of hypertension increases with age, suggesting that the number hypertensive patients will increase with the aging population in the future.
Fig.1-15 | Estimated number of hypertensive patients in Japan[43]
To prevent hypertension, the Japanese Society of Hypertension published "Guidelines for the management of hypertension 2014 (JSH 2014)"[44]. The guideline lists "lifestyle modification items for prevention of hypertension" (Table 1-2), and summarizes the "recommended grade" (Table 1-3) and "evidence level: the strength of evidence obtained so far" (Table 1-4) for each item. Among the lifestyle modification items, cold protection is classified under "Other". The guideline states that cold temperatures raise blood pressure, which leads to a rise in blood pressure in winter months. Moreover, mortality rate in winter due to CVDs rises sharply when heating or cold protection is insufficient. Therefore, hypertensive patients should use heating during winter, including in toilets, bathrooms, and changing rooms in Japan, which are often overlooked. Although these descriptions indicate the importance of heating, including in non-living rooms, the evidence in support of this is scarce, and has only been obtained from cross-sectional studies. The recommended grade was therefore set as C and the evidence level as IVb, indicating that scientific evidence is insufficient.
1.0 0 2.0 3.0 4.0 5.0 6.0 7.0 0 1.0 2.0 3.0 4.0 5.0 6.0 7.0
Estimated number of hypertensive patients[million]
Men Women 20-29 30-39 40-49 50-59 60-69 70-79 80-89 1.0 0.2 1.8 0.5 2.9 1.4 5.1 3.2 5.8 5.9 4.7 5.1 2.0 3.4 [years]
Table 1-2 | Lifestyle modification items for prevention of hypertension (translated from[44])
Item Goal Recommended
grade
Evidence level
(1) Salt reduction Salt intake less than 6 g/day A I
(2) Diet
Vegetables/ fruit
High consumption of vegetables and fruit
B II
Lipids Avoid intake of cholesterol and saturated fatty acids High consumption of fish or fish oil
(3)Weight loss Body mass index (Weight [kg]/Height [m]
2) less than
25.0 A I
(4) Exercise
For hypertensive patients without CVD:
periodic exercise by mainly doing aerobic exercise (at least 30 minutes every day)
A I
(5) Elimination of alcoholism
In men, less than 20–30 mL/day ethanol
In women, less than 10–20 mL/day ethanol A I
(6)Elimination of smoking
Promotion of anti-smoking and prevention of passive
smoking A IV
(7) Other
Cold protection, management of emotional stress, Improvement in sleep, bathing in water that is not too hot
C IV
Table 1-3 | Recommended grade for prevention of hypertension (translated from[44])
Recommended
grade Description
A There is strong scientific basis, it is strongly recommended. B There is scientific basis, it is recommended.
C1 Although scientific basis is insufficient, it is recommended. C2 Scientific basis is insufficient, it is not recommended.
D There is scientific basis, so it is not recommended. [45][46][47][48][49] [50][51][52]
Table 1-4 | Evidence level in medicine (translated from[44])
Evidence
level Description
I Systematic reviews or meta-analysis of randomized controlled trials
II Randomized controlled trials
III Non-randomized controlled trials, sub analysis or post hoc analysis of randomized controlled trials
IVa Epidemiological research (cohort studies, meta-analysis of cohort studies) IVb Epidemiological research (case-control studies, cross-sectional studies)
Chapter 1
|
311.3 Excess winter mortality
Excess winter mortality (EWM) is a phenomenon in which the mortality rate increases sharply in winter [45−49] and is predominantly caused by cardiovascular and respiratory diseases [50−52]. A paradoxical relationship in which EWM is higher in areas with milder winter climates has been observed in Europe[53, 54] (Fig.1-16), the USA[55] and Asia[56, 57]. This is attributed to houses in these areas being less prepared for the winter season, resulting in lower than recommended indoor temperatures. In fact, lower indoor temperatures have been reported in areas with higher outdoor temperatures[45], and EWM is higher in colder houses than warmer houses[49] (Fig.1-17).
Fig.1-16 | Coefficient of seasonal variation in mortality in Europe[47]
Fig.1-17 | Seasonal fluctuation in CVD mortality in cold and warm homes[49]
F in la n d G e rm a n y Neth er lan d De n m a rk Lu xem bo ur g B el gi um F ranc e A us tr ia It a ly G ree ce UK Ir el an d S pai n P or tug al 0% 5% 10% 15% 20% 25% 30% E xc es s w int er m or ta lity as th e pe rc en ta ge inc rea se ov er no n -w int er d ea th s
1 January 1 April 1 July 1 October 1 December
0.8 1.0 1.2 1.4 1.6 R isk o f d ea th r el ativ e to su m m er m in im u m Coldest 25% of homes Warmest 25% of homes
Note: The curves represent the top and bottom quarters of the distribution of predicted
This paradoxical relationship has been observed in Japan[58] (Fig.1-18), which experiences both temperate and subarctic climates due to the orientation of the long axis of the Japanese landmass, which extends north to south.
Studies on deaths inside houses indicate that CVDs, such as heart diseases and cerebrovascular diseases, are the leading cause of death, despite being the second and fourth overall leading cause of death after malignant neoplasm in Japan[59](Fig.1-19). In particular, there is a substantial increase in the number of deaths due to CVDs in winter, to a level more than twice that in summer. The thermal environment inside houses may be associated with deaths due to CVDs because the increase in the number of deaths in winter is greater in houses than in hospitals, which generally have appropriate temperature control[59]. [60][61][62]
Fig.1-18 |Coefficient of seasonal variation in mortality by prefecture in Japan
(graphed using data from[58])
0 5 10 15 20 25 30 北 海 道 青 森 県 沖 縄 県 新 潟 県 秋 田 県 徳 島 県 広 島 県 石 川 県 山 形 県 長 崎 県 東 京 都 宮 崎 県 福 岡 県 山 口 県 長 野 県 大 阪 府 宮 城 県 島 根 県 奈 良 県 京 都 府 佐 賀 県 兵 庫 県 神 奈 川 県 富 山 県 岡 山 県 岩 手 県 高 知 県 愛 知 県 埼 玉 県 群 馬 県 千 葉 県 鳥 取 県 岐 阜 県 福 島 県 福 井 県 大 分 県 和 歌 山 県 熊 本 県 香 川 県 滋 賀 県 静 岡 県 鹿 児 島 県 三 重 県 愛 媛 県 山 梨 県 茨 城 県 栃 木 県 傷病・外因 その他の疾患 呼吸器系疾患 脳血管疾患 心疾患 E xc es s w in te r m or ta lit y [ % ]
1.27 million Japanese die annually (0.47 million die in winter) National average of excess winter mortality: 17.5%
Source: Vital Statistics, Ministry of Health, Labour and Welfare 2014
Injuries and sickness Other disease Respiratory disease Cerebrovascular disease Heart disease H o kk ai d o Ya m ag u ch i A o m o ri O ki n aw a N iig at a A ki ta H iro sh im a To ku sh im a Is h ik aw a Ya m ag at a N ag as ak i To ky o M iy az ak i F u ku o ka N ag an o O sa ka M iy ag i S h im an e N ar a K yo to S ag a K an ag aw a H yo g o To ya m a O ka ya m a Iw at e K o ch i A ic h i S ai ta m a G u n m a C h ib a To tto ri F u ku sh im a G ifu F u ku i O ita W ak ay am a S h ig a K ag aw a K u m am o to S h iz u o ka K ag o sh im a M ie E h im e Ya m an as h i Ib ar ak i To ch ig i Cancer 1 2 3 4 5 6 7 8 9 10 11 12 [month] 0 4 8 12 16 20 N u m b er o f d ea th s in h o u se s [ p er 1 0 0 ,0 0 0 p eo p le ] Heart disease Cerebrovascular disease
Chapter 1
|
33 Additionally, people in modern society spend between 60% and 70% of their time at home[60−62]. This is even higher among elderly people, who have declining physiological function, and children, whose physiological function is underdeveloped[63]. This indicates the importance of the impact of the thermal environment inside houses on health. Moreover, Japan is aiming to establish the Community-based Integrated Care System by moving from hospital-based- to region-based-style care to enhance home medical care and home medical care support[64] (Fig.1-20). The importance of housing conditions is therefore expected to continue to attract attention in the future.
Fig.1-20 | Conceptualization of community-based integrated care systems in 2025
(modified and translated from[64])
When sickness occurs…
Medical care
When care is needed…
Nursing care
Housing
To livehealthily as long as possible…
Livelihood Support & Care Prevention
・Community comprehensive care center
・Care managers
Hospital visit/admission
Commuting/admission
・Senior citizens’ clubs
・Community associations
・Volunteer
・Non-profitable organization
・Primary care doctor
・Partnership hospital
・Acute hospital
・Rehab hospital
・Attendant/visiting service
・Short-stay service
・Long-term care health facility
1.4 Necessity of improving the thermal environment inside houses in Japan
In 2017, there were a total of 60.63 million dwellings in Japan. The number of occupied dwellings (places in which people usually live) was 52.10 million, accounting for 85.9% of the total number of dwellings. Among occupied dwellings, 54.9% were detached houses, about 90% of which were wood-frame houses. In contrast, 42.4% of occupied dwellings were apartment buildings, among which 12.5% were wood-frame buildings and more than 70% were made of other materials such as steel or reinforced concrete[65]. Uninsulated houses were estimated to account for 39% of existing dwellings, and 37%, 19%, and 5% of houses complied with the 1980, 1992, and 1999 adiabatic level standards, respectively[66] (Fig.1-21). Therefore, there are still many houses with low thermal insulation in Japan.
Standards for the average heat transmission coefficient for the outer skin (UA-value) and the heat transmission coefficient for windows (UW-value) have been compared internationally[67]. These parameters are indicators of the adiabatic level, with lower values indicating lower transmission and therefore higher heat retention. Findings indicate that even according to 2013 standards (current standards), the UA-value in Tokyo is about twice as high as that in the U.S. state of California, which shares the same climate category as Tokyo (Fig.1-22). In addition, the UW-value is 2.33 W/m2K in Hokkaido and 4.65 W/m2K in Tokyo, which markedly exceeds the 1.0 to 2.0 W/m2K range of values in European and American countries (Fig.1-23).
Fig.1-21 | Adiabatic level of existing dwellings in Japan (translated from[66])
1999 standards (current standards) 5% 1992 standards 19% Non-thermal-insulated houses 39% 1980 standards 37%
Chapter 1
|
35Fig.1-22 | Standards for the average heat transmission coefficient for the outer skin
(UA-value) of the main countries (modified from[67])
Fig.1-23 | Standards for the heat transmission coefficient for windows (UW-value) of the main
countries (modified from[67])
Residential energy consumption in Japan is also very low compared to European and American countries, with energy used for heating being only one-quarter of that in Western countries[68]
(Fig.1-24). This is because while intermittent heating in only the living room is standard practice in Japan, European and American countries commonly perform continuous heating throughout the entire building. As a result, room temperatures are lower in Japan than in other countries. A survey of indoor environments in 602 houses throughout Japan indicated that the average room temperature in winter was 17°C[69]. This is below the minimum room temperature of 18°C recommended by WHO[70]and the UK government[71, 72], and there is concern that this may greatly affect health (Table 1-5). 0.2 0.4 0.6 0.8 1.0 0.0 H ea t tra n smi ssi on co ef fici en t f or th e ou te r ski n (UA -v al u e) [W /(m 2・ K)] 0 500 1,000 1,500 2,000 2,500 3,000 3,500 4,000 4,500 5,000 5,500 Heating degree-day (D18-18) [˚C -day]
Japan Korea California, USA (Prescriptive) Germany UK 8
(Naha) (Kagoshima)7 (Tokyo)6 (Tsukuba)5 (Sendai)4 (Morioka)3 (Sapporo)2 (Asahikawa)1
3.0 5.0 6.0 7.0 8.0 0.0 4.0 2.0 1.0 0 500 1,000 1,500 2,000 2,500 3,000 3,500 4,000 4,500 5,000 5,500 Heating degree-day (D18-18) [˚C -day]
H ea t tra n smi ssi on co ef fici en t f or th e w in d ow (UW -v al u e) [W /(m 2・K)] 8 (Naha) 7 (Kagoshima) 6 (Tokyo) 5 (Tsukuba) 4 (Sendai) 3 (Morioka) 2 (Sapporo) 1 (Asahikawa) Japan California, USA (Prescriptive) Germany UK Korea
![Table 2-1 | Profiles of potential health and safety hazards in dwellings in HHSRS [77]](https://thumb-ap.123doks.com/thumbv2/123dok/1870449.2663804/57.892.154.764.754.1076/table-profiles-potential-health-safety-hazards-dwellings-hhsrs.webp)
![Table 2-3 | Cost benefit analysis of the Warm Up New Zealand: Heat Smart Programme [81]](https://thumb-ap.123doks.com/thumbv2/123dok/1870449.2663804/60.892.161.769.795.1128/table-cost-benefit-analysis-warm-zealand-smart-programme.webp)
![Table 2-5 | Summary of findings on the effectiveness of clinical trials (modified from [74])](https://thumb-ap.123doks.com/thumbv2/123dok/1870449.2663804/62.892.146.782.419.1112/table-summary-findings-effectiveness-clinical-trials-modified.webp)
![Table 2-7 | Changes in blood pressure in intervention and control group [102]](https://thumb-ap.123doks.com/thumbv2/123dok/1870449.2663804/68.892.138.767.522.958/table-changes-blood-pressure-intervention-control-group.webp)
![Table 2-9 | Summary of studies on ambient temperature and blood pressure in adults [113]](https://thumb-ap.123doks.com/thumbv2/123dok/1870449.2663804/70.892.141.778.391.1078/table-summary-studies-ambient-temperature-blood-pressure-adults.webp)
![Table 2-10 | Multilevel linear regression analysis of the association between ambulatory blood pressure and temperature [114]](https://thumb-ap.123doks.com/thumbv2/123dok/1870449.2663804/72.892.130.768.500.877/table-multilevel-regression-analysis-association-ambulatory-pressure-temperature.webp)
![Table 2-11 | Regression analyses on the relationship between indoor temperature and SBP (Woodhouse et al.) [115]](https://thumb-ap.123doks.com/thumbv2/123dok/1870449.2663804/73.892.128.768.362.663/table-regression-analyses-relationship-indoor-temperature-sbp-woodhouse.webp)
![Table 2-13 | Models for mean SBP quantifying the effects of season and temperature [117]](https://thumb-ap.123doks.com/thumbv2/123dok/1870449.2663804/74.892.132.770.393.615/table-models-mean-sbp-quantifying-effects-season-temperature.webp)