CHAPTER II
THEORETICAL BACKGROUND
2.1 Related Study
This chapter presents several related work used to theoritical basis. There are 3 works
that present in this chapter describe the application of data mining market basket analysis.
So many enterprises that implement data mining about sales transaction in their databases
as follow:
a. Association Rule with Frequent Pattern Growth Algorithm for Frequent Item Sets
Mining [3]
The study analyze about the transaction dataset, where frequent item sets mining
is one of the most challenging problem. The information is not extracted from a single data source. This region has problem on finding customers’ shopping.
Mining frequent item set could be done by using FP Growth algorithm.
Specifically, the study applied association rules using FP-Growth algorithm on big
data sets directly from transactions of customers of the supermarket.
The transformed dataset is devided into a set conditional dataset for each
frequent item and mines each such dataset separately to generate frequents item. The
study using FP-Growth for generating frequent item sets mining from market basket
analysis. Each transaction from the structure are processed in reverse order and saved
the numbe of transactions in the FP-tree structure in reverse order because the aims
is to have a rather small tree size, the most frequent articles within the transactions
being saved as close as possible to the root.
The simulate process of generating association rules by using FP-Growth
algorithm with the creation or load of a previously pre-processed. The minimum
suport value was set to 0.1 (10%) while the minimum confidence value was set to 0.2
(20%). The scanne data from the stores was aggregated and market basket analysis
was run individually for each store.
The result of the study is the common items that should be placed closely are
desserts. And the top two individual items are beer wine spirits and snack foods and
also the top item set which is brought together. The final result of the study is
promising with high confidence. Further study may utilize this result to suggest
marketing plans for the store such as product arrangement.
b. Aplikasi Data Mining Analisa Data Transaksi Penjualan Obat Menggunakan
Algoritma Apriori [4]
To analyze market basket drug sales transaction data by using data mining. The
amount of competition in the business world, particularly in the pharmacy industry.
In order to know what drugs are purchased by the customer, can be done by the
technique of analysis which is an analysis of customer buying habits. The detection
of the drugs that often purchased together carried out to use association rule, which
is the process of finding associations or relationships among data items are taken
from a relational database.
The algorithm that used as the main process market basket analysis is apriori
algorithm by using minimum support parameters, minimum confidence and the
period of sales transactions to find association rules. Data used are sales transaction
data drugs from Apotek Setya Semarang starting from 14th January, February and March 2012 that customers conduct transactions drug purchases and blood drug
analgesic simultaneously. On January, data consist of 450 transactions and 1240
record. On February, the data consist of 480 transactions and 1104 record. On March
the data consists of 397 transactions and 903 records.
The study has three labels of basis data consist of medicine data, transaction
data, detail of transaction data. On the example of manual calculation formation of
the association rule, needed the data source which is data transaction of pharmacy
purchasing on 14th January 2012. Drug data, is the data that consists of type of drug.
Attributes of drug data are id, nama, keterangan.
1) Data transaction is data about sales transaction note of drug. The attributes are
id, tgl, no_resep, jenis_penjualan, customer, nama_dokter, nama_pasien, resep.
2) Data detail of transaction are data about the details from sales transaction data.
There are two main processes where to analyze the sales transaction drug data
using association rule, which is process of making frequent itemset and process
making rule.
1) Making Frequent Itemset Process
Using apriori algorithm. In this process carried out some iteration and stop
until there is no candidate of frequent itemset that fulfills minimum support.
2) Making Rule Process
After frequent itemset formed, the next phase is making rule process.
Association rule that formed is association rule that has been fulfill minimum
support and minimum confidence that has been decided.
The test results with different minimum support are the minimum number of
support inversely proportional to the number of rules generated. The lowest
minimum value produces the highest rule, which is the test with a minimum support
= 1 produces the rules as much as 619 rules (January). 125 rules (February), and 124
rules (March). The minimum value of the highest support at least produces rules.
The test results with different minimum confidence are the minimum value of
confidence given the smallest produces the most number of rules, i.e the minimum
value of 10% confidence produced the rules which are 152 rules (January), 77 rules
(February), 62 rules (March).
The test results with the smallest rule are minimum support = 6 and minimum
confidence 40% produce the smallest number of rules for February and March while
the minimum confidence = 50% produce the smallest number of rules for January.
From the sample, can be concluded the value of minimum support 6 and
minimum confidence 40 % are the value which can produces the most powerful rule
in February (1 rule) and March (2 rules), while for value of minimum confidence
50% produces the most powerful rule in January (3 rules).
c. Frequent Pattern and Association Rule Mining from Inventory Database Using
Apriori Algorithm [5]
The study concern the information and knowledge obtained from the huge data
problem of mining association rules between items in a large database of sales
transactions in order to understand customer buying habits for the purposed of
improving sales. It was found that for a transactional database where many transaction
items are repeated many times as a superset in that type of database.
By analyzing the information, try to find out persistent patterns in order to offer
related goods together and therefore, increase the sales. Can track related sales on a
different level of goods classification or on different customer segments. Apriori
algorithm is correct for mining frequent itemset. With implementing the PHP, and
MySQLdatabase management system for storing the inventory data. Purposed to
produces frequent itemsets completely and generates the accurate strong rules.
The implementation using PHP and My SQL database with build an interface
for setting minimum support and minimum confidence, apriori algorithm during
iterations and generating strong rules. The interface used for mining support and
confidence threshold for association rule generation. The initial stage shows the
transactional data used for the association mining followed by the frequent itemsets
generation stages. Three itemsets were generated from the initial transactional data.
Strong rules generated after the computation of confidence on the three most frequent
itemsets as satisfied by the threshold. The result is if a customer purchases TV, there
is 70% confidence that will purchase TV Stand and Generator. Conversely, there is
85% confidence that a customer who purchases generator will purchase both TV and
TV stand as well.
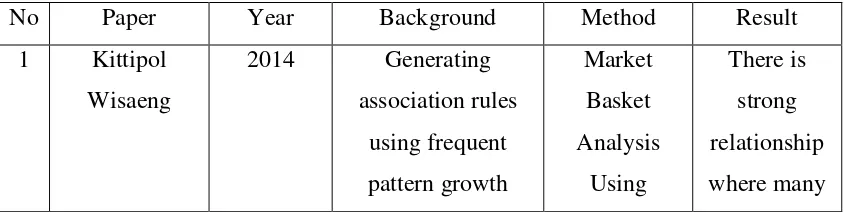
From the example, can be concluded that various companies may implement
data mining approach to improve their marketing strategies as shown in Table 1. This
study will implement market basket analysis in a furniture company which might be
a good prospect for data mining area
Table 1. Summary of related work
for the value
2014 Focuses on apriori
TV stand as
well.
2.2 Theoretical Foundation
2.2.1 Market Basket Analysis Definition
Market basket analysis is an important component of the analytical system
in retail organizations. There are several definitions of market basket analysis in
many researches. As widely meaning, market basket analysis targets customer
baskets in order to monitoring buying patterns and improve customer satisfaction
[5]. Another definition, market basket analysis, is one the most data analysis that
often used in the marketing world. The purpose of the Market Basket Analysis is
to determine what products are most often purchased or used at the same time by
the consumer. Market Basket Analysis process is to analyze the buying habits of
consumers to find associations between the different products that put consumers
in a shopping basket.
2.2.2 Data Mining
The extraction of interesting patterns or knowledge from huge amount of
data and also can call knowledge discovery from data. Data mining has alternative
names such as knowledge extraction, data/pattern analysis, knowledge discovery
(mining) in the database (KDD), business intelligence, and so on. The term data
mining is used to describe the collection of analysis techniques used to build
models from large datasets [4]. Another definition of data mining is some of the
important information that will be filter and extract from the database. Data mining
is not something new. One of the difficulties for defining data mining is the fact
that data mining inherited many of technical aspects and disciplines that have been
established beforehand.
Data mining is a process that employs one or more computer learning
techniques (machine learning) to analyze and extract knowledge (knowledge)
automatically. Another definition of which is based learning induction
(induction-based learning) is the process of establishing common definitions of concepts is
Based on definitions that have been submitted, the important thing related
to data mining are as follows:
1. Data mining is the automatically process based on the existing huge of data.
2. The huge amount of data will be proceed
3. The goal of data mining is to get and determine the coherence or pattern that
will possibility provide useful direction.
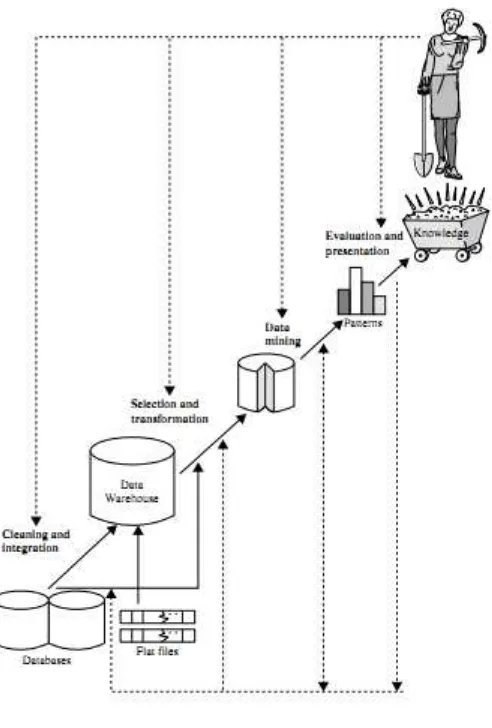
Figure 1. KDD process
There are 7 knowledge discovery process as shown in figure 1. of the following steps [6]:
1. Data cleaning
Before the process of data mining can be implemented, it needs to be done in
the data cleaning process was focus on KDD. In this step will do selection the
mining performance. Also, performance enrichment process, namely the
process of "enriching" existing data with the data or another relevant
information and necessary for KDD, such as data or external information.
2. Data integration
Data integration is merging data from several databases, so will be formed the
new data. Integration will be carried out when needed the unique attribute from
another database.
3. Data selection
In this step after getting the data will be carried out selection because of not all
of data will used in the procces. Selection of data from the operational data set
needs to be done before the stage of extracting information in KDD started. Data
from the selection that will be used for data mining process, is stored in a file
separate from operational databases.
4. Data transformation
The data is converted accordingly to the format required for processing in data
mining.
5. Process mining
The main process that aims to find patterns or valuable hidden information in
the data chunk.
6. Pattern information
In this step the result of data mining based on interesting patterns representing
knowledge.
7. Knowledge presentation
The step where to visualize and knowledge representation techniques are used
to display mined knowledge to users. In this step is a part of KDD process that
called interpretation.
2.2.3 Grouping of data mining
Data mining is divided into several groups on the tasks as follows:
1. Description
Sometimes researcher simply wanna try to find the data to illustrate patterns related
to the data.
Estimation almost same as classification, except the target variable estimation more
towards to numerical rather than to direction categories.
3. Prediction
Prediction similar as classification and estimation, except that in the result of
prediction value, will be there in the future.
Example prediction of economy and business: price prediction about tables on
furniture that will come
4. Classification
In the classification, there is a target categorical variables. For example, the
classification of revenue can be separated into three categories, namely high
income, medium income, and low income.
Another example of classification in the economy and business. For categorization
of bed in furniture can be divided into 3 categories, consist of minimalist bed,
Bagong bed, and rahwana bed.
5. Clustering
Clustering is a grouping of records, observation, or pay attention to and form a class
of objects that have similarities. Clustering is different with classification, there is
no variable target in clustering.
Examples of clustering in business and research are: Getting consumer groups for
targeted marketing of a product for companies that do not have large marketing
funds.
6. Association
Association task in data mining is to find the attributes that appear in one time. In
the business world commonly called market basket analysis.
2.2.4 Association Rule
An association rule is an implication of the form X →Y, where X and Y are distinct items or itemsets (collections of one or more items), X is the rule antecedent
and Y is the rule consequent. A rule antecedent is a part of the rule that needs to be
fulfilled in order that the rule consequent is true. It is an unsupervised data mining
technique that discovers connections among items/records of a large dataset. A
Association rule mining is data mining techniques to find the associative rules
between combinations of items. Examples of associative rules of purchases
analysis in a supermarket that using the bar-code scanner information with the huge
number of transaction records is able to know how likely a customer to buy bread
with milk. With this knowledge, the owners of supermarkets can adjust the
placement of the goods or designing a marketing campaign by using a combination
of discount coupons for certain goods. The rule that states the association between
some these attributes often called affinity analysis or Market Basket Analysis [5].
Important or not an associative rules can be determined by two parameters,
support, and confidence. Support is is the percentage of the combination of these
items in the database, while confidence is the strong relationships between items in
the association rules.
Association rules are usually expressed in the form:
{X→Y}⇔{bread, butter}→{milk}(support=40%, confidence=50%)
The rule means that "50%" of the transactions in the database that makes bread
and butter item also includes dairy items. While 40% of all transactions in the
database that contains three items. Generally, association rule mining can be
described as two phase:
1. Find all of the item combination that meets the minimum requirements of the
support value in the database.
2. Develop strong association rules from the frequent itemsets, these rules must
satisfy minimum support and minimum confidence. 2.2.5 Apriori Algorithm
Apriori algorithm is a basic algorithm proposed by Agrawal & Srikant
in 1994 for the determination of frequent itemset for boolean association rules [2].
Apriori algorithms including the type of association rule in data mining. The rule
that states the association between some attributes often called affinity analysis or
Market Basket Analysis. Analysis association or association rule mining is data
mining techniques to discover the rules of a combination of items. One of
association analysis stage that attracts many researchers to produce efficient
algorithm is the analysis of high-frequency patterns. Important or not an association
can be identified by the two benchmarks, namely: support and confidence. Support
while confidence (value certainty) is a strong relationship between the items in the
rules of association [7].
Apriori algorithm is used in searching frequent itemset to get the association
rules. As the name, this algorithm uses frequent itemset prior knowledge about the
properties that have been previously known to process more information. Apriori
using an iterative approach, also known as level-wish engines where k-itemset used
to find (k + 1) -itemset. First of all searchable set of frequent 1-itemset, this set is
denoted as L1. L1 is large itemset used to find L2, then the set of frequent 2-itemset
is used to locate L3, and so on until there are no more frequent k-itemset can be
found. A Large itemset is frequent or itemset-itemsets that have passed the
minimum threshold of support that has been determined [4].
There are two main processes that performed in the apriori algorithm:
1. Join
In this process for each item is combined with another item until can’t form a combination anymore.
2. Prune
In this process, the result of the item set that have been combined was trimmed using a
minimum support that has been specified by the user [8].
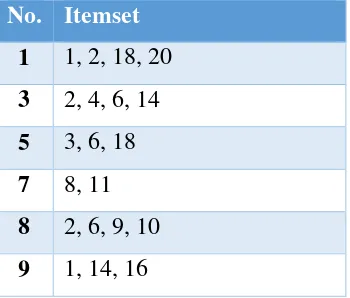
2.2.6 Manual Calculation Apriori
The example of 10 consumer shopping transactions will search for relationships
between items with minimum support (min. support) = 20% and minimum confidence
= 50% shown in Table 2 as follow.
Table 2. Example of transaction manual calculation apriori
No. Itemset
1 1, 2, 18, 20
3 2, 4, 6, 14
5 3, 6, 18
7 8, 11
8 2, 6, 9, 10
11 5, 7, 19
13 12, 15, 16
16 13, 14, 16, 17, 20
18 6, 11, 12, 16, 18
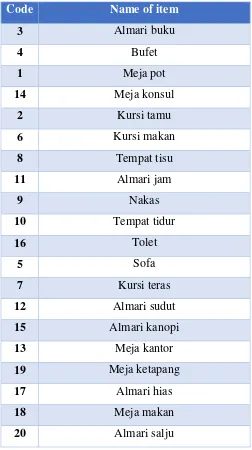
Description: variable “no” on (table 2) is the number of transactions and itemset is an item code to shorten the name itemset. The details of the code from table 2 shown in
Table 3. as bellow.
Table 3. Description codes name of items
Code Name of item
3 Almari buku
4 Bufet
1 Meja pot
14 Meja konsul
2 Kursi tamu
6 Kursi makan
8 Tempat tisu
11 Almari jam
9 Nakas
10 Tempat tidur
16 Tolet
5 Sofa
7 Kursi teras
12 Almari sudut
15 Almari kanopi
13 Meja kantor
19 Meja ketapang
17 Almari hias
18 Meja makan
Phase 1. Join:
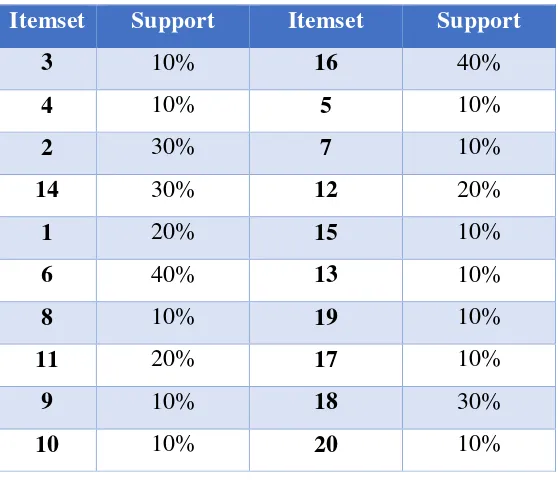
Find the itemset candidate of 1 item (C1) and count the support. For calculating the
support, seen how many itemsets that appear in the table of the transaction and
multiplied by the weight of each transaction. Because there are 10 transactions table, so
will be calculated from the percentage of 100% divided by the number of transactions.
The details of percentage for each itemset will be shown in Table 4.
� � = � � � � � ℎ� � � � � � �� X100% (1)
Table 4. Candidate itemset C1
Itemset Support Itemset Support
3 10% 16 40%
4 10% 5 10%
2 30% 7 10%
14 30% 12 20%
1 20% 15 10%
6 40% 13 10%
8 10% 19 10%
11 20% 17 10%
9 10% 18 30%
10 10% 20 10%
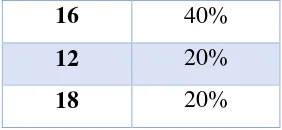
Phase 2. Prune:
Choose which fulfill the requirement of minimum support is 20%. The details will show
in Table 5. as follow.
Table 5. Frequent itemset L1 that fulfills the min. Support
Itemset Support
2 30%
14 30%
1 20%
6 40%
16 40%
12 20%
18 20%
The next phase is repeated the first phase and second phase until the candidate that
fulfill the minimum support does not exist anymore.
Calculate the candidate 2 (C2)
� � , = � ∩
� � , = � � � � � ℎ� � � � � � �� � X100% (2)
Table 6. Candidate itemset C2
Itemset Support Itemset Support
2,14 10% 1,12 -
2,1 10% 1,18 10%
2,6 - 6,11 -
2,11 - 6,16 -
2,16 20% 6,12 -
2,12 - 6,18 20%
2,18 10% 11,16 10%
14,1 10% 11,12 10%
14,6 10% 11,18 10%
14,11 - 16,12 20%
14,16 20% 16,19 -
14,18 10% 16,18 10%
1,6 - 12,18 10%
1,11 - 19,18 -
1,16 10%
Table 7. Frequent itemset L2 that fulfills the min. Support
Itemset Support
2,6 20%
14,16 20%
6,18 20%
16,12 20%
Calculate the candidate 3 (C3)
� � , , = � ∩ ∩
� � , , =� � � � � ℎ� � � � � ��� , ,� X100% (3)
Table 8. Candidate itemset C3
Itemset Support
2,6,18 -
14,16,12 -
In Table 8. above the itemset in C3 does not exist in the transaction, therefore the rule
stops until here.
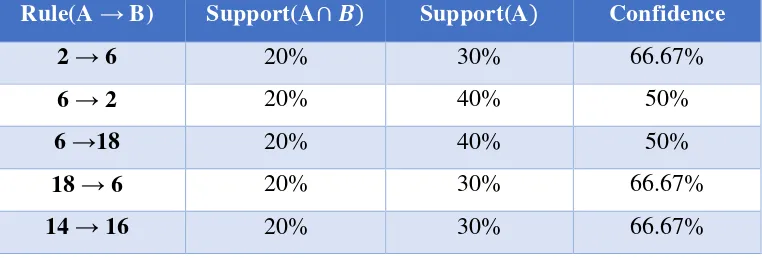
The process to find association rules that meet the minimum confidence 50%. And the
result of the rules will show in Table 9.
� = � | = � � � � � � ℎ� � � � � ℎ� �� � �� � % (4)
Table 9. The rules that fulfill the minimum confidence
Rule(A → B) Support(A∩ � Support(A Confidence
2 → 6 20% 30% 66.67%
6 → 2 20% 40% 50%
6 →18 20% 40% 50%
18 → 6 20% 30% 66.67%
16 → 14 20% 40% 50%
16 → 12 20% 40% 50%
12 → 16 20% 20% 100%
2.3 Review the Object of Study
Sinar Karya Furniture is a furniture company that located at Soekarno-Hatta road,
Km. 3, Tahunan, Jepara, Central Java, Indonesia. With only focus on furniture this
company is the one of the famous company in that area actually in Tahunan, regional
Jepara. The name of Sinar Karya Furniture itself comes from Sinar Karya Indah Furniture, with remove the word of “Indah” and become Sinar Karya Furniture. This company was first established in 1988 by (yanti’s father). The name of the company was change to Sinar Karya Furniture when missing Yanti (owner of the company) handle it
in 2000. This is the development business family from the father to his daughter.
The type of product also changes, from the original model until this modern era
finishing model. The models are followed by the customers request, mostly in finishing
form. The amount of products in this company are 30. For each product has several type,
the amount type of each product are 20. So the total of the products in this company are
more or less than 600. And for each product has owned store room, for instance, the
products that already purchased by customer, marketing products, and products that still
not finishing yet.
There are 80 the total of employee: Divided by two, which are production area that
consists of 60 employees and packing area that consist of 20 employees. Because in that
Company has a lot of product, it will help the owner to monitor the worker or the
employee itself. Related to the quality of the product the owner get from the raw frame
created by the craftsmen, after that polished to finish and processed into finished goods.
The marketing system itself not only in Java Island, another Island in Indonesia also
order their product moreover International area. The most location marketing is in local
area Jepara. There is a special place for the point of sale and inventory. Need new goods
2.4 Framework of Study
In this study proposed to search dependability between a product that purchased by
consumer simultaneously. To find in the database of sales transactions Sinar Karya
Furniture that much then using the data mining market basket analysis method apriori
algorithm. Rules which are formed must meet the minimum support and minimum
confidence.
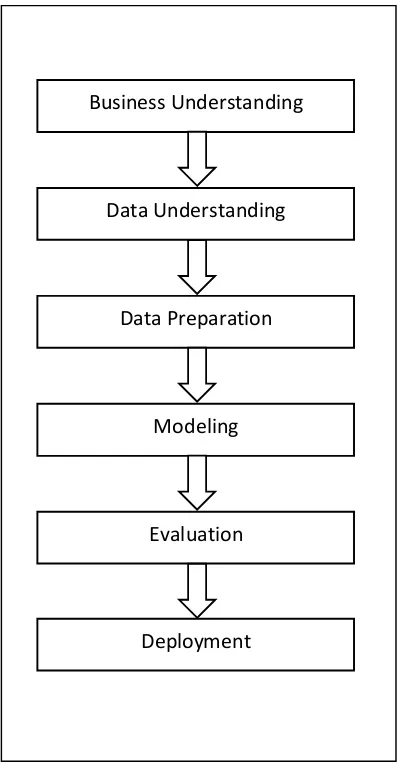
Figure 2. Framework of Study Block chart Business Understanding
Data Understanding
Data Preparation
Modeling
Evaluation
Based on Figure 2 the framework of study follows the CRISP-DM
(Cross-Industry Standard Process for Data Mining) steps to ensure the study is on the right path.
The business understanding phase will explain the company policy based on observation.
The data understanding phase will show the dataset used and the variables used in the
experiment. The data preparation phase will convert the raw data into usable one so that it
can be processed. The modeling phase will show the model of the method used in the
experiment. The evaluation phase will show the evaluation of the method with some