Full Terms & Conditions of access and use can be found at
http://www.tandfonline.com/action/journalInformation?journalCode=vjeb20
Download by: [Universitas Maritim Raja Ali Haji] Date: 11 January 2016, At: 22:20
Journal of Education for Business
ISSN: 0883-2323 (Print) 1940-3356 (Online) Journal homepage: http://www.tandfonline.com/loi/vjeb20
Business Statistics and Management Science
Online: Teaching Strategies and Assessment of
Student Learning
Rose Sebastianelli & Nabil Tamimi
To cite this article: Rose Sebastianelli & Nabil Tamimi (2011) Business Statistics and
Management Science Online: Teaching Strategies and Assessment of Student Learning, Journal of Education for Business, 86:6, 317-325, DOI: 10.1080/08832323.2010.525545
To link to this article: http://dx.doi.org/10.1080/08832323.2010.525545
Published online: 29 Aug 2011.
Submit your article to this journal
Article views: 650
View related articles
ISSN: 0883-2323 print / 1940-3356 online DOI: 10.1080/08832323.2010.525545
Business Statistics and Management Science Online:
Teaching Strategies and Assessment of Student
Learning
Rose Sebastianelli and Nabil Tamimi
University of Scranton, Scranton, Pennsylvania, USA
Given the expected rise in the number of online business degrees, issues regarding quality and assessment in online courses will become increasingly important. The authors focus on the suitability of online delivery for quantitative business courses, specifically business statistics and management science. They use multiple approaches to assess student learning. Their findings suggest that features involving professor–student interaction are the most useful, features promoting student–student interaction are the least useful, and discussion forums are of limited value in learning quantitative content. The authors also illustrate how questions embedded in an online final exam can be used to measure desired student learning outcomes.
Keywords: assessment, online, quantitative, student learning
Many reasons have been cited for the popularity of online in-struction from the student perspective (e.g., convenience) and that of the educational institution (e.g., cost-effectiveness). With some individuals predicting that the Internet will be the primary channel for delivering MBA programs in the fu-ture, it is not surprising that business educators have directed research toward improving students’ e-learning experiences (Kartha, 2006). As the number of business degree programs offered entirely online increases, issues related to quality and assessment of student learning in this mode of delivery will become more important, especially in light of satisfying the standards set forth for accreditation by the Association to Advance Collegiate Schools of Business (AACSB).
In the present study we explored the extent to which desired student learning outcomes in quantitative business courses, specifically business statistics and management sci-ence, are achievable in an online environment. Many individ-uals ascribe to the notion that learning quantitative content online is more challenging for students than learning non-quantitative subject matter. Some empirical evidence for this viewpoint exists. In a study comparing modes of delivery for various MBA courses, Terry (2007) found that online students scored, on average, significantly lower on the final
Correspondence should be addressed to Rose Sebastianelli, University of Scranton, Kania School of Management, Department of Operations & Information Management, 423 Brennan Hall, Scranton, PA 18510, USA. E-mail: sebastianer1@scranton.edu
exam than did those students taking the course on campus or in a hybrid format. However, when quantitative courses were removed from the mix, no significant difference in final exam scores among the three modes of delivery was found. Unlike previous studies, we did not seek to compare online and tradi-tional modes for teaching business statistics and management science. Instead, our focus was on investigating the degree to which desired student learning outcomes can be attained when these courses are delivered solely online. This seems justified, given the increasing numbers of students opting to earn their business degrees via the Internet.
Using a case-study approach, we collected data from stu-dents who completed 1 credit, foundation modules in either business statistics or management science offered as part of an online MBA program. These courses were delivered entirely online with no traditional face-to-face components. We used multiple measures of assessment to address the following research questions: a) What features of an on-line course are most useful for students to learn quantitative content? b) To what extent can specific student learning out-comes be achieved in an online quantitative business course? and c) Are different methods of evaluating student perfor-mance online equally well suited for quantitative business courses?
We used indirect (student survey) and direct (questions embedded in the final exam) measures of assessment. The survey asked students to rate the usefulness of specific on-line course features in learning quantitative business content.
318 R. SEBASTIANELLI AND N. TAMIMI
The items embedded in the final exam were linked to spe-cific student learning objectives. This latter approach, highly recommended and generally preferred over indirect methods, has been used to assess student learning in traditional courses (e.g., Price and Randall, 2008), but we have not found any studies reporting its use in online business courses.
Although it has been suggested that using a variety of tech-niques for evaluating student work enhances the perceived quality of online instruction (Gaytan & McEwen, 2007), it is not clear that all types of evaluative methods are equally suitable, given the challenges of learning quantitative con-tent online. We explored this issue empirically by examining student performance results (grades) on three different eval-uation methods (discussion posts, assignments, and a final exam).
It is important to determine how online delivery impacts student learning in business courses. A review of the literature indicates a lack of empirical data on the ability to achieve student learning outcomes online, in particular with respect to quantitative business courses. By addressing this issue, we hoped to gain insight on how to better design such courses and online teaching strategies for improving the e-learning experience with quantitative content.
BACKGROUND AND CONTEXT
We focused on two 1-credit foundation modules, business statistics and management science, which are offered regu-larly as part of an online MBA program. This online MBA program was initiated in spring 2008. Although enrollment in the program is approximately 270 students, only a subset of students who lack prerequisite knowledge are required to take foundation modules.
The online MBA program is offered in partnership with a provider of online education that helps with program devel-opment, marketing, student recruitment, and retention. As such, all online courses in the program follow best prac-tices such as consistent course design, modularized content, 24/7 technical support for students, explicit learning objec-tives, and extensive faculty training on ANGEL (a web-based platform used for course delivery). Class size is limited to 20 students. Multiple venues are used to encourage a high level of professor–student and student–student interaction. These include a mandatory discussion forum in which stu-dents respond to questions posed by the instructor, an “ask the instructor” forum for students to pose questions about course material or practice exercises, a student lounge for casual non-course-related discourse, and e-mail.
Given the problem-solving nature of business statistics and management science, some students experience frus-tration in an online environment because of insufficient background or aptitude in mathematics. Furthermore, the use of software (Minitab and Excel) is integral to learn-ing course content. Consequently, we added numerous
cus-tomized audio-video clips that illustrate the use of Minitab (in business statistics) and Excel (in management science). We produced these clips using Camtasia Studio, which al-lowed us to capture step-by-step screen movements and add voice-over narration explaining how to use the software and interpret results. These clips conform to the recommended online teaching practice of using simultaneous animation and narration in conversational spoken form (Swan, 2004). In ad-dition to including customized features designed to facilitate e-learning of technical material, the modules were similar with regard to assessing student performance. In each course final grades were based on discussion posts (20%), assign-ments that involved using software (60%), and a comprehen-sive multiple-choice final exam (20%).
These two modules were deliberately designed to be sim-ilar with regard to customized features (i.e., the audio-video clips) and types of evaluative methods used to assess student performance. Although virtually all MBA programs require that entering students have certain prerequisite knowledge, the options available to students for satisfying these require-ments vary. Because it would be difficult to find other schools offering 1-credit online modules in business statistics and management science with the same characteristics, we used the case-study approach to address our research questions. Our institution is a private, Jesuit institution located in the northeast United States. Total enrollment is approximately 5,000 students. The school of management, within which the online MBA program is offered, has been AACSB accredited since 1996. In addition to the online MBA program, a tradi-tional MBA program (established in 1960) and a bachelor of science degree program with nine majors are offered in the school.
LITERATURE REVIEW
Researchers focused on improving the quality of online business education and have explored a number of areas in an effort to identify effective practices. These areas in-clude, but are not limited to, the technology itself, online instructional methods, communication, interactivity, and the professor–student relationship. One area of e-learning that continues to present challenges is assessment. Not only have there been issues raised about assessing student performance (e.g., controversy about online exams), but studies that have assessed student learning in online business courses have been subject matter specific (e.g., Jones, Moeeni, & Ruby, 2005). Relatively few studies have dealt with online quantita-tive courses. Moreover, those that have dealt with quantitaquantita-tive courses have involved traditional in-class components. This is a serious limitation because learning quantitative content solely online may pose some unique challenges for students not otherwise encountered (e.g., overcoming poor mathemat-ics skills). Furthermore, most of these studies used indirect measures of assessment (e.g., student surveys) rather than
direct measures of student learning outcomes. Consequently, our research attempts to address some of these gaps in the existing literature.
Effective Practices
A number of articles have suggested approaches for assur-ing a quality online educational experience. Grandzol and Grandzol (2006), in a review of the literature on best prac-tices for online business education, provided guidance on course design and delivery, student services, and administra-tion. Consistent themes included standardizing course struc-ture, modularizing course content, giving prompt feedback, technical support for students, faculty training, and limiting class size. Gaytan and McEwen (2007) surveyed faculty and students about their perceptions regarding online education. They were interested in the types of instructional strategies and techniques for assessing student performance perceived to enhance the quality of online learning. The major recom-mendations from their findings were that (a) faculty should use a variety of techniques for evaluating student work such as exams, projects, portfolios, and discussion boards; and (b) students need meaningful and timely feedback.
Some faculty are skeptical about the use of online ex-ams to assess student performance. The obvious concern in an online course without proctors is the inability to verify the identity of the test taker. However, other issues also ex-ist, such as the open-book nature of the online environment and the impracticality of synchronized exams. Consequently, instructors may rely on other methods to evaluate student progress in online courses rather than administer exams. In light of such concerns, Khare and Lam (2008) evaluated online exams in terms of pedagogical and technical issues. They suggested that online exams should focus on mastery of knowledge and competence of skills rather than on factual recall. Based on data from an online MBA program, they concluded that a comprehensive online exam is one of sev-eral important assessment tools for measuring effectiveness and for continuous improvement.
Assessment
Studies that have dealt with the assessment of learning in on-line business courses typically focused on comparing student performance results achieved using web-based instruction to other modes of delivery (traditional and/or hybrid). A number of early articles published about undergraduate information technology courses suggested no difference in student perfor-mance, typically measured by overall grade, between web-based and traditional instruction (Jones et al., 2005; Piccoli, Ahmad, & Ives, 2001; Smeaton & Keogh, 1999). Recently, Lam (2009) pursued this line of research further by examin-ing the effect of student characteristics (e.g., GPA, gender), delivery modes (web-based vs. traditional) and evaluation methods (problem–solving vs. multiple-choice questions) on final exam scores in technical undergraduate courses. Based
on data from undergraduate programming and information systems courses, Lam found delivery mode to have no sig-nificant effect on final exam scores.
Along similar lines but with nontechnical subject matter, Daymont and Blau (2008) compared student grades in online and traditional sections of an undergraduate organizational management course. In addition to mode of delivery, they controlled for student characteristics such as gender, GPA, and major. In this study, students were able to self-select mode of delivery through course registration and online stu-dents had the option to attend traditional class meetings. They found that online students performed just as well as those in traditional sections.
Some studies showed that using specific web-based com-ponents actually improved student learning and satisfac-tion in business-related courses. Krentler and Willis-Flurry (2005) examined whether students’ participation in online threaded discussions enhanced student learning in an un-dergraduate principles of marketing course. Students’ posts to the discussion board were evaluated in terms of length and thoughtfulness, and their participation measured as the percentage of acceptable posts made. They found a signif-icant relationship between level of participation in online threaded discussions and student performance, albeit mod-erated by student characteristics. Smolira (2008) examined student perceptions about online homework in introductory finance courses at the undergraduate and MBA levels. Stu-dents reported that because of online homework they spent more time studying for the course and, in turn, improved their understanding of finance. Moreover, they preferred on-line over traditional homework and satisfaction was higher for MBA students compared to undergraduates. These re-sults are consistent with previous studies suggesting that stu-dents have favorable attitudes toward the use of technology in their traditional business courses (e.g., Clarke, Flaherty, & Mottner, 2001; Krentler & Williams, 2001).
Quantitative Business Online
Several studies have examined the use of web-based in-struction for teaching business statistics. McLaren (2004) compared the persistence (i.e., remaining in the course) and performance of students who were completing the required undergraduate business statistics course online versus in the classroom. Based on data from multiple sections, persistence was found to be dependent on the mode of delivery, with a greater likelihood for students in online sections to vanish from the course. Nonetheless, for students who persisted, performance (measured by course grade) was found to be in-dependent of delivery mode. Grandzol (2004) explored issues related to teaching MBA level statistics online. He compared online and traditional sections in terms of student evaluations of instructor and course, student perceptions of learning, and student performance on midterm and final exams. Although results were similar between the modes of delivery, online
320 R. SEBASTIANELLI AND N. TAMIMI
students were less satisfied with exams than traditional stu-dents. Moreover, student performance on the midterm and final exams yielded conflicting results regarding mode of delivery.
Kartha (2006) surveyed online and traditional students in undergraduate business statistics regarding their perceptions about the quality of instruction, overall satisfaction, and ef-fectiveness of delivery mode. Online students were able to get face-to-face help from faculty during office hours and were required to take their exams on campus with students from traditional sections. Still, online students were found to be less satisfied overall and specifically less satisfied with the mode of instruction and level of interaction in the course compared to traditional students. They also rated items such as instructor knowledge, ability to get help, and a deepened interest in the subject matter lower than traditional students. Given the importance of homework for developing stu-dent skills in problem solving, Palocsay and Stevens (2008) assessed the effectiveness of using web-based homework in teaching undergraduate business statistics. Comparing sev-eral web-based systems with textbook-based homework, they found that after controlling for other factors, namely teacher experience and student academic competence, the technique used to deliver homework is not significant in explaining stu-dent performance on a common multiple-choice final exam. There are fewer articles in the literature that have dealt with management science online. In an early study, Dellana, Collins, and West (2000) compared two modes of delivery for the undergraduate core course in management science, which they referred to as traditional and online. However, their on-line course involved face-to-face lecture supplemented with online lecture material, PowerPoint slides, threaded discus-sion, and e-mail. Nonetheless, they compared student perfor-mance between the two modes of delivery and elicited student feedback about the online components. Based on their find-ings, they concluded that the online option was just as effec-tive as the traditional course. More recently, Holsapple and Lee-Post (2006) introduced the E-Learning Success Model and tested it using an online quantitative business methods (i.e., management science) course. Their model was based on DeLone and McLean’s (2003) updated model. Although they measured e-learning success through course satisfaction and evaluation surveys, their study did not explicitly address the effectiveness of delivering management science online.
METHOD
Sections of the online business statistics and management science modules were randomly selected and all students in those sections were required to participate in a web-based survey regarding specific course features and activities. The questionnaire consisted of three sections. The first section asked students to rate each of 12 specific features of the course in terms of its usefulness in learning content on a
5-point Likert-type scale ranging from 1 (not useful) to 5 ( es-sential). These features were a) PowerPoint slides, b) lecture notes, c) audio-video clips, d) practice exercises, e) solutions to practice exercises, f) graded assignments, g) instructor feedback on assignments, (h) assigned reading from text, i) articles and supplementary reading, j) discussion forum questions, k) other students’ posts to the discussion forum, and l) an ask-the-instructor forum. The second section asked students to estimate the average number of hours spent each week on nine different course activities, many of which cor-responded to the course features. These activities were a) viewing PowerPoint slides, b) viewing audio-video clips, c) reading assigned material, d) working on practice exercises, e) completing required assignments, f) reading or writing posts on the discussion forum, g) reading or writing posts on the ask-the-instructor forum, h) studying and reviewing for exams, and i) reading and writing e-mails. The third section gathered demographic data such as gender and age.
Student responses to questions linked to specific course objectives and embedded in the final exam were retrieved from another set of randomly chosen online sections. Two student learning objectives were assessed in each course. For students completing the module in business statistics, we assessed their ability to a) apply appropriate statistical inference procedures to business problems and b) interpret correctly the results from statistical analysis. For students completing the module in management science, we assessed their ability to a) formulate business applications as linear programming problems and b) set up linear programming problems in an Excel spreadsheet. Several multiple-choice questions were used for each of the four student learning outcomes (see Appendices A and B for specific examples). Therefore, by computing the percentage of correct responses across students we could measure directly the extent to which specific student learning outcomes were being achieved.
Although there is some empirical evidence that students taking quantitative business courses online score lower on final exams than those in traditional or hybrid courses (Terry, 2007), no prior research has compared student performance on exams with other methods of evaluation in online quantita-tive business courses. Given the continued skepticism among faculty regarding the use of online exams, it follows that many instructors may be opting to eliminate exams altogether and use other methods to evaluate student performance in their online courses. Understanding how student performance on alternative methods of evaluation compares to student per-formance on exams is important, especially in light of re-sults suggesting that online exams are important assessment tools for measuring the effectiveness of online instruction (Khare & Lam, 2008). Moreover, it is not clear that evalua-tive methods that are appropriate for nonquantitaevalua-tive content (i.e., discussion forums) are suitable for quantitative content. The three methods we used to assess student performance in business statistics and management science were a) student posts to weekly discussion forums, b) weekly assignments
that involved the use of software, and c) a comprehensive multiple-choice final exam. In light of the previous discus-sion, we investigated the following hypotheses in our study:
Hypothesis 1 (H1): We hypothesized that student
perfor-mance would depend on the method used for evaluation (student grades would not be the same across different methods of evaluation).
H2: We hypothesized that here would be no relationship
between student performance on discussion forum posts and the final exam.
H3: We hypothesized that there would be no relationship
between student performance on weekly assignments and the final exam.
H4: We hypothesized that there would be no relationship
between student performance on discussion forum posts and weekly assignments.
To test these hypotheses, we retrieved the average grade on weekly discussion posts, the average grade on weekly assignments, and score on the comprehensive final exam for each student in randomly chosen online sections of business statistics and management science.
RESULTS
A total of 101 students completed the online survey. Of those, 61% were enrolled in management science (fewer students entering the program lack prerequisite knowledge in statis-tics). The majority were men (66%), were employed full-time (83%), and had part-time student status (60%). The average age was 31.5 years (age range=21–58 years) and, on aver-age, they had 9.5 years of managerial work experience (work experience range=0–35 years).
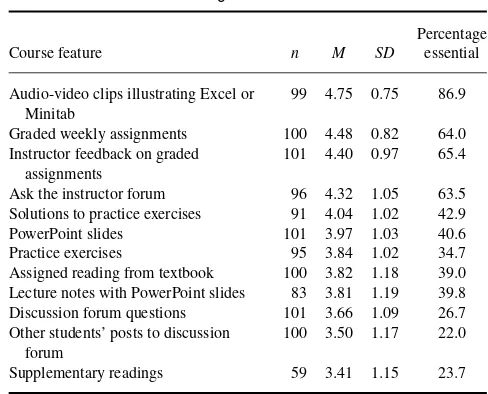
Mean ratings with standard deviations for each of the various course features are shown in Table 1. As is typical with ratings data, the distributions are somewhat skewed to the left. Consequently, we also report the percentage of stu-dents that rated each feature as essential to learning course content. Based on student feedback, the most useful course feature for learning quantitative content online was the cus-tomized Camtasia audio-video clips illustrating the use and interpretation of Excel and Minitab. Not only did this feature have the highest mean rating, but it had the lowest stan-dard deviation, indicating a high level of consistency among respondents. Furthermore, an overwhelming majority of stu-dents (87%) considered this feature as an essential course component. Other features rated highly by students were graded weekly assignments, instructor feedback on assign-ments, and the ask-the-instructor forum. Interestingly, those features perceived to be the least useful by students were the discussion forum questions, other students’ posts to the discussion forum, and supplementary readings.
TABLE 1
Student Ratings of Course Features
Percentage
Course feature n M SD essential
Audio-video clips illustrating Excel or Minitab Other students’ posts to discussion
forum
100 3.50 1.17 22.0
Supplementary readings 59 3.41 1.15 23.7
Summary statistics for the estimated time students spent each week, on average, for various course activities are given in Table 2. Because these data are skewed to the right, medi-ans and memedi-ans are reported (along with interquartile ranges and standard deviations). Students reported that they spent the most time on required weekly assignments, although there is substantial variability in the times reported. Other activities on which students allocated more time included studying, reading assigned material, and working on practice exercises.
TABLE 2
Student Time Spent on Course Activities (Average Number of Hours per Week)
Course activity n Median IQR M SD
Completing weekly graded
Viewing PowerPoint slides or lecture notes
100 1.00 1.00 1.78 1.80
Viewing video-audio clips illustrating Excel or Minitab
100 1.00 1.50 1.54 2.01
Reading/writing posts to the ask the instructor forum
91 0.50 1.00 0.87 1.78
Reading/writing e-mails 92 0.50 1.00 0.64 0.84 Total hours spent per week 97 10.00 10.00 12.35 7.08
Note.IQR=interquartile range.
322 R. SEBASTIANELLI AND N. TAMIMI
TABLE 3
Assessment Results for Embedded Questions on Student Learning Objectives
% Correct Learning objectives Item responses
Business statistics (n=43)
To apply appropriate statistical inference
procedures to business problems Q1 72
Q2 79
Q3 58
To interpret correctly the results from statistical
analysis Q1 58
Q2 26
Q3 37
Q4 65
Management science (n=50)
To formulate business applications as linear
programming problems Q1 58
Q2 84
Q3 84
Q4 68
To set up linear programming problems in an
Excel spreadsheet Q1 62
Q2 70
Q3 86
Q4 98
Direct Assessment
The subject matter in both of these modules was particularly suited for exams testing application and interpretation rather than memorization, so the open-book nature of unproctored online exams (with students having access to course materi-als) was not a serious concern. Three to four questions were embedded in the final exam to measure each of two student learning objectives in business statistics and management science. The percentage of students who correctly responded to each of these questions is shown in Table 3. Results for the business statistics module indicated that students had more difficulty interpreting results than applying the appro-priate statistical procedure. In management science, students appeared equally adept at formulating linear programming problems and setting them up in Excel spreadsheets. Typi-cally, targets are set to indicate satisfactory achievement of student learning outcomes. If we set our target for correct responses to at least 75%, it appears that desired student learning outcomes were more attainable in management sci-ence than in business statistics; however some difficulty is evident in both online courses.
Evaluative Methods for Student Performance
Conforming to recommended practices with regard to evalu-ating student performance, we used three different methods: a) weekly assignments that involved data analysis, problem solving, and interpretation using Minitab (in business statis-tics) and Excel (in management science); b) weekly dis-cussion forums in which students were required to make a
TABLE 4
Student Performance Results for Each Assessment Method
Both courses STAT MGT SCI (n=84) (n=34) (n=50)
Assessment method M Median M Median M Median
Discussion forum 91.49 93.79 89.32 91.71 92.98 97.37 Weekly assignments 86.49 88.43 85.04 86.90 87.48 92.87 Final exam 67.65 70.39 63.53 65.68 70.45 77.50
Note.Friedman Test: Both courses,S=87.08; STAT,S=33.94; MGT SCI,S=53.23 (all values significant atp<.0001).
minimum of two posts; and c) a comprehensive multiple-choice final exam that focused on application and interpreta-tion. We retrieved grades for a total of 84 students, 34 from business statistics and 50 from management science. Because the grade distributions had varying degrees of left skewness, we report the means and medians in Table 4. Students per-formed substantially poorer on the comprehensive final exam than on the other two modes of evaluation.
The multiple-choice final exams in business statistics and management science were evaluated for content validity and reliability. The validity of a test refers to the extent to which it measures what is intended to be measured. A test has con-tent validity if there is general agreement that the test items cover the entire domain of possible items the test should cover. To establish content validity, the exam items were critically reviewed by professors at the university who rou-tinely teach management science and business statistics. The professors indicated that the content of both exams was rep-resentative of all possible test items related to course content. The split-halves method was used to assess the reliability of the management science and business statistics exams. For each student, the test questions were split into halves based on odd and even number items and the scores summed. The Spearman-Brown split half coefficients were 0.84 and 0.77 for the management science and business statistics exams, respectively, thus demonstrating satisfactory levels of relia-bility.
In order to test our first hypothesis (student grades would not be the same across different methods of evaluation) we performed the nonparametric Friedman test. This test is an alternative to the randomized block analysis of vari-ance (ANOVA), the latter of which cannot be used, as our data violate the normality and equal variance assumptions. The Friedman test allowed us to determine if students’ per-formance (grade) depends on the evaluative method used while controlling for differences in characteristics among in-dividual students (e.g., mathematics aptitude) by blocking on student. We found grades on the final exam to be signifi-cantly lower than those for discussion posts and assignments, whether examining each course separately or combined (see
TABLE 5
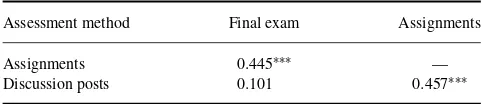
Pearson Correlations Among Student Assessment Methods (n=84)
Assessment method Final exam Assignments
Assignments 0.445∗∗∗ —
Discussion posts 0.101 0.457∗∗∗
∗∗∗p<.001.
Table 4 for calculated test statistics andpvalues). Therefore, our first hypothesis was supported.
In order to understand the relationships among the dif-ferent evaluative methods, we computed pairwise Pearson correlation coefficients (see Table 5). We found no statis-tically significant association between the grades students receive on discussion posts with those they earn on the final exam. Therefore,H2 was supported by the data. However,
there are moderate positive relationships between grades on assignments and the final exam, as well as between grades on discussion posts and assignments, both of which were found to be statistically significant. Consequently,H3andH4were
not supported by the data.
DISCUSSION AND IMPLICATIONS
Indirect assessment via student feedback in online business statistics and management science indicates that those fea-tures that involve professor–student interaction are the most useful in learning quantitative content. Customized audio-video clips produced by the instructor earned the high-est ratings from students, followed by graded assignments and the ask-the-instructor forum. Contrary to what may be the case in nonquantitative subjects, features that involve student–student interaction were perceived to be the least useful. Apparently, when learning technical, quantitative ma-terial, there is no substitute for faculty expertise in providing the necessary direction and guidance required to facilitate learning. Students reported spending more time each week, on average, in what can be considered offline activities, such as completing assignments, reviewing, studying, and reading, compared with online activities such as viewing PowerPoint slides or audio-video clips. This seems analogous to what occurs in traditional courses; students tend to (and should) spend more time on course activities (learning content) out-side rather than inout-side the classroom.
Because we used a variety of evaluative methods, we were able to compare them in assessing student perfor-mance. The use of discussion forums is recommended in online courses as a means of staying connected with students and promoting interaction. We made regular use of this feature by posing a question each week and re-quiring students to make a minimum of two posts, ei-ther to the original question or to oei-ther students’ posts,
which were graded. A grading rubric for discussion posts was provided to students for guidance. In addition, we administered a comprehensive final exam. As previously noted, there is plenty of faculty skepticism surrounding the use of online exams. Consequently, many online in-structors forego using exams to evaluate student perfor-mance; this is the case for many courses offered in our online MBA program. However, exams require students to review, study, and reflect on course material, thereby mak-ing them important learnmak-ing tools for quantitative subject matter.
Our findings indicate a disconnect between student per-formance in discussion forums and on the final exam. Several explanations are plausible. First, students may have less diffi-culty with the nontechnical, topical nature of issues addressed in discussion forum questions. It is not easy to develop forum questions that are not only quantitative but also generate a high level of discourse. This suggests that discussion forums, a mainstay of online education, may have limited usefulness in online quantitative courses (and probably should not be used as a primary means to evaluate student performance). Second, even with a rubric for guidance, grading discussion posts is somewhat subjective and may lead to some leniency in grading on the part of the instructor (resulting in grade in-flation). Third, the final exams, designed to accommodate the open-book nature of online courses, emphasize conceptual understanding and interpretation rather than facts that could be looked up. Still, knowing that they would have access to all course materials during the final may have given students a false sense of security, causing them to put less effort into ac-tually studying and reviewing course content. Although this activity was reportedly one for which they dedicated more time, on average, compared with other activities, the distri-bution of study times was highly skewed. An overwhelming majority of students (84%) spent 4 hr or less studying and reviewing material for the final.
Our study differs from previous studies in two impor-tant ways. First, we focused on quantitative business courses delivered entirely online, with no face-to-face traditional components. Second, we used multiple approaches to assess student learning that include indirect and direct measures. Using questions embedded in the final exam and setting tar-gets for student performance allows the direct assessment of student learning in online quantitative courses. To the best of our knowledge, no study has reported using such an approach in an effort to improve e-learning.
Of course our study is not without limitations. It is re-stricted in scope because it deals with two specific 1-credit foundation modules in one online MBA program at a sin-gle university. Given the particular design of these modules, and that prerequisite knowledge in management science is somewhat particular to our program, it is difficult to involve other schools and programs in this study. Nonetheless, our findings suggest that the online environment may pose some challenges in the teaching (and learning) of business statistics
324 R. SEBASTIANELLI AND N. TAMIMI
and management science. Consequently, continued research in this area appears justified.
Recommendations for Further Study
There is a need to develop effective strategies for teaching courses such as statistics and management science online to ensure a high-quality e-learning experience. One potential avenue for further study is to explore how discussion forums should be treated in courses such as business statistics and management science. Should their relative contribution to a student’s final grade be limited or can they be modified in some way to make them more consistent with the course’s stated student learning objectives? Future researchers should focus on the reasons for the apparent disconnect between a student’s performance on discussion posts and exams in these types of courses.
Broadening this study to include other quantitative busi-ness courses taught online (e.g., finance) presents another opportunity for further study. As long as the course involves discussion posts and exams, grade data can be analyzed to see if the disconnect between these two modes of evaluat-ing student performance is observed in quantitative business courses other than statistics and management science. De-pending on the course design, the student survey on course features and activities may also be carried out.
Another possibility is to perform more controlled studies that compare several online sections of the same quantita-tive course to determine the effecquantita-tiveness of specific course features. For example, online sections of business statistics, with and without audio-video clips, could be offered by the same instructor. Analyzing student data obtained from these sections may provide more definitive conclusions about the effectiveness of customized audio-video clips in learning course content.
The vast majority of empirical studies to date have focused on comparing online versus traditional education. There is a need for empirical studies to focus on identifying strate-gies that succeed online and on determining whether desired student learning outcomes are achievable in an online en-vironment. This seems particularly true when it comes to quantitative business courses.
REFERENCES
Clarke, I. III, Flaherty, T. B., & Mottner, S. (2001). Student perceptions of educational technology tools.Journal of Marketing Education,23, 169–177.
Daymont, T., & Blau, G. (2008). Student performance in online and tradi-tional sections of undergraduate management course.Journal of Behav-ioral and Applied Management,9, 275–294.
Dellana, S. A., Collins, W. H., & West, D. (2000). Online education in a man-agement science course-effectiveness and performance factors.Journal of Education for Business,1, 43–47.
DeLone, W. H., & McLean, E. R. (2003). The DeLone and McLean model of information systems success: A ten-year update.Journal of Management Information Systems,19(4), 9–30.
Gaytan, J., & McEwen, B. C. (2007). Effective online instructional and assessment strategies.The American Journal of Distance Education,2, 117–132.
Grandzol, J. R. (2004). Teaching MBA statistics online: A pedagogically sound process approach.Journal of Education for Business,4, 237–244. Grandzol, J. R., & Grandzol, C. J. (2006). Best practices for online busi-ness education.International Review of Research in Open and Distance Learning,7(1), 1–18.
Holsapple, C. W., & Lee-Post, A. (2006). Defining, assessing and promoting e-learning success: an information systems perspective.Decision Sciences Journal of Innovative Education,4(1), 67–85.
Jones, K. R., Moeeni, F., & Ruby, P. (2005). Comparing web-based con-tent delivery and instructor-led learning in a telecommunications course.
Journal of Information Systems Education,16, 265–271.
Kartha, C. P. (2006). Learning business statistics: Online vs. traditional.The Business Review, Cambridge,5(1), 27–32.
Khare, A., & Lam, H. (2008). Assessing student achievement and progress with online examinations: Some pedagogical and technical issues. Inter-national Journal on E-Learning,7, 383–402.
Krentler, K. A., & Williams, L. A. (2001). Electronic message boards to enhance student participation and learning. In S. Van Auken & R. P. Schlee (Eds.),Marketing Educators’ Association conference proceedings
(pp. 51–56). Denver, CO: Marketing Educators’ Association.
Krentler, L. A., & Willis-Flurry, L. A. (2005). Does technology enhance actual student learning? The case of online discussion boards.Journal of Education for Business,6, 316–321.
Lam, M. (2009). Effectiveness of web-based courses on technical learning.
Journal of Education for Business,6, 323–331.
McLaren, C. H. (2004). A comparison of student persistence and perfor-mance in online and classroom business statistics experiences.Decision Sciences Journal of Innovative Education,2(1), 1–10.
Palocsay, S. W., & Stevens, S. P. (2008). A study of the effectiveness of web-based homework in teaching undergraduate business statistics.Decision Sciences Journal of Innovative Education,6, 213–232.
Piccoli, G., Ahmad, R., & Ives, B. (2001). Web-based virtual learning en-vironments: A research framework and preliminary assessment of effec-tiveness in basic IT skills training.MIS Quarterly,25, 401–426. Price, B. A., & Randall, C. H. (2008). Assessing learning outcomes in
quantitative courses: Using embedded questions for direct assessment.
Journal of Education for Business,5, 288–294.
Smeaton, A. F., & Keogh, G. (1999). An analysis of the use of virtual delivery of undergraduate lectures.Computers & Education,32, 83–94. Smolira, J. C. (2008). Students’ perceptions of online homework in
intro-ductory finance courses.Journal of Education for Business,2, 90–94. Swan, K. (2004). Learning online: A review of current research on issues
of interface, teaching presence and learner characteristics. In J. Bourne and J. C. Moore (Eds.),Elements of quality online education: Into the mainstream(pp. 63–79). Newburyport, MA: The Sloan Consortium. Terry, N. (2007). Assessing instruction modes for master of business
ad-ministration (MBA) courses.Journal of Education for Business,4, 220– 225.
APPENDIX A
Example Questions Related to Objective 1 (Business Statistics)
Objective 1
Students completing the module in business statistics will be able to apply appropriate statistical inference procedures to business problems.
Q1: A study reported in theJournal of Occupational Psy-chologyinvestigated the relationship of employment status to mental health. A sample of 25 unemployed men was given a mental health questionnaire called the GHQ. They tested to see if the mean score exceeded 10. The population standard deviation was assumed to be unknown. Which test should they have used?
Q2: A company was interested in determining if there is a relationship between gender and job title (technical, sales, management) among its employees. What is the appropriate statistical test?
Q3: A large proportion of undergraduates work part time while attending college. A study was undertaken to determine if the number of hours worked per week affects GPA. What is the appropriate statistical procedure to analyze these data?
APPENDIX B
Example Questions Related to Objective 1 (Management Science)
Objective 1
Students completing the module in management science will be able to formulate business applications as linear pro-gramming problems.
Q1: How many constraints are there in a transportation problem that has 5 supply points and 6 demand points (ex-clude the non-negativity constraints)?
Q2: What is the correct constraint for node 3 in the fol-lowing transshipment problem?
Q3: What is the constraint for node 2 in the following maximal flow problem? Assume that node 1 is the source and node 4 is the sink (i.e., ending node).
Q4: What is the constraint for node 3 in the following shortest path problem? Assume that node 1 is the starting node and node 4 is the ending node.