Summary Seasonal ecophysiology, leaf structure and nitro-gen were measured in saplings of early (Populus grandidentata Michx. and Prunus serotina J.F. Ehrh.), middle (Fraxinus americana L. and Carya tomentosa Nutt.) and late (Acer rubrum L. and Cornus florida L.) successional tree species during severe drought on adjacent open and understory sites in central Pennsylvania, USA. Area-based net photosynthesis (A) and leaf conductance to water vapor diffusion (gwv) varied by site and species and were highest in open growing plants and early successional species at both the open and understory sites. In response to the period of maximum drought, both sunfleck and sun leaves of the early successional species exhibited smaller decreases in A than leaves of the other species. Shaded understory leaves of all species were more susceptible to drought than sun leaves and had negative midday A values during the middle and later growing season. Shaded understory leaves also displayed a reduced photosynthetic light response during the peak drought period. Sun leaves were thicker and had a greater mass per area (LMA) and nitrogen (N) content than shaded leaves, and early and middle successional species had higher N contents and concentrations than late succes-sional species. In both sunfleck and sun leaves, seasonal A was positively related to predawn leaf Ψ, gwv, LMA and N, and was negatively related to vapor pressure deficit, midday leaf Ψ and internal CO2. Although a significant amount of plasticity oc-curred in all species for most gas exchange and leaf structural parameters, middle successional species exhibited the largest degree of phenotypic plasticity between open and understory plants.
Keywords: net photosynthesis, phenotypic plasticity, shading, sunflecks, understory, water potential.
Introduction
Plants display nongenetic variation in morphology and physi-ology in response to environmental variation; a phenomenon knwon as phenotypic plasticity (Bradshaw 1965, Schlichting 1986, Abrams 1994). Although many ecophysiological studies have focused on phenotypic response to a single environmental factor, such as temperature, light or water (Fryer and Ledig 1972, Bazzaz and Carlson 1982, Abrams and Kubiske 1990, Walters et al. 1993, Kloeppel et al. 1993), there have been few
studies of phenotypic variation in relation to multiple stress interactions (Osmond 1983, Vance and Zaerr 1991).
Tree species of varying successional status exhibit differ-ences in ecophysiological responses and leaf structural charac-teristics. For example, early successional species often have higher light-saturated gas exchange rates, less non-stomatal inhibition of photosynthesis, lower osmotic potentials and more xerophytic leaves than late successional species (Bazzaz and Carlson 1982, Abrams and Kubiske 1990, Abrams et al. 1994, Kubiske and Abrams 1993, 1994). High gas exchange rates in many species are associated with high leaf nitrogen concentrations, although few studies have compared N con-centrations in early versus late successional tree species or in high- versus low-light phenotypes in relation to gas exchange rates (Reich et al. 1990, Ellsworth and Reich 1992). Early successional species may be capable of a wider range of phenotypic responses than middle or late successional species (Bazzaz 1979); however, there is little empirical evidence of this phenomenon in tree species (Bazzaz and Carlson 1982, Teskey and Shrestha 1985).
We measured seasonal gas exchange, water potential, leaf structure, leaf nitrogen and the microenvironment during a seasonal drought in six early, middle and late successional broadleaf tree species in adjacent open and understory sites in central Pennsylvania, USA. We used the data to test four hypotheses: (1) understory plants are more susceptible to drought from multiple stress interactions than open-growing plants, (2) early successional plants have higher gas exchange rates during well-watered and drought conditions in both open and understory sites than middle and late successional species, (3) physiological and morphological plasticity to open and understory environments vary among early, middle and late successional species, and (4) seasonal variations in ecophysi-ology among the contrasting species is related to variations in microenvironment, leaf structure and nitrogen in the open and understory environments.
Materials and methods
Study site
The study site is located approximately 4 km north of State College, in central Pennsylvania (40°48′52″ N, 77°55′50″ W).
Gas exchange, leaf structure and nitrogen in contrasting successional
tree species growing in open and understory sites during a drought
MARC D. ABRAMS and SCOTT A. MOSTOLLER
School of Forest Resources, The Pennsylvania State University, 4 Ferguson Building, University Park, PA 16802, USA
Received April 14, 1994
Average monthly minimum winter temperatures (December--February) range from −5 to −7 °C, and average maximum summer temperatures (June--August) range from 26 to 28 °C. Average monthly precipitation varies from 6.5 to 10.3 cm, with a total average annual precipitation of 97.9 cm. Braker (1981) characterized the soil as a deep, well-drained cherty limestone derivative with moderate permeability and high available water capacity. Soil texture is silt loam on the surface horizon and clay loam at 50 cm.
The study site included a 100-year-old relatively undis-turbed valley floor forest dominated by oak (Quercus alba L. and Q. velutina Lamb.) in the overstory and by mixed meso-phytic species, including Acer rubrum L., Prunus serotina J.F. Ehrh. and Fraxinus americana L., in the understory. A portion of this forest was clear-cut in 1986, and presently supports a diverse mixture of sapling-sized tree species. We selected saplings (between 1.4 and 3.0 m in height) from six species of contrasting successional status that occurred in both the mature forest understory and the adjacent clear-cut: A. rubrum and Cornus florida L. for the late successional group, F. americana and Carya tomentosa Nutt. for the middle successional group, and Populus grandidentata Michx. and P. serotina for the early successional group (cf. Burns and Honkala 1990). We studied five saplings per species.
Data collection
During the 1993 growing season, midday (1100--1300 h solar time) microenvironmental and plant ecophysiological meas-urements were made at the open and understory sites at 6--15-day intervals (n = 9) between May 27 and August 31 on relatively cloud-free days. All ecophysiological measurements were conducted on first flush or early season leaves. Predawn (0600 h solar time) leaf water potential (Ψ ) was measured on each sampling date on one leaf from each sapling with a pressure chamber (PMS Instrument Co., Corvallis, OR). Mid-day gas exchange, photosynthetic photon flux density (PPFD), and Ψ were measured on one mid-canopy leaf from each sapling. For the compound-leaf species, F. americana and C. tomentosa, gas exchange measurements were made on the terminal leaflet. Gas exchange, leaf temperature and PPFD measurements were made with an open-flow infrared gas analysis system (LCA-3, Analytical Development Co., Herts, U.K.). On the open site, only leaves that were in full sunlight were measured. In the understory, two types of leaves were measured, leaves growing in shade and leaves exposed to occasional sunflecks. Leaves were allowed to acclimate to sunflecks for a minimum of 15 min before measurement. Net photosynthesis (A), leaf conductance to water vapor diffusion (gwv), transpiration (J), leaf temperature, and vapor pressure deficit (VPD) were calculated according to von Caemmerer and Farquhar (1981). Gravimetric soil water of the upper 25 cm of soil was measured on four replicate samples from each site at each date.
On June 23, 1993, midcanopy leaves from each sapling in each species × site combination were collected for structural and nitrogen (N) analyses. Leaf thickness was measured in
three places on each leaf at the approximate midpoint between major veins by means of an ocular micrometer and light microscope. Three measurements of guard cell length were made and stomatal density was measured by means of acetate impressions of the abaxial surface of each leaf (Payne 1968). Leaf mass per area was calculated by dividing total area, measured with an LI3100 leaf area meter (Li-Cor Inc., Lincoln, NE), by dry weight (48 h at 80 °C). For the compound-leaf species, leaf area and mass per area were measured using the entire leaf, whereas leaf thickness, guard cell length and sto-matal density were measured on the terminal leaflet. Leaf N was analyzed by the Agricultural Analytical Services Labora-tory at Penn State University using a micro-Kjeldahl digest and an auto-analyzer. Additional measurements of leaf N and mass per area were made on each sapling on August 5, 1993, to evaluate temporal variation in these parameters (cf. Kloeppel et al. 1993).
Statistical analyses for microenvironmental, leaf ecophysi-ological, structural and chemical parameters included one-way, two-way and repeated measures analysis of variance (ANOVA) with general linear models, with time as a repeated measures factor and site as the whole plot factor (SAS Institute Inc., Cary, NC). Three-way ANOVA models with fixed effects were used to partition the variation of A, gwv and Ψ among sampling date, site, and species. Tukey’s multiple-range test (P < 0.05) was used for all multiple comparisons. The interre-lations between parameters were evaluated with Pearson prod-uct-moment correlation and least squares linear and nonlinear regression analyses.
Results
Microenvironment
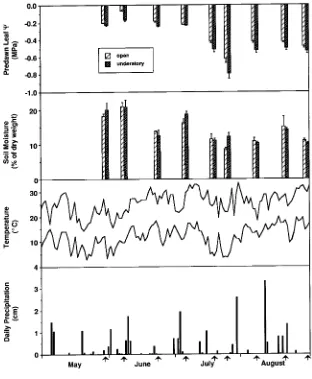
Daily average maximum and minimum monthly temperatures from May through August 1993 were within 0.3--l.0 °C of the 30-year means (Figure 1). However, mean monthly precipita-tion was 52 and 41% below the 30-year mean for May and June, respectively, and 16 and 18% below average for July and August, respectively. Soil water decreased (P < 0.05) at both the open and the understory study sites from a high of about 20% in late May and early June to about 10% in July and August, but was generally not significantly different between sites.
Seasonal mean photosynthetic photon flux density (PPFD) differed significantly between sites, being highest in the open site (1328 ± 23 µmol m−2 s−1) and lowest in the shaded understory site (47 ± 3 µmol m−2 s−1) (Figure 2). Leaves in understory sunflecks generally experienced decreasing PPFD as the season progressed, ranging from 1000 to 350 µmol m−2 s−1 and averaging 743 ± 33 µmol m−2 s−1 for the season. Leaf temperature increased during the season in all three light regimes, and was generally highest (P < 0.05) in leaves at the open site and lowest in understory leaves. Vapor pressure deficit (VPD) varied with sampling dates, but was highest in the open during the peak drought period and lowest in the understory across all dates.
Gas exchange and leaf water potential
In general, for each species, midday net photosynthesis (A) was high, intermediate and low in sun, sunfleck and shaded leaves, respectively (Figure 3), except for P. grandidentata and A. rubrum, where A in sun and sunfleck leaves was generally not significantly different until later in the season when drought effects were pronounced. Although A was low in all understory leaves, it was positive for all species in late May and June (overall mean = 0.05 to 0.45 µmol m−2 s−1), and consistently near or below zero (P < 0.05) in July and August (overall mean = −0.05 to −0.44 µmol m−2 s−1). Among species, Prunus serotina had the highest seasonal understory A, whereas P. grandidentata had the lowest understory A. For sunfleck leaves, A was generally highest early in the season and decreased (P < 0.05) during the season in most species, with the exception of F. americana. In contrast, species at the open site had more variable seasonal patterns of A, although, in most species, it was lowest on July 24 at the peak of the drought. From early to mid-season, A decreased across all species by an average of 11, 36 and 193% in sun, sunfleck and shaded leaves, respectively, (P < 0.05). Among the open-site species, A. rubrum and C. florida had the largest relative decreases in A (50 and 21%, respectively) from early to
mid-season.
Differences in gwv among species and light regimes were less pronounced than those observed for A (Figure 4). Al-though most species had higher (P < 0.05) gwv in sun than in understory leaves, gwv in sunfleck and understory leaves was often not statistically different. Drought had little effect on gwv on any sampling date, although gwv was slightly lower on July 24 than on other dates.
Predawn leaf water potential (Ψ) remained at −0.2 MPa from late May to early July, declined to −0.6 and −0.8 MPa in the open and understory sites, respectively, by late July, then increased during August at both sites (Figure 1). Predawn Ψ was usually lower (P < 0.05) in shaded leaves than in sun leaves, with seasonal means (± SE) of −0.41 ± 0.02 and −0.33
± 0.01 MPa, respectively, but it did not differ significantly among species within each site.
For all species, midday Ψ was significantly lower in sun than in shaded leaves (Figure 5). At both sites, there was a seasonal decline (P < 0.05) in Ψ in all species except in A. rubrum. In most species, there was a significant drop in midday Ψ during the period of maximum drought (July 18--24).
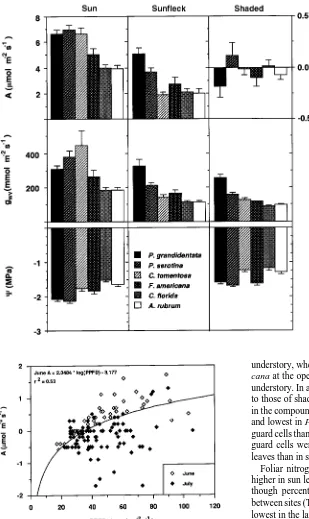
P. serotina and middle successional species C. tomentosa, and intermediate in F. americana (Figure 6). In shaded leaves, seasonal A was not significantly different from zero for any species. In sunfleck leaves, seasonal mean A was highest for P. grandidentata, intermediate in P. serotina, and not signifi-cantly different among the other species. Mean gwv of sun leaves followed the same ranking as A, except that the highest value was observed in C. tomentosa. Mean gwv in shaded and sunfleck leaves was highest in P. grandidentata and intermedi-ate in P. serotina. Midday Ψ was lowest in P. grandidentata and P. serotina at the open site and lowest in these species plus F. americana in the understory. Measurements of Ψ were not made on sunfleck leaves.
Partitioning of variances among sampling date, site, species and the interaction terms indicated that 94% of the variance in A was due to site. Although site was also the major source of variation for gwv (57%) and Ψ (68%), sampling date (i.e., drought effects) and species differences combined explained 30--32% of the variation, and interactions among these factors represented 1% of the variance.
There was a significant relationship between A and PPFD for late May--June, but not for July (Figure 7). Only about 20% of understory leaves had positive A values in July (mean A of
−0.16 ± 0.06 µmol m−2 s−1) compared to 90% in late May--June (mean A of 0.23 ± 0.15 µmol m−2 s−1), indicating that drought decreased the photosynthetic light response in these species.
Figure 2. Mean (± SE) midday photosynthetic photon flux density (PPFD), leaf temperature and vapor pressure deficit for sun (h), sunfleck (r) and shaded (j) leaves for six successional tree species at nine sampling dates.
Figure 3. Mean (± SE) midday net photo-synthesis (A) at nine sampling dates for sun (h), sunfleck (r) and shaded (j) leaves of six tree species. Pogr = Populus grandidentata, Prse = Prunus serotina, Cato = Carya tomentosa, Fram = Fraxinus americana, Acru = Acer rubrum, Cofl = Cornus florida.
Figure 4. Mean (± SE) midday leaf con-ductance to water vapor diffusion (gwv) at nine sampling dates for sun (h), sunfleck (r) and shaded (j) leaves of six tree spe-cies: Pogr = Populus grandidentata, Prse = Prunus serotina, Cato = Carya tomen-tosa, Fram = Fraxinus americana, Acru = Acer rubrum, Cofl = Cornus florida.
Leaf structure and nitrogen
Sun leaves were thicker (with the exception of P. serotina) and had higher mass per area (LMA) than shaded leaves (Table 1). Leaf thickness was highest in F. americana, C. tomentosa and P. serotina at the open sites and highest in P. serotina in the
understory, whereas LMA was generally highest for F. ameri-cana at the open sites and highest for P. grandidentata in the understory. In all species, leaf areas of sun leaves were similar to those of shaded leaves. At both sites, leaf area was highest in the compound-leaf species, F. americana and C. tomentosa, and lowest in P. serotina. These three species also had longer guard cells than the other species at both sites. In some species, guard cells were larger and stomatal densities higher in sun leaves than in shaded leaves.
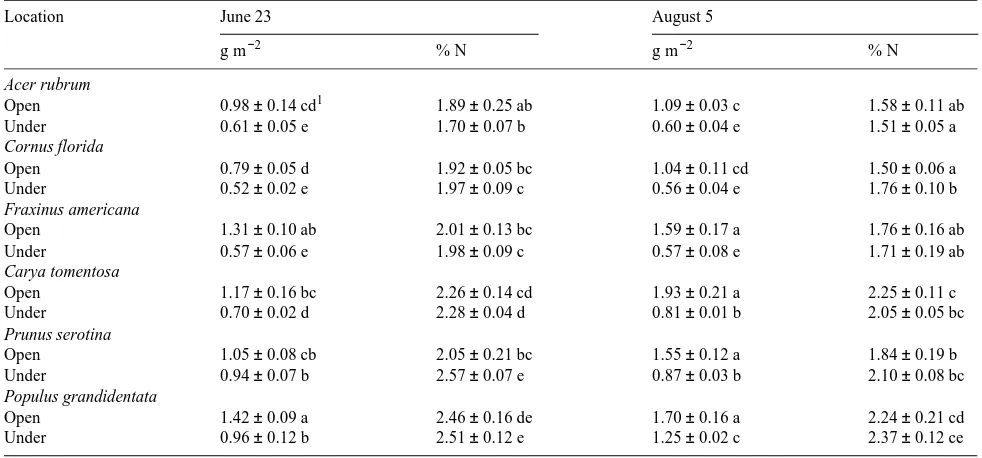
Foliar nitrogen content (expressed as mass per area) was higher in sun leaves than in shaded leaves of all species, even though percent N was generally not significantly different between sites (Table 2). Percent N varied among species, it was lowest in the late successional species, A. rubrum and C. flor-ida. Both sun and shaded leaves of these species also had low N contents, as did shaded leaves of F. americana. Percent N tended to decrease between June 23 and August 5, as LMA increased in both shaded and sun leaves. Nitrogen content of sun leaves tended to increase as the season progressed, whereas N content of shaded leaves remained constant, except for increases (P < 0.05) in C. tomentosa and P. grandidentata.
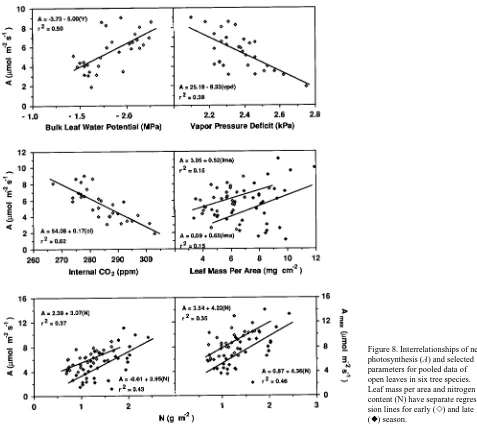
Interrelating gas exchange
Seasonal mean A in sun and sunfleck leaves was negatively related to midday Ψ, VPD and internal CO2 (Ci), and was positively related to early and late season leaf mass per area
Figure 6. Seasonal mean (± SE) midday net photosynthesis (A), leaf conductance to water vapor diffusion (gwv) and midday leaf water potential (Ψ) for sun, sunfleck and shaded leaves of six tree species. Leaf
Ψ was not measured in sunfleck leaves.
Figure 7. Net photosynthesis (A) versus photosynthetic photon flux density (PPFD) and fitted regression curve in shaded understory leaves pooled for six tree species at six sampling dates (including the predrought in June and peak drought in July). In July, A was not significantly related to PPFD.
(Figure 8). Seasonal A was positively correlated (r = 0.30) with predawn Ψ. Both mean and maximum A per plant were posi-tively related to early and late season N content.
Phenotypic plasticity
We compared phenotypic plasticity in light-saturated mean gas
exchange rates of sun and sunfleck leaves across the first three sampling periods (May 27, June 11 and June 23) when PAR values between sites were most similar (Figures 2 and 3). The middle successional species, F. americana and C. tomentosa, exhibited the largest relative differences in A and gwv between sun and sunfleck leaves (81 to 114%) , whereas P. grandiden-Table 1. Leaf structural characteristics (mean ± SE) for six hardwood tree species in understory and open locations in central Pennsylvania. Leaves collected on June 23 were measured for all five structural parameters, leaves collected on August 5 were only measured for leaf mass per area.
Location Leaf Guard-cell Stomatal Leaf mass Leaf mass Leaf
thickness length density per area 1 per area 2 area
(µm) (µm) (no. mm−2) (mg cm−2) (mg cm−2) (cm2)
Acer rubrum
Open 115.8 ± 4.9 c1 13.35 ± 0.44 a 371 ± 9 d 5.24 ± 0.41de 7.03 ± 0.48f 61.8 ± 7.2bc Under 88.8 ± 5.9 ab 12.45 ± 0.38 a 206 ± 16 c 3.55 ± 0.17bc 3.98 ± 0.21c 72.4 ± 6.0 c Cornus florida
Open 124.2 ± 2.4 cd 18.45 ± 0.91 bc 56 ± 6 a 4.10 ± 0.26 cd 6.95 ± 0.72 ef 58.5 ± 6.3 bc Under 96.9 ± 1.5 b 17.55 ± 0.77 b 44 ± 3 a 2.66 ± 0.15 a 3.20 ± 0.19 b 49.0 ± 5.0 c Fraxinus americana
Open 151.5 ± 6.9 e 24.15 ± 0.96 ef 79 ± 10 b 6.49 ± 0.22 ef 9.02 ± 0.34 g 218.2 ± 44.7 d Under 85.8 ± 3.1 a 19.95 ± 0.18 c 93 ± 16 b 2.86 ± 0.21 a 3.92 ± 0.18 c 266.9 ± 30.7 dc Carya tomentosa
Open 141.3 ± 15.4 de 26.55 ± 0.97 f 240 ± 5 c 5.32 ± 0.92 de 8.73 ± 1.14 fg 312.5 ± 41.3 ef Under 79.5 ± 2.4 a 21.75 ± 0.53 d 231 ± 6 c 3.05 ± 0.06 ab 3.94 ± 0.09 c 296.1 ± 53.8 ef Prunus serotina
Open 154.5 ± 8.2 e 23.70 ± 0.97 de 232 ± 3 c 5.24 ± 0.37 de 8.55 ± 0.55 fg 22.3 ± 1.8 a Under 144.9 ± 5.0 e 23.85 ± 0.37 e 100 ± 3 b 3.66 ± 0.11 bd 4.12 ± 0.08 c 26.8 ± 3.8 a Populus grandidentata
Open 118.8 ± 5.0 cd 12.30 ± 0.18 a 354 ± 3 d 5.77 ± 0.13 de 7.63 ± 0.35 fg 45.0 ± 6.9 b Under 96.6 ± 1.0 b 12.75 ± 0.41 a 206 ± 3 c 3.84 ± 0.08 bc 5.34 ± 0.26 d 42.0 ± 6.2 b
1 Means within a column followed by the same letter are not significantly different at P < 0.05. When comparing leaf mass per area, means in
both columns followed by the same letter are not significantly different at P < 0.05.
Table 2. Mean (± SE) foliar nitrogen content (g m−2) and % N for six hardwood tree species in understory versus open locations in central Pennsylvania. Samples were collected on two dates during the 1993 growing season.
Location June 23 August 5
g m−2 % N g m−2 % N
Acer rubrum
Open 0.98 ± 0.14 cd1 1.89 ± 0.25 ab 1.09 ± 0.03 c 1.58 ± 0.11 ab Under 0.61 ± 0.05 e 1.70 ± 0.07 b 0.60 ± 0.04 e 1.51 ± 0.05 a Cornus florida
Open 0.79 ± 0.05 d 1.92 ± 0.05 bc 1.04 ± 0.11 cd 1.50 ± 0.06 a Under 0.52 ± 0.02 e 1.97 ± 0.09 c 0.56 ± 0.04 e 1.76 ± 0.10 b Fraxinus americana
Open 1.31 ± 0.10 ab 2.01 ± 0.13 bc 1.59 ± 0.17 a 1.76 ± 0.16 ab Under 0.57 ± 0.06 e 1.98 ± 0.09 c 0.57 ± 0.08 e 1.71 ± 0.19 ab Carya tomentosa
Open 1.17 ± 0.16 bc 2.26 ± 0.14 cd 1.93 ± 0.21 a 2.25 ± 0.11 c Under 0.70 ± 0.02 d 2.28 ± 0.04 d 0.81 ± 0.01 b 2.05 ± 0.05 bc Prunus serotina
Open 1.05 ± 0.08 cb 2.05 ± 0.21 bc 1.55 ± 0.12 a 1.84 ± 0.19 b Under 0.94 ± 0.07 b 2.57 ± 0.07 e 0.87 ± 0.03 b 2.10 ± 0.08 bc Populus grandidentata
Open 1.42 ± 0.09 a 2.46 ± 0.16 de 1.70 ± 0.16 a 2.24 ± 0.21 cd Under 0.96 ± 0.12 b 2.51 ± 0.12 e 1.25 ± 0.02 c 2.37 ± 0.12 ce
tata exhibited the smallest differences (−14 to 4%). Fraxinus americana and C. tomentosa also exhibited the highest degree of phenotypic expression for leaf thickness (77--78%), guard cell length (21--22%) and (LMA 122--130%), although C. flor-ida and P. serotina also showed high plasticity for LMA (107--117%) (Table 1).
Discussion
Saplings in the open site experienced higher PPFD, leaf tem-peratures, and VPD than saplings in the understory. Saplings in the open also had higher predawn Ψ than understory sap-lings, indicating less competition for soil water (cf. Abrams 1986, Kloeppel et al. 1993). This difference was most pro-nounced during the peak drought on July 24 when predawn Ψ in open and understory study species varied by an average of 0.2 MPa. The increased opportunity for open-grown plants to rehydrate overnight might be partially responsible for their ability to maintain higher relative gas exchange rates than
understory plants during the drought (cf. Hinckley et al. 1978a).
During the drought period, gas exchange decreased more in shaded leaves than in sun leaves of all species, resulting in A values significantly less than zero in the shaded leaves. De-creased A coupled with deDe-creased photosynthetic light re-sponse suggest that shaded leaves were more sensitive to drought than sun leaves (cf. Abrams 1986, Abrams and Knapp 1986). Sunfleck leaves also exhibited a greater decrease in A in response to the drought than sun leaves, indicating that understory leaves have morphological and physiological limi-tations to high PPFD and drought compared with sun leaves. However, A was positive in understory sunfleck leaves during July and August, indicating that any potential carbon gain in droughted understory plants at midday was derived from the photosynthetic activity of sunfleck leaves. The large differ-ences in seasonal A among shaded, sunfleck and sun leaves accounted for almost all of the variance in A.
Despite large differences in A between sites, variation in gas Figure 8. Interrelationships of net photosynthesis (A) and selected parameters for pooled data of open leaves in six tree species. Leaf mass per area and nitrogen content (N) have separate regres-sion lines for early (e) and late (r) season.
exchange in sun leaves was distinct along successional lines, and there were smaller decreases in gas exchange in response to the drought in early than in later successional species (cf. Hinckley et al. 1978b, Bazzaz 1979, Bazzaz and Carlson 1982, Bahari et al. 1985, Abrams and Knapp 1986, Abrams et al. 1994). Both mean and minimum midday Ψ values were lower in the early successional species than in the later successional species. There were also differences between shaded and sun-fleck leaves in A, gwv and Ψ, indicating that the intrinsic ecophysiological variation between early and late successional species occurred, at least in the short-term, in both high and low irradiance environments (cf. Bazzaz and Carlson 1982, Abrams 1988, Kloeppel et al. 1993, Walters et al. 1993). In the case of understory P. serotina, relatively high A values prob-ably contributed to the success of this reputed early succes-sional species in the understory of many forests in eastern North America (Abrams 1992, Abrams et al. 1992, Horsley and Gottschalk 1993).
Plants grown at high irradiances typically produce leaves with greater thickness, mass per area, and stomatal density and smaller area per leaf than plants grown at low irradiances (Salisbury 1927, Jackson 1967, Carpenter and Smith 1981, Abrams and Kubiske 1990). Similar differences are also appar-ent in early versus late successional and xeric versus mesic species (Abrams and Kubiske 1990, Abrams et al. 1994). Leaf thickness and mass per area were higher in open than in understory plants and higher in early and middle successional species than in late successional species, which may have contributed to the increased drought tolerance in these plants (cf. Abrams 1986, Abrams and Kubiske 1990, Abrams et al. 1994). The seasonal increase in leaf mass per area and its positive relationship with A and gwv in sun and understory sunfleck leaves are typical of many temperate hardwood spe-cies (Jurik 1986, Reich et al. 1991a, Kloeppel et al. 1993, Abrams et al. 1994).
Leaf N content was highest in open growing, early and middle successional species and increased during the growing season. Similarly, Reich et al. (1990, 1991) reported higher seasonal N content in early successional Rubus, Quercus and Prunus species than in later successional Acer species. Higher leaf N in early than in late successional species is consistent with the physiological and morphological adaptations of early successional species that result in high rates of photosynthesis and growth in post-disturbance, high resource environments (cf. Bazzaz 1979). Mean area-based A was positively related to leaf N content or percent N, or both, in the open and understory sunfleck leaves (cf. Field and Mooney 1986, Evans 1989, Reich et al. 1990, 1991). Higher N content in sun leaves than in shaded leaves is consistent with the idea that N acquisition and allocation between plants and within canopies parallel gradients of light availability (Björkman and Holmgren 1963, Evans 1989, Ackerly 1992, Ellsworth and Reich 1992). How-ever, percent N was generally not significantly different be-tween shaded and sun leaves of the same species, indicating that higher N content of sun leaves was predominantly a function of increased LMA (cf. Björkman and Holmgren 1963, Ackerly 1992). The finding that percent N did not vary
be-tween plants in the open and understory sites may reflect differential N partitioning. In the understory, greater amounts of N may be partitioned into chlorophyll, whereas in the open more N may be partitioned into Rubisco, resulting in similar percent N values between sites (Evans 1989).
It has been suggested that early successional plants may have greater acclimation potential than later successional plants (Bazzaz 1979, Bazzaz and Carlson 1982). However, our results indicate that middle successional tree species may have greater phenotypic plasticity than early or late successional tree species. Middle successional species may have evolved adaptations to a broader range of ecosystem conditions than strictly early or late successional species, and therefore may be capable of greater phenotypic plasticity (T.J. Givnish, personal communication). Alternatively, successional status may not be closely associated with phenotypic plasticity. For example, the phenotypic plasticity exhibited by all our study species may be a dominant mechanism by which trees respond to contrasting microenvironmental conditions. Moreover, our study provides an example of function following form, in which open growing plants produced thicker leaves with higher mass per area and N content than understory plants, which, in turn, permitted higher gas exchange rates, lower leaf Ψ and greater tolerance to drought. On the other hand, understory plants of all species were able to maintain positive A at very low PAR early in the season and A of sunfleck leaves often approached A of sun leaves. Similar differences were apparent among the species, with early and mid-successional species having higher leaf N, A and mass per area and potentially greater tolerance to drought than the late successional species.
Acknowledgments
We thank C.J. Mikan for providing field assistance and M.E. Kubiske and D.A. Orwig for reviewing an earlier draft of the manuscript.
References
Abrams, M.D. 1986 Physiological plasticity in water relations and leaf structure of understory versus open-grown Cercis canadensis L. in northeast Kansas. Can. J. For. Res. 16:1170--1174.
Abrams, M.D. 1988. Comparative water relations of three succes-sional hardwood species in central Wisconsin. Tree Physiol. 4:263--273.
Abrams, M.D. 1992. Fire and the development of oak forests. Bios-cience 42:346--353.
Abrams, M.D. 1994. Genotypic and phenotypic variation as stress adaptations in temperate tree species: a review of several case studies. Tree Physiol. 14:833--842.
Abrams, M.D. and A.K. Knapp. 1986. Seasonal water relations of three gallery forest hardwood species in northeast Kansas. For. Sci. 32:687--696.
Abrams, M.D. and M.E. Kubiske. 1990. Leaf structural characteristics of 31 hardwood and conifer tree species in central Wisconsin: influence of light regime and shade tolerance rank. For. Ecol. Manage. 31:245--253.
Abrams, M.D., M.E. Kubiske and S.A. Mostoller. 1994. Relating wet and dry year ecophysiology to leaf structure in contrasting temper-ate tree species. Ecology 75:123--133.
Ackerly, D.D. 1992. Light, leaf age, and leaf nitrogen concentration in a tropical vine. Oecologia 89:596--600.
Bahari, Z.A., S.G. Pallardy and W.C. Parker. 1985. Photosynthesis, water relations, and drought adaptation in six woody species of oak-hickory forests in central Missouri. For. Sci. 31:557--569. Bazzaz, F.A. 1979. The physiological ecology of plant succession.
Annu. Rev. Ecol. Syst. 10:351--371.
Bazzaz, F.A. and R.W. Carlson 1982. Photosynthetic acclimation to variability in the light environment of early and late successional plants. Oecologia 54:313--316.
Björkman, O. and P. Holmgren. 1963. Adaptability of the photosyn-thetic apparatus to light intensity in ecotypes from exposed and shaded habitats. Physiol. Plant. 16:889--914.
Bradshaw, A.D. 1965. Evolutionary significance of phenotypic plas-ticity in plants. Adv. Genet. 13:115--155.
Braker, W.L. 1981. Soil survey of Center County, Pennsylvania. USDA Soil Conservation Service, 162 p.
Burns, R.M. and B.H. Honkala. 1990. Silvics of North America, Vol. 2. Hardwoods. USDA, Agricultural Handbook, 654 p.
Carpenter, S.B. and N.D. Smith. 1981. A comparative study of leaf thickness among southern Appalachian hardwoods. Can. J. Bot. 59:1393--1396.
Ellsworth, D.S. and P.B. Reich. 1992. Leaf mass per area, nitrogen content and photosynthetic carbon gain in Acer saccharum seed-lings in contrasting forest light environments. Funct. Ecol. 6:423--435.
Evans, J.R. 1989. Photosynthesis and nitrogen relationships in leaves of C3 plants. Oecologia 78:9--19.
Field, C. and H.A. Mooney. 1986. The photosynthesis--nitrogen rela-tionship in wild plants. In On the Economy of Plant Form and Function. Ed. T.J. Givnish. Cambridge University Press, Cam-bridge, U.K., pp 25--55.
Fryer, J.H. and F.T. Ledig. 1972. Microevolution of the photosynthetic temperature optimum in relation to the elevational complex gradi-ent. Can. J. Bot. 50:1231--1235.
Hinckley, T.M., J.P. Lassoie and S.W. Running. 1978a. Temporal and spatial variations in the water status of forest trees. For. Sci. Monogr. 20:1--72.
Hinckley, T.M., R.G. Aslin, R.R. Aubuchon, C.L. Metcalf and J.E. Roberts. 1978b. Leaf conductance and photosynthesis in four spe-cies of the oak--hickory forest type. For. Sci. 24:73--84.
Horsley, S.B. and K.W. Gottschalk. 1993. Leaf area and net photosyn-thesis during development of Prunus serotina seedlings. Tree Physiol 12:55--69.
Jackson, L.W.R. 1967. Effect of shade on leaf structure of deciduous tree species. Ecology 48:498--499.
Jurik, T.W. 1986. Temporal and spatial patterns of specific leaf weight in successional northern hardwood tree species. Am. J. Bot. 73:1083--1092.
Kloeppel, B.D., M.D. Abrams, and M.E. Kubiske. 1993. Seasonal ecophysiology and leaf morphology of four successional Pennsyl-vania barrens species in open versus understory environments. Can. J. For. Res. 23:181--189.
Kubiske, M.E. and M.D. Abrams. 1993. Stomatal and nonstomatal limitations of photosynthesis in 19 temperate tree species on con-trasting sites during wet and dry years. Plant Cell Environ. 16:1123--1129.
Kubiske, M.E. and M.D. Abrams. 1994. Ecophysiological analysis of temperate woody species on contrasting sites during wet and dry years. Oecologia. 98:303--312.
Osmond, C.B. 1983. Interactions between irradiance, nitrogen nutri-tion, and water stress in the sun-shade responses of Solanum dul-camara. Oecologia 57:316--321.
Payne, W.W. 1968. The use of cellulose acetate film for the production of epidermal casts. Ward’s Bull. 7:6--7.
Reich, P.B., M.D. Abrams, D.S. Ellsworth, E.L. Kruger and T.J. Tabone. 1990. Fire affects ecophysiology and community dynamics of central Wisconsin oak forest regeneration. Ecology 71:2179--2190.
Reich, P.B., M.B. Walters and D.S. Ellsworth. 1991. Leaf age and season influence the relationships between leaf nitrogen, leaf mass per area, and photosynthesis in maple and oak trees. Plant Cell Environ. 14:251--259.
Salisbury, E.J. 1927. On the causes and ecological significance of stomatal frequency, with special reference to the woodland flora. Phil. Trans. Royal Soc. London, 216B:1--65.
Schlichting, C.D. 1986. The evolution of phenotypic plasticity in plants. Annu. Rev. Ecol. Syst. 17:667--693.
Schulze, E.-D. 1986. Carbon dioxide and water vapor exchange in response to drought in the atmosphere and in the soil. Annu. Rev. Plant Physiol. 37:247--274.
Teskey, R.D. and R.B. Shrestha. 1985. A relationship between carbon dioxide, photosynthetic efficiency and shade tolerance. Physiol. Plant. 63:126--132.
Vance, N.C. and J.B. Zaerr. 1991. Influence of drought stress and low irradiance on plant water relations and structural constituents in needles of Pinus ponderosa seedlings. Tree Physiol. 8:175--184. von Caemmerer, S. and G.D. Farquhar. 1981. Some relationships
between the biochemistry of photosynthesis and the gas exchange of leaves. Planta 153:376--387.
Walters, M.B., E.L. Kruger and P.B. Reich. 1993. Growth, biomass distribution and CO2 exchange of northern hardwood seedlings in high and low light: relationships with successional status and shade tolerance. Oecologia 94:7--16.