PRELIMINARY REPORT OF THE
NATIONAL CATARACT SURGERY
REGISTRY
JANUARY TO MARCH 2002
Edited by
Goh Pik Pin
Hamidah Budin
Ong Poh Yan
Shamala Retnasabapathy
A publication of the
National Cataract Surgery Registry
And
Clinical Research Centre, Ministry of Health
Published by the
National Cataract Surgery Registry (NCSR) C/O Cataract Surgery Registry Unit
Clinical Research Centre (CRC) Level 3 Dermatology Block Jalan Pahang
50586 Kuala Lumpur Direct Line: 603-40455652
General Line: 603-40455408 Ext: 15/25 Fax: 603-40451252
Email [email protected]
Website: http://www.crc.gov.my/ncsr Disclaimer
The data reported here have been supplied by NCSR. The interpretation and reporting of these data are the responsibility of the Editor and in no way should be seen as an official policy or interpretation of the NCSR.
Suggested citation
The suggested citation for this report is as follows:
PRELIMINARY REPORT OF THE NATIONAL CATARACT SURGERY REGISTRY JANUARY TO MARCH 2002
Editor: Goh Pik Pin, Hamidah Budin, Ong Poh Yan, Shamala Retnasabapathy Kuala Lumpur, Malaysia 2003
Electronic version
Electronic version of this report can be downloaded at http://www.crc.gov.my/ncsr/preliminaryreport2003
Staff of the NCSR
Cataract Surgery Registry Unit CRC Ms. Lee Poe Poay
Ms. Premalatha A/P Ragovan
National Disease and Treatment Registry Unit CRC Dr. Rugayah Bakri
Biometrics Unit CRC
Ms. Celine Tsai, Information Security Officer Mr. Kevin Ng Hong Heng, Network Administrator
Mr. Adlan Abdul Rahman, Assistant Network Administrator Ms. Lim Jie Ying, Database Administrator
ACKNOWLEDGMENTS
The National Cataract Surgery Registry Committee would like to thank all who have contributed and worked hard to get this report on Preliminary Report of the National Cataract Surgery Registry January to March 2002, ready by January 2003.
We would like to especially thank the following:
All centres coordinators, and staff of Ophthalmology Departments from the various government hospitals, Universiti Sains Malaysia and Kem Terendak Military Hospital without whose dedication, hard work and timely data collection and submission, this report would not be possible.
Ms. Lee Poe Poay for her tireless and meticulous effort as data manager. Mr. Liang Hung Shan for data analysis and tabulation of results.
Ms. Premalatha A/P Ragovan who helps in data entry.
The Clinical Research Centre for its technical support, especially Dr. Lim Teck Onn whose tireless effort and guidance has made this report a realization, and Dr. Rugayah Bakri and Dr Ding Lay Ming for their continuous support in managing the Cataract Surgery Registry Unit.
The Ministry of Health, Malaysia for the Major Research Grant to set up the registry.
And of course not forgetting other financial sponsors: Alcon Laboratories (M) Sdn Bhd
Allergan
Pharmacia Ophthalmology Malaysia Sdn Bhd.
Thank you very much.
II
NATIONAL CATARACT SURGERY REGISTRY ADVISORY COMMITTEE
Dr. Mariam Ismail Chairperson
Head, Ophthalmology Service, MOH and Head, Ophthalmology Department
Hospital Selayang Dr. Goh Pik Pin Co-Chairperson
Ophthalmologist
Medical Development Division Ministry of Health
Dr. Gomathy Arumugam President
Ophthalmology Society
Malaysian Medical Association Dato' Dr. P. Balaravi Head
Ophthalmology Department Ipoh Hospital
Dr. Bethel Livingstone Head
Ophthalmology Department Seremban Hospital
Dr. Joseph Alagaratnam Head
Ophthalmology Department Kuala Lumpur Hospital Dr. Zuraidah Bt. Mustari Head
Ophthalmology Department Kuala Terengganu Hospital Dr. Hamidah Bt. Budin Ophthalmologist
Ophthalmology Department Hospital Kuala Lumpur Associate Prof. Dr. Muhaya Bt.
Mohamad
Dr. Hoh Hong Beng Pantai Medical Centre, Kuala Lumpur Dato Dr. Y. C. Lee Lee Eye Centre, Ipoh, Perak
Dr. Lim Teck Onn Head
Clinical Research Centre Kuala Lumpur Hospital Dr. Rugayah Bakri Head
Evidence Based Medicine Clinical Research Centre Kuala Lumpur Hospital
LIST OF PARTICIPATING CENTRES
1 94 Hospital Angkatan Tentera Kem Terendak
Head, Ophthalmology Department: Lt Kol (Dr) Nor Aishah Bt Malik Site Coordinator: S. Sjn Fauziah Bt Yusof
2 Alor Setar Hospital
Head, Ophthalmology Department: Dr. Ahmad Mat Saad Site Coordinator: T/AN Siti Aishah Salim 3 Duchess of Kent Sandakan Hospital
Head, Ophthalmology Department: Dr. Adarsh Bhardwaj Site Coordinator: MA Pius Kondu 4 Ipoh Hospital
Head, Ophthalmology Department: Dato Dr. P. Balaravi Site Coordinator: Dr. Indarjit Singh
MA Hj. Ismail 5 Kangar Hospital
Head, Ophthalmology Department: Dr. Mohd Nazri Sulaiman Site Coordinator: MA Abdul Rahman Daud 6 Kuala Lumpur Hospital
Head, Ophthalmology Department: Dr. Joseph Alagaratnam Site Coordinator: S/N Hazizah Mohamed
S/N Rosmah 7 Kuala Terengganu Hospital
Head, Ophthalmology Department: Dr. Zuraidah Mustari Site Coordinator: S/N Juriffah Mohd Amin 8 Hospital Umum Sarawak Kuching
Head, Ophthalmology Department: Dr. Intan Gudom
Site Coordinator: S/N Hjh Fatimah Hassan 9 Melaka Hospital
Head, Ophthalmology Department: Dr. S. Anusiah Site Coordinator: S/N Soon Bee Wan Dr. Meena Kandiah
10 Miri Hospital
Head, Ophthalmology Department: Dr. Daw Saw Thein Site Coordinator: MA Musa Zaini 11 Muar Hospital
IV 12 Pulau Pinang Hospital
Head, Ophthalmology Department: Dr. Elizabeth John Site Coordinator: En. Azahari B. Ahmad
MA Samsuddin Shahul Hamid 13 Queen Elizabeth Kota Kinabalu Hospital
Head, Ophthalmology Department: Dr. Dayang Sayalam Ag. Daud Site Coordinator: S/N Eugenie
14 Seremban Hospital
Head, Ophthalmology Department: Dr. Bethel Livingstone Site Coordinator: MA Thivagaran
15 Sibu Hospital
Head, Ophthalmology Department: Dr. Reddy
Site Coordinator: MA Morni B. Morsen 16 Sultanah Aminah Johor Bahru Hospital
Head, Ophthalmology Department: Dr. Loh Swee Seng Site Coordinator: Dr. Suresh
S/N Hapsah Bt Ali 17 Sungai Petani Hospital
Head, Ophthalmology Department: Dr. Foo Sui Wan Site Coordinator: S/N Zainab 18 Taiping Hospital
Head, Ophthalmology Department: Dr. Wong Sook Mun
Site Coordinator: S/N Norashah Bt Abd. Hamid 19 Tawau Hospital
Head, Ophthalmology Department: Dr. Ajit Majumder Site Coordinator: MA Bacho Bin Nordin 20 Teluk Intan Hospital
Head, Ophthalmology Department: Dr. Vivian Gong Hee Meng Site Coordinator: MA Halim
21 Tengku Ampuan Afzan Kuantan Hospital
Head, Ophthalmology Department: Dr. Vasantha Kumar Site Coordinator: MA Nadarajah
S/N Rosila
22 Tengku Ampuan Rahimah Klang Hospital
Head, Ophthalmology Department: Dr. Yogan Kanagasabai Site Coordinator: S/N Wong Huey Fen 23 Universiti Sains Malaysia Hospital
Head, Ophthalmology Department: Dr. Elias Hussein Site Coordinator: Dr. Zabri Kamarudin
CONTENTS
ACKNOWLEDGMENTS ... I NATIONAL CATARACT SURGERY REGISTRY ADVISORY COMMITTEE... II LIST OF PARTICIPATING CENTRES ... II
INTRODUCTION ...1
METHOD ...2
1. OBJECTIVES ...2
2. COVERAGE...2
3. DISEASE REGISTRATION METHODS...2
4. STATISTICAL ANALYSIS ...3
ABBREVIATIONS ...4
GLOSSARY ...4
REPORT SUMMARY...5
1 PATIENTS’ CHARACTERISTICS...5
2 CATARACT SURGERY PRACTICE ...6
3 CATARACT SURGERY OUTCOMES ...7
3.1 Cataract Surgery Complications- Intra-Operative ...7
3.2 Cataract Surgery Complications - Post-Operative ...8
3.3 Analysis On Cataract Surgery Visual Outcome...8
3.4 Post-operative Visual Acuity ...9
VI LIST OF TABLES
Table 1.1: Age distributions...12
Table 1.2: Gender distributions...14
Table 1.3: Number (%) of surgery done by month ...14
Table 1.4: Number of surgery done by centre ...15
Table 1.5: Distribution of care setting by centre...17
Table 1.6: Number of patients with first eye and second eye surgery ...18
Table 1.7: Number of patients with ocular co-morbidity ...19
Table 1.8: Number of patients with systemic co-morbidity ...20
Table 1.9: Pre-operative visual acuity measurement ...21
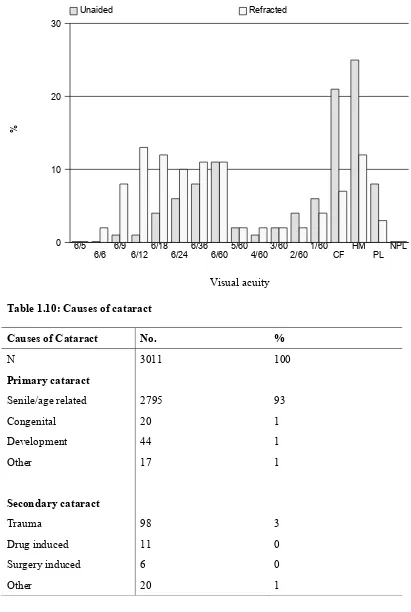
Table 1.10: Causes of cataract ...22
Table 2.1: Distribution of types of cataract surgery by centre...23
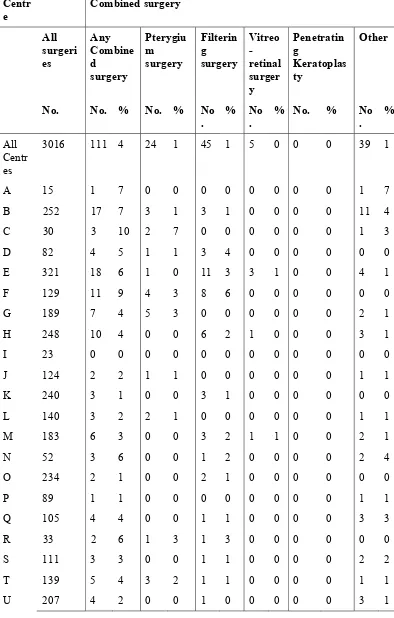
Table 2.2: Distribution of combined surgery by centre ...25
Table 2.3: Proportion of nature of cataract surgery ...26
Table 2.4: Type of anaesthesia...28
Table 2.5: Type of local anaesthesia...30
Table 2.6: Distribution of single and multiple local anaesthesia ...32
Table 2.7: Type of sedation given to patient who had local anaesthesia ...33
Table 2.8: Distribution of IOL placement...34
Table 2.9: Distribution of cataract surgery without IOL ...35
Table 2.10: Distribution of IOL- materials and types...36
Table 3.1.1: Distribution of intra-operative complications by type of cataract surgery ...37
Table 3.1.2: Distribution of intra-operative complications by combined surgery ...41
Table 3.1.3: Distribution of intra-operative complications by nature of cataract surgery...43
Table 3.1.4: Distribution of intra-operative complications by type of anaesthesia ...44
Table 3.1.5: Distribution of intra-operative complications by type of local anaesthesia ...45
Table 3.1.6: Distribution of intra-operative complications by single or multiple local anaesthesia ...47
Table 3.1.7: Distribution of intra-operative complications by type of sedation ...48
Table 3.1.8: Distribution of intra-operative complications by sedation ...50
Table 3.1.9: Distribution of intra-operative complications by cataract surgery with IOL...52
Table 3.2.1: Distribution of post-operative complications ...56
Table 3.3.1: Median follow-up period in weeks (Patients with only unaided vision, refraction was not performed)...57
Table 3.3.2: Median follow-up period in weeks (Patients with refracted vision)...57
Table 3.4.1: Distribution of post-operative VA ...58
Table 3.4.2: Distribution of post-operative refracted VA 6/12 or better at the last follow up, by surgery ...61
Table 3.4.3:Distribution of post-operative refracted VA 6/12 or better in relation to age and type of surgery ...63
Table 3.4.4: Distribution of post-operative refracted VA 6/12 or better in relation to gender and type of surgery...65
Table 3.4.5: Distribution of post-operative refracted VA 6/12 or better in relation to co-morbidity and type of surgery...66
Table 3.4.7: Distribution of post-operative refracted VA 6/12 or better in relation to nature of surgery and type of surgery ...68 Table 3.4.8: Distribution of post-operative refracted VA 6/12 or better in relation to
anaesthesia and type of surgery ...69 Table 3.4.9: Distribution of post-operative refracted VA 6/12 or better in relation to
combined surgery and type of surgery...71 Table 3.4.10: Distribution of post-operative refracted VA 6/12 or better in relation to
IOL and type of surgery...72 Table 3.5.1: Distribution of post- operative refracted VA improved by one or more
line of Snellen chart, at the last follow up ...72 Table 3.5.2: Distribution of post- operative refracted VA improved by one or more
line of Snellen chart, with and without ocular co-morbidity at the last follow up ...73 Table 3.5.3: Distribution of post- operative refracted VA improved by one or more
line of Snellen chart with intra-op complication and without intra-op
complication, at the last follow up...74 Table 3.5.4: Distribution of post -operative refracted VA improved by one or more
line of Snellen chart with systemic morbidity and without systemic co-morbidity, at the last follow up ...75 Table 3.6.1: Distribution of factors contributing to post- operative refracted VA of
VIII LIST OF FIGURES
Figure 1.1: Age distributions ...13
Figure 1.3: Number (%) of surgery...14
Figure 1.4: Number of surgery done by centre ...16
Figure 1.5: Distribution of day care and in patient by centre ...18
Figure 1.9: Pre-operative visual acuity measurement...22
Figure 2.1: Distribution of types of cataract surgery by centre ...24
Figure 2.4: Type of anaesthesia ...29
Figure 3.1.1.1: Distribution of intra-operative complication ...38
Figure 3.1.1.2: Distribution of intra-operative complication by posterior capsule rupture with vitreous loss and posterior capsule rupture without vitreous loss ...39
Figure 3.1.1.3: Distribution of intra-operative complication by zonular dialysis with vitreous loss and zonular dialysis without vitreous loss ...40
Figure 3.1.3: Distribution of intra-operative complications by nature of cataract surgery...43
Figure 3.1.04: Distribution of intra-operative complications by type of anaesthesia ..44
Figure 3.1.6: Distribution of intra-operative complications by single or multiple local anaesthesia ...47
Figure 3.1.7: Distribution of intra-operative complications by type of sedation...49
Figure 3.1.8: Distribution of intra-operative complications by sedation ...51
Figure 3.1.9: Distribution of intra-operative complications by cataract surgery with IOL...53
Figure 3.1.10: Distribution of intra-operative complications by cataract surgery without IOL...55
Figure 3.4.1.1: Distribution of post-operative VA...59
Figure 3.4.1.2: Cumulative distribution of visual acuity by pre- and post- operative unaided VA ...60
Figure 3.4.1.3: Cumulative distribution of visual acuity by pre- and post- operative refracted VA...60
INTRODUCTION
Estimates of the National Eye Survey in 1996 reveals that cataract is a significant cause of visual impairment in Malaysia, accounting for 39% and 36% of the causes of blindness and low vision respectively. There is a huge backlog of patients requiring cataract surgery. However information on cataract surgical services with regards to patient demography, quality of service and surgical outcomes is limited in this country. These information are essential for the planning, implementation and evaluation of cataract surgery services.
Cataract surgery registry refers to the ongoing systematic collection, analysis and interpretation of data related to cataract surgery. The National Cataract Surgery Registry (NCSR) was established on the 1st of January 2002. The registry is sponsored by both the Ophthalmology Service and the Clinical Research Centre of the Ministry of Health (MOH). Till date twenty-three hospitals have participated as source data producers (SDP) to the NCSR. They are the departments of Ophthalmology of the MOH hospitals (21 centres), Universiti Sains Malaysia and Kem Terendak of the Ministry of Defence. The Advisory Committee oversees the operations of the NCSR.
This report is a preliminary analysis of data collected on 3016 patients who underwent cataract surgery from January to March 2002, received from 22 source data producers. All patients whose complete records were received by the Cataract Surgery Registry Unit (CSRU) by June 2002 were included in the analysis. Data from one SDP were not analysed due to incomplete return.
On behalf of the CSRU, I would like to thank all the 23 hospitals that have participated in the NCSR since January 2002. We hope that we will continue to get the full support from all government and university hospitals and in the future the participation of private eye care providers. It is through this cooperation that we can obtain a true reflection of cataract surgery performed in Malaysia.
Dr. Mariam Ismail Chairman
2 METHOD
1. OBJECTIVES
The objectives of the National Cataract Surgery Registry are to:
• Determine the frequency and distribution of cataract surgery in Malaysia.
• Determine the outcomes, and factors influencing outcomes of cataract surgery.
• Evaluate cataract surgery services.
• Stimulate and facilitate research on cataract and its management.
2. COVERAGE
There are 29 Ophthalmology departments under Ministry of Health (MOH), one under Ministry of Defence and 3 Ophthalmology departments in the local universities. Of these public operated ophthalmology departments, 23 registered as source data producers from January 2002. This gave a coverage rate of 70% in the initial phase. If only the MOH hospitals were taken into account, the coverage rate was 72%.
3. DISEASE REGISTRATION METHODS
The organizational structure of NCSR consists of sponsors, advisory committee, cataract surgery registry unit (CSRU), and source data producers and target groups/users. The Ophthalmology Service and the Clinical Research Centre, both of the MOH, jointly sponsor the registry. The NCSR is governed by an advisory committee who oversees the operations of registry. The cataract surgery registry unit is based at the Clinical Research Centre, MOH, where collected data are analysed and reports generated. The source data producers are Departments of Ophthalmology, both public and private, where cataract surgeries are performed. The users or target groups are individuals or institutions to which the regular registry reports are addressed.
Three types of case record forms (CRF) are employed in data collection. The clerking forms gather information on patient demography, aetiology of cataract, pre-operative visual acuity, pre-existing ocular and systemic co-morbidities, first and second eye operation. The operative record forms capture data related to surgical procedure, such as type of cataract surgery, day care or non day care surgery, elective or emergency surgery, type of sedation, type of intraocular lens used, and intra-operative complications. The cataract outcome forms collect data on post-intra-operative complications, post-operative best corrected visual acuity by 12 weeks and possible factors for poor visual outcome of worse than 6/12. The CRFs are used as part of the clinical records. Regardless of age, all patients who undergo cataract or combined cataract surgery are included in the registry. The completed forms are sent to CSRU where data are analysed, interpreted and presented in regular report to be disseminated to the users. Participation of source data producers is entirely voluntary.
The data transferred to CSRU are kept strictly confidential with access only to authorized individual working in the CSRU. Till June 2002, 23 centres have participated in the registry. They are from MOH Ophthalmology departments (21 centres), military hospital (1 centre) and teaching hospital (1 centre).
4. STATISTICAL ANALYSIS
This preliminary report is a descriptive analysis. All data were described in terms of percentages except continuous data, like follow-up period where summary statistics like median, 25th percentile and 75th percentile were calculated, and for age, where median (50th percentile), mean, minimum and maximum value were calculated.
4 ABBREVIATIONS
CF Counting finger
CMO Cystoid macular oedema CSRU Cataract surgery registry unit
ECCE Extracapsular cataract extraction
HM Hand movement
IOL Intraocular lens
ICCE Intracapsular cataract extraction INTRA-OP Intra-operative
LA Lens aspiration
NPL No perception of light
PCO Posterior capsule opacification PCR Posterior capsule rapture
PE Phacoemulsification PL Perception of light
POST-OP Post-operative 2 IOL Imp Secondary IOL implantation
SDP Source data producers
VA Visual acuity
ZD Zonular dialysis
GLOSSARY
Advisory Committee
A committee, board, council, panel or group thereof that is established by the sponsors of the registry to govern the registry. The Advisory Committee shall direct and control the activities of the designated collaborating unit, which manages the day-to-day operations of the registry.
Advisory Committee member
An individual appointed to serve on an advisory committee. Members may have relevant expertise and/or represent the interest of SDP, users or donor.
Chairperson An advisory committee member who is appointed to preside at committee meetings and ensure that all rules of order and conduct are maintained during each session.
Disease Register The ongoing systematic collection, analysis and interpretation of a specific disease data essential to the planning, implementation and evaluation of clinical and public health practice, closely integrated with dissemination of these data to those who need to know. The final link in the chain is the application of these data to the management, prevention and control of the disease. A registration system includes a functional capacity for data collection, analysis and dissemination linked to clinical and public health programs. Secretary The individual responsible for an advisory committee’s overall
administrative management. He/she is ordinarily a staff provided by the designated collaborating unit for the purpose.
Source data producer
The individuals or institutions that report the required data to the registry.
REPORT SUMMARY
This preliminary report contains results from 3016 patients from 22 SDPs who had cataract surgery performed from January to March, 2002, and whose complete set of case record forms were received by the Cataract Surgery Registry Unit by June, 2002. The number thus did not reflect the true burden of cataract surgery in each centre. Data from one SDP were not analysed due to incomplete return.
1 PATIENTS’ CHARACTERISTICS
1.1 The mean age of the 3016 patients was 64 years (youngest 4 months, eldest 97 years old). More than half of the patients (56%) was 65 years and older. 1.2 Gender distribution was equal among the male and female patients.
1.3 Thirty five percent of cataract surgery was performed in January (1049), 27% in February (815) and 38% in March (1152).
1.4 Centre E had the most number of cataract operation (n=321, 11%) followed by centre B, H, K, O (all have 8%) and centre U (7%).
1.5 One third (35%) of the operation were done as day care surgery and two third (65%) were done as in-patient. Centre E had most of the operation done as day care (89%). Seven centres have no day care service.
1.6 Two third of the patients (70%) had first eye operation while one third of the patient (30%) had second eye operation (i.e. fellow eye has had cataract surgery before).
1.7 Ocular co-morbidity was noted in 28% of the patients. The most common anterior segment ocular co-morbidity was glaucoma, and for posterior segment was diabetic retinopathy. Five percent of the patients had poor view of the posterior segment and thus the posterior segment could not be assessed.
1.8 Systemic co-morbidity was noted in 55% of the patients. Hypertension was the most common systemic co-morbidity (33%) followed by diabetes mellitus (28%), ischaemic heart disease (9%) and asthma/ COAD (6%).
6 2 CATARACT SURGERY PRACTICE
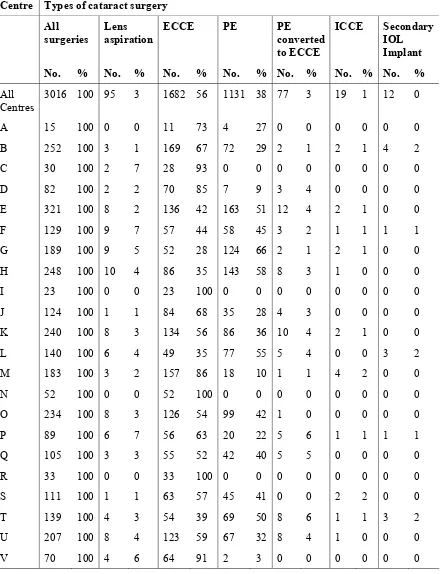
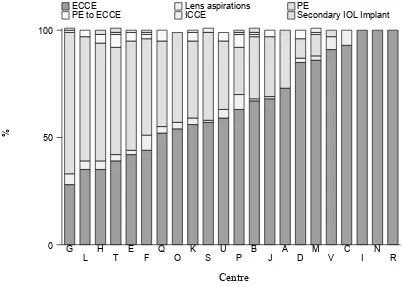
2.1 Extracapsular cataract extraction (ECCE) was the most common type of cataract surgery performed. Fifty six percent of cataract surgeries were ECCE, 38% were phacoemulsification (PE), 3% PE convert to ECCE, and 3% lens aspiration. Centres E, G, H, L and T performed 50% or more PE. The rest of the centres performed ECCE more frequently than other type of surgeries. Three centres i.e. I, N and R performed purely ECCE with no other type of cataract surgery.
2.2 Only 4% of the cataract surgery had some form of combined surgery. Centre C performed the highest number of combined surgery at 10%. Centre I was the only centre that did not perform any combined surgery.
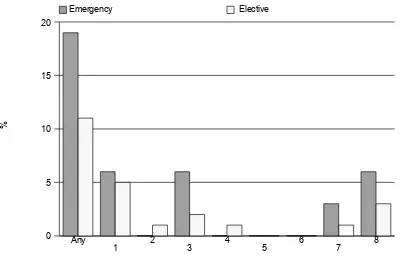
2.3 Almost all cataract surgeries were performed for elective reasons with only 1% of the cases requiring emergency cataract surgery. Emergency cataract surgery was performed at the range of 1% to 5% at all sites.
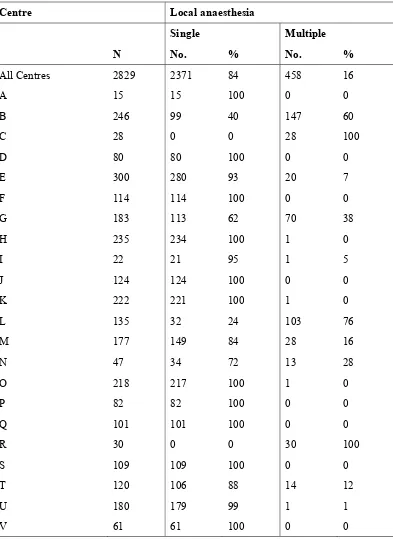
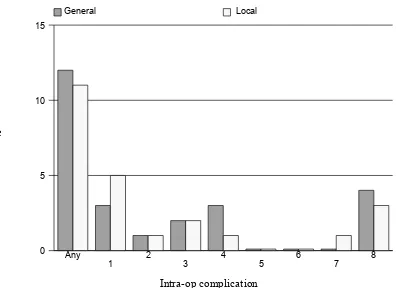
2.4 Ninety four percent of cataract surgeries were performed under local anaesthesia (LA). The frequency of LA utilisation ranged between 86-100% at the various centres. Six percent of all cataract surgeries were performed under general anaesthesia (GA). Centres F, N, T, U and V utilised GA more frequently than other sites and this varied between 10-14%.
2.5 For cataract surgeries performed under LA, the type of LA most commonly performed was the subtenon anaesthesia (48%). This was followed by retrobulbar anaesthesia (30%), peribulbar anaesthesia (19%) and topical anaesthesia (7%).
Generally more than one type of LA was utilised at each centre. Though there was usually a preference towards one type of LA at each centre. Six centres (A, C, I, J, N, R) however, performed purely one type of anaesthesia. Centre C and N performed only retrobulbar, centre A and J only subtenon, and centre R and I only peribulbar local anaesthesia.
Facial block was given to prevent over action of the orbicularis oculi and not for pain relieve during surgery. This was performed at only 8 of the 22 centres and centre C and R performed it on all cataract surgeries.
2.6 Cataract surgery in some cases may require more than one type of LA to provide adequate anaesthesia. Of the 94% cataract surgeries requiring LA, 84% needed only one type of LA with the remaining 16% requiring more than one type of LA. There were 11 centres that did not utilise multiple LA. This was in contrast to centre C and R where more than 90% of the patients were given more than one type of LA.
Among the 45% of patients who were given sedation, oral sedation was the commonest sedation used (37%). Intravenous, intravenous plus oral and intra-muscular were infrequently used and ranged between 2 to 4%.
2.8 Posterior chamber (PC) intraocular lens (IOL) was the normal placement of an IOL in uncomplicated surgeries. PC IOLs were placed in 97% of the cataract surgeries. Three centres (C, I, and Q) achieved 100% PC IOL placement. Anterior chamber (AC) IOL were placed in 3% of cases and this ranged between 0-8% at the various centres except for centre A where 20% of cases required AC IOL placement.
2.9 Of the 84 cases of cataract surgery in which no IOL was implanted, 67% were planned to have no implantation. Thirty three percent had been planned for IOL but lens implantation was not possible at the time of surgery.
2.10 IOLs made of PMMA were the most frequently used IOL (79%). This was followed by IOLs made of silicone (12%) and acrylic (10%)material. Seventy-seven percents of the eyes had non-foldable IOLs and 23% had foldable IOL. However, 77 of PMMA IOL material were recorded as foldable type, probably by mistake. While 17 of silicone IOL and 18 of acrylic IOL were recorded as non-foldable type, probably they were implanted without folding.
3 CATARACT SURGERY OUTCOMES
3.1 Cataract Surgery Complications- Intra-Operative
3.1.1 Overall, 11% of cataract surgeries had intra-operative complications. Posterior capsule rupture with vitreous loss was the commonest, contributing to 5% of total number of cataract surgery performed, followed by zonular dialysis with vitreous loss (2%).
As for surgical techniques, PE converted to ECCE cases had the highest complication rate (53%), followed by ICCE (42%). The rates of complication in ECCE and PE were almost similar, being 10% and 9% respectively.
3.1.2 In cases of combined surgeries, 16% had intra-operative complication. Complication was seen highest in those combined with vitreo-retinal surgery (40%). Of all the intra-operative complication, posterior capsule rupture with vitreous loss was the commonest (5%).
8
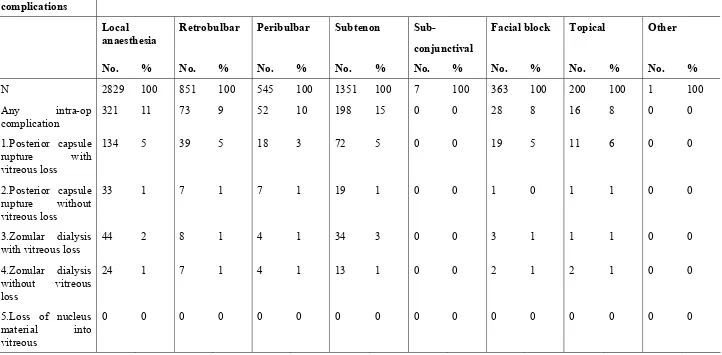
3.1.5 For local anaesthesia, subtenon, peribulbar, retrobulbar and topical anaesthesia contributed 15%, 10%, 9% and 8% of intra-operative complications respectively.
3.16 The occurrence of intra-operative complications was similar whether single (12%) or multiple (10%) local anaesthesia was given to the patients.
3.1.7 Intravenous (14%), intravenous plus oral (14%) and intra-muscular sedation (14%) had higher percentage of intra-operative complication compared to those given oral sedation alone (12%), or no sedation was given (11%).
It seems that patients who were not given sedation had lower intra-operative complications. It may be due to the fact that sedation was given following the occurrence of intra-operative complications.
3.1.8 Patients who were given multiple sedation had higher intra-operative complication (40%) compared to those who had no sedation (11%) and those who had single sedation (12%).
3.1.9 Patients who had ACIOL implanted had the highest rate of intra-operative complications (76%) as compared to those who had PCIOL (8%) and those who had scleral fixated IOL (0%). It is obvious that most patients who had ACIOL had intra-operative complications, particularly posterior capsular rupture, rendered implantation of PCIOL not possible. Among patients who had ACIOL, 63% of them had posterior capsule rupture( 51% with vitreous loss, 12% without vitreous loss).
3.1.10 For those without IOL implantation, patients who were planned but did not have IOL implanted had higher percent of intra-operative complications (76%), compared to those who were not planed to have IOL implantation (20%). Understandably, the earlier group was those who had intra-operative complication rendered IOL implantation impossible. Posterior capsule rupture with vitreous loss was the commonest complication among patients who were planed but did not have IOL implanted (14%).
3.2 Cataract Surgery Complications - Post-Operative
3.2.1 Overall, 14% of patients had post-operative complication. Central corneal oedema within 4 mm of visual axis (4 %) and astigmatism of more than 3 dioptres (4 %) were the most common complications.
3.3 Analysis On Cataract Surgery Visual Outcome
3.3.1 For patients who did not come for operative refraction, their median post-operative follow-up period was shorter, at 8.1 weeks. Two third of them had follow up period of 12.1 weeks.
3.4 Post-operative Visual Acuity
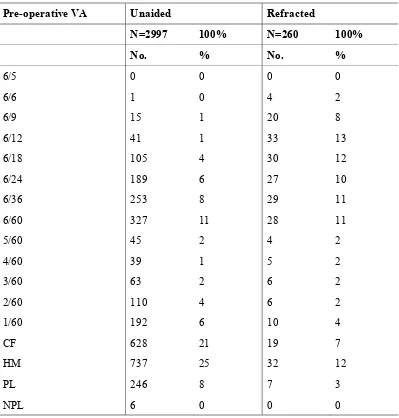
3.4. 1 Thirty-eight percents of the patients obtained postoperative unaided VA of 6/12 or better. The proportion of patient with this VA increased to 79% when refracted vision was used as the measurement.
Four percents of the operated eyes had post-operative refracted VA (7% with unaided VA) at the blindness range (VA 3/60 and worse).
In general, post-operative VA was better than pre-operative VA and the difference was more apparent when unaided VA was taken as the measurement.
3.4.2 As a whole, excluding patients who had secondary IOL implant, patients who had PE performed had the highest percentage of post-operative refracted VA 6/12 or better (86%), followed by ECCE (76%), PE converted to ECCE (71%). Patients who had ICCE had the lowest percentage (38%).
Patients who had PE seemed to have better visual outcome compared to ECCE, more apparent when we take unaided vision as the outcome measurement. This may be partly due to exclusion bias as 75 patients who had PE were converted to ECCE when there were intra-operative complications. 3.4.3 When comparing age group and visual outcome for ECCE group, patients
older than 85 years had the worst outcome while for PE group, patients younger than 35 years had the worst outcome.
3.4.4 In general, post-operative visual outcome was similar among male (81%) and female patients (78%).
3.4.5 As a whole, patients without ocular co-morbidity (84%) had higher percentage of post-operative refracted VA 6/12 or better as compared to those with ocular co-morbidity (66%).
Among patients who did not have ocular co-morbidity, PE (90%), followed by ECCE (81%), PE converted to ECCE (71%), ICCE (67%) and lens aspiration (67%) had post-operative refracted VA 6/12 or better.
In general, presence or absent of systemic co-morbidity did not affect post-operative visual outcome. But for patients who had PE converted to ECCE, percent of good visual outcome was much higher among those who did not have systemic co-morbidity (90% vs. 62%).
10
Among patients with operative complications, 62% of them had post-operative refracted VA 6/12 or better compared to 82% without post-post-operative complications.
In the absent of intra-operative or post-operative complication, PE had better outcome (88% and 87% respectively), compared to other types of surgery. It was also observed that, in the absent of intra-operative complications, patients who had PE converted to ECCE (77%) had similar visual outcome of 6/12 or better, compared to those who had ECCE (78%).
3.4.7 In general, patients who had elective surgery have better visual outcome (79%) compared to emergency cataract surgery (59%), except those who had ICCE where patients who had emergency cataract operation had better visual outcome (50% vs.36%). This might imply that when ICCE is indicated, especially among patients with lens related complications such as phacomorphic, phacolytic or lens subluxation, it may be better to perform ICCE earlier, as emergency operation.
3.4.8 Patients who had local anaesthesia had better visual outcome compared to those who had general anesthesia (80% and 60% respectively). This may be because majority of patients who required general anaesthesia were in the younger age group, or those who had pre-existing systemic or ocular co-morbidity.
Patients who had topical anaesthesia had the highest percentage with good visual outcome (86%). This may be due to the fact that most of them had PE performed.
Percentage of good visual outcome was similar among those who had retrobulbar, subtenon, and subconjunctival anaesthesia (80%). Those who had peribulbar had the lowest percent of good visual outcome (78%).
There is no difference in visual outcome among patients who were served and those who were not served oral sedation.
3.4.9 In general, patients who did not have combined surgeries had better visual outcome (80%) compared to those who had combined surgery (63%). However, the difference in visual outcome among those who had PE alone and PE combined with other surgeries were not much (84% vs. 80%).
3.4.10 Understandably, patients who had IOL implanted had higher percentage of post-operative refracted VA 6/12 or better (81%) compared to those who did not had IOL implanted (18%).
When comparing PMMA, silicone and acrylic lens materials in PE cases, there is not much difference in terms of visual outcome (84%, 89%, 89% of the patients achieved post-operative refracted VA 6/12 or better respectively). 3.5 Post-Op Refracted VA Improved By One Or More Line Of Snellen Chart
3.5.1 Out of 3016 patients, only 225 patients had refracted vision for both pre-operative and post-pre-operative assessment. Among these 225 patients, 91% of them had one or more line of visual improvement postoperatively, while 5% experienced no change in visual acuity and 4% had reduced vision. Among those with one line visual improvement, the highest percentage was ECCE (93%), followed by PE (91%), lens aspiration (86%) and PE converted to ECCE (67%). PE converted to ECCE had the highest percent of post-operative worsening of vision of one or more line (22 %), followed by lens aspiration (14%).
3.5.2 In the absent of ocular co-morbidity, visual improvement of one or more line was higher in ECCE (97%) and PE (91%) cases compared to PE converted to ECCE cases (63%).
3.5.3 In the absent of intra-operative complications, ECCE (93%) and PE (91%) have similar percentage of one line or more visual improvement.
3.5.4 In the absent of systemic co-morbidity, ECCE (93%) and PE (91%) have similar percentage of one line or more visual improvement.
3.6 Factors Contributing To Post-Op Refracted Visual Acuity Worse Than 6/12
3.6.1 Five hundred and three patients had postoperative visual acuity worse than 6/12, but causative factors were identified only in 75% of the patients (n=380).
PATIENTS’ CHARACTERISTICS
Age Distribution
Gender Distribution
Number (%) of Surgeries Done by Month
Number Surgery by Centre
Distribution of Care Setting by Centre
Number of Patient With Ocular Co-Morbidity
Number of Patient with Systemic Co-Morbidity
Pre-Operative Visual Acuity Measurement
1. PATIENTS’ CHARACTERISTICS
Table 1.1: Age distributions
Age, years N=3016
Mean 64.1 Median 66 Minimum 0.3 (4 months)
Maximum 97
% Distributions
Age group
<1 year 0
1-14 years 1
15-24 years 1
25-34 years 1
35-44 years 3
45-54 years 11
55-64 years 27
65-74 years 38
75-84 years 16
13 Figure 1.1: Age distributions
%
0 10 20 30 40
percent
<1
1-14
15-24
25-34
35-44 45-54
55-64
65-74
75-84 >=85
Table 1.2: Gender distributions
Gender N=3016
%
Male 50 Female 50
Table 1.3: Number (%) of surgery done by month
Month No. %
N 3016 100
January 1049 35
February 815 27
March 1152 38
Figure 1.3: Number (%) of surgery
15 Table 1.4: Number of surgery done by centre
Centre No. %
All sites 3016 100
A 15 0.5
B 252 8
C 30 1 D 82 3
E 321 11
F 129 4
G 189 6
H 248 8
I 23 1
J 124 4
K 240 8
L 140 5
M 183 6
N 52 2
O 234 8
P 89 3
Q 105 3
R 33 1
S 111 4
T 139 5
U 207 7
Figure 1.4: Number of surgery done by centre
N
o
.
o
f
su
rg
e
ri
e
s
0 100 200 300
number
A
B C D E F G H I J K L M N O P Q R S T U V
17 Table 1.5: Distribution of care setting by centre
Centre Care setting
N % Day care % In-patient
All sites 3016 35 65
A 15 0 100
B 252 16 84
C 30 0 100 D 82 6 94
E 321 89 11
F 129 65 35
G 189 74 26
H 248 83 17
I 23 0 100
J 124 2 98
K 240 57 43
L 140 11 89
M 183 7 93
N 52 0 100
O 234 15 85
P 89 19 81
Q 105 6 94
R 33 0 100
S 111 16 84
T 139 38 62
U 207 0 100
Figure 1.5: Distribution of day care and in patient by centre
Average day care (all patients)=35%
%
0 35 50 100
Day care In-patient
I
Table 1.6: Number of patients with first eye and second eye surgery
Type of surgery No. %
N 3016 100
First eye 2119 70
Second eye 897 30
19
Table 1.7: Number of patients with ocular co-morbidity
Patients with ocular co-morbidity No. %
N 3016 100
Patients with any ocular co-morbidity 847 28
Patients with specific ocular co-morbidity
Anterior segment
1.Pterygium involving the cornea 115 4
2.Corneal opacity 54 2
3.Glaucoma 188 6
4.Chronic uveitis 18 1
5.Pseudoexfoliation 38 1
Len related complications
1.Phacomorphic 26 1
2.Phacolytic 13 0
3.Subluxated/Disclosed 23 1
Posterior segment
1.Diabetic Retinopathy: Non Proliferative 152 5 2.Diabetic Retinopathy: Proliferative 42 1 3.Diabetic Retinopathy: CSME 20 1 4.Diabetic Retinopathy: Vitreous haemorrhage 20 1
5.ARMD 35 1
6.Other macular disease (includes hole or scar) 17 1 7.Optic nerve disease, any type 9 0 8.Retinal detachment 18 1
9.Cannot assessed 146 5
Miscellaneous
1.Amblyopia 13 0
2.Significant previous eye trauma 18 1 3.Pre-existing non glaucoma field defect 0 0
Table 1.8: Number of patients with systemic co-morbidity
Patients with systemic co-morbidity No. %
N 3016 100
Patients with any systemic co-morbidity 1644 55
Patients with specific systemic co-morbidity
1.Hypertension 998 33
2.Diabetes Mellitus 843 28 3.Ischaemic Heart Disease 278 9
4.Renal Failure 51 3
5.Cerebrovascular accident 19 1
6.COAD/Asthma 169 6
7.Hansen's Disease 3 0
8.Allergies 12 0
21
Table 1.9: Pre-operative visual acuity measurement
Pre-operative VA Unaided Refracted
N=2997 100% N=260 100%
No. % No. %
6/5 0 0 0 0
6/6 1 0 4 2
6/9 15 1 20 8
6/12 41 1 33 13
6/18 105 4 30 12
6/24 189 6 27 10
6/36 253 8 29 11
6/60 327 11 28 11
5/60 45 2 4 2
4/60 39 1 5 2
3/60 63 2 6 2
2/60 110 4 6 2
1/60 192 6 10 4
CF 628 21 19 7
HM 737 25 32 12
PL 246 8 7 3
Figure 1.9: Pre-operative visual acuity measurement Table 1.10: Causes of cataract
Causes of Cataract No. %
N 3011 100
Primary cataract
Senile/age related 2795 93
CATARACT SURGERY PRACTICE
Distribution of Types of Cataract Surgery by Centre
Distribution of Combined Surgery by Centre
Proportion of Nature of Cataract Surgery
Types of Anaesthesia
Types of Local Anaesthesia
Distribution of Single and Multiple Local Anaesthesia
Types of Sedation given to Patient Having Local Anaesthesia
Distribution of IOL Placement
Distribution of Cataract Surgery without IOL
2. CATARACT SURGICAL PRACTICES
Table 2.1: Distribution of types of cataract surgery by centre
Centre Types of cataract surgery
24
Figure 2.1: Distribution of types of cataract surgery by centre
%
0 50 100
ECCE Lens aspirations PE
PE to ECCE ICCE Secondary IOL Implant
26
Table 2.3: Proportion of nature of cataract surgery
Centre Nature of cataract surgery
Q 105 0 0 105 100
R 33 0 0 33 100
S 111 0 0 111 100
T 139 1 1 138 99
U 207 10 5 197 95
28 Table 2.4: Type of anaesthesia
Centre Types of anaesthesia
General Local
N No. % No. %
All Centres 3016 187 6 2829 94
A 15 0 0 15 100
B 252 6 2 246 98
C 30 2 7 28 93
D 82 2 2 80 98
E 321 21 7 300 93
F 129 15 12 114 88
G 189 6 3 183 97
H 248 13 5 235 95
I 23 1 4 22 96
J 124 0 0 124 100
K 240 18 8 222 93
L 140 5 4 135 96
M 183 6 3 177 97
N 52 5 10 47 90
O 234 16 7 218 93
P 89 7 8 82 92
Q 105 4 4 101 96
R 33 3 9 30 91
S 111 2 2 109 98
T 139 19 14 120 86
U 207 27 13 180 87
Figure 2.4: Type of anaesthesia
Average of local anesthesia =94%
30 Table 2.5: Type of local anaesthesia
Centre Local anaesthesia
Retrobulbar Peribulbar Subtenon Subconjunctival Facial block Topical Other
N No. % No. % No. % No. % No. % No. % No. %
All Centres
2829 851 30 545 19 1351 48 7 0 363 13 200 7 1 0
A 15 0 0 0 0 15 100 0 0 0 0 0 0 0 0
B 246 228 93 1 0 24 10 0 0 144 59 0 0 0 0
C 28 28 100 0 0 0 0 0 0 28 100 0 0 0 0
D 80 1 1 0 0 79 99 0 0 0 0 0 0 0 0
E 300 5 2 107 36 181 60 0 0 5 2 25 8 0 0
F 114 0 0 0 0 75 66 3 3 0 0 36 32 0 0
G 183 13 7 164 90 16 9 0 0 36 20 31 17 0 0
H 235 0 0 3 1 150 64 0 0 0 0 83 35 0 0
I 22 0 0 22 100 0 0 0 0 0 0 1 5 0 0
J 124 0 0 0 0 124 100 0 0 0 0 0 0 0 0
K 222 3 1 0 0 217 98 0 0 1 0 1 0 1 0
L 135 123 91 8 6 0 0 2 1 104 77 17 13 0 0
Centre Local anaesthesia
Retrobulbar Peribulbar Subtenon Subconjunctival Facial block Topical Other
N No. % No. % No. % No. % No. % No. % No. %
N 47 47 100 0 0 0 0 0 0 13 28 0 0 0 0
O 218 146 67 28 13 44 20 1 0 0 0 0 0 0 0
P 82 54 66 28 34 0 0 0 0 0 0 0 0 0 0
Q 101 1 1 0 0 95 94 0 0 0 0 5 5 0 0
R 30 0 0 30 100 0 0 0 0 30 100 0 0 0 0
S 109 24 22 0 0 85 78 0 0 0 0 0 0 0 0
T 120 107 89 4 3 23 19 0 0 0 0 0 0 0 0
U 180 42 23 1 1 137 76 0 0 0 0 1 1 0 0
V 61 2 3 1 2 58 95 0 0 0 0 0 0 0 0
32
Table 2.6: Distribution of single and multiple local anaesthesia
Centre Local anaesthesia
Single Multiple
N No. % No. %
All Centres 2829 2371 84 458 16
A 15 15 100 0 0
B 246 99 40 147 60
C 28 0 0 28 100
D 80 80 100 0 0
E 300 280 93 20 7
F 114 114 100 0 0
G 183 113 62 70 38
H 235 234 100 1 0
I 22 21 95 1 5
J 124 124 100 0 0
K 222 221 100 1 0
L 135 32 24 103 76
M 177 149 84 28 16
N 47 34 72 13 28
O 218 217 100 1 0
P 82 82 100 0 0
Q 101 101 100 0 0
R 30 0 0 30 100
S 109 109 100 0 0
T 120 106 88 14 12
U 180 179 99 1 1
34 Table 2.8: Distribution of IOL placement
Centre Cataract surgery with IOL
Table 2.9: Distribution of cataract surgery without IOL
Centre Cataract surgery without IOL
36
Table 2.10: Distribution of IOL- materials and types
IOL No. %
N 2932 100
Materials
PMMA 2302 79
Silicone 338 12
Acrylic 290 10
Other 2 0
Types
Foldable 672* 23
Non-foldable 2260** 77
CATARACT SURGERY OUTCOMES
Cataract Surgery Complications- Intra-Operative
Cataract Surgery Complications - Post-Operative
Analysis On Cataract Surgery Visual Outcome
Post-operative Visual Acuity
Post-Operative Refracted VA Improved By One Or More Line Of Snellen Chart
37 3. CATARACT SURGERY OUTCOMES
3.1: Cataract Surgery Complications
Table 3.1.1: Distribution of intra-operative complications by type of cataract surgery Type of intra-operative
complications
Types of cataract surgery
All surgeries Lens Aspiration ECCE PE PE to ECCE ICCE Secondary IOL Implant
No. % No. % No. % No. % No. % No. % No. %
N 3016 100 95 100 1682 100 1131 100 77 100 19 100 12 100
Any intra-op complication 343 11 16 17 176 10 102 9 41 53 8 42 0 0
1.Posterior capsule rupture with vitreous loss
140 5 4 4 70 4 42 4 24 31 0 0 0 0
2.Posterior capsule rupture without vitreous loss
34 1 2 2 18 1 6 1 4 5 4 21 0 0
3.Zonular dialysis with vitreous loss
47 2 5 5 18 1 23 2 1 1 0 0 0 0
4.Zonular dialysis without vitreous loss
29 1 3 3 13 1 11 1 2 3 0 0 0 0
5.Loss of nucleus material into vitreous
0 0 0 0 0 0 0 0 0 0 0 0 0 0
6.Choroidal/suprachoroidal haemorrhage
0 0 0 0 0 0 0 0 0 0 0 0 0 0
7.Significant trauma to cornea or iris
22 1 1 1 13 1 7 1 1 1 0 0 0 0
8.Other 79 3 2 2 47 3 16 1 10 13 4 21 0 0
Figure 3.1.1.1: Distribution of intra-operative complication
%
0 5 10
All surgeries
Any 1
2
3
4
5
6
7
8
Intra-operative complication
39
Figure 3.1.1.2: Distribution of intra-operative complication by posterior capsule rupture with vitreous loss and posterior capsule rupture without vitreous loss
%
0 10 20 30
PCR with vitreous loss PCR without vitreous loss
LA ECCE PE PE to ECC ICCE 2 IOL Imp
Type of cataract surgery
* LA= Lens aspiration
Figure 3.1.1.3: Distribution of intra-operative complication by zonular dialysis with vitreous loss and zonular dialysis without vitreous loss
%
0 2 4 6
41
Table 3.1.2: Distribution of intra-operative complications by combined surgery
Type of intra-operative
5.Loss of nucleus material into vitreous
0 0 0 0 0 0 0 0 0 0 0 0 0
6.Choroidal/suprachoroidal haemorrhage
Type of intra-operative complications
Combined surgery
All surgeries Any
Combined surgery
Pterygium surgery
Filtering surgery
Vitreo-retinal surgery
Penetrating Keratoplasty
Other
No. % No. % No. % No. % No. % No. % No. %
7.Significant trauma to cornea or iris
22 1 1 1 1 4 0 0 0 0 0 0 0
8.Other 79 3 5 5 1 4 2 4 1 20 0 2 5
43
Table 3.1.3: Distribution of intra-operative complications by nature of cataract surgery
Type of intra-operative complications Nature of cataract surgery
All patients Emergency Elective
No. % No. % No. %
N 3016 100 36 100 2980 100
Any intra-op complication 343 11 7 19 336 11 1.Posterior capsule rupture with vitreous
loss
140 5 2 6 138 5
2.Posterior capsule rupture without vitreous loss
34 1 0 0 34 1
3.Zonular dialysis with vitreous loss 47 2 2 6 45 2 4.Zonular dialysis without vitreous loss 29 1 0 0 29 1 5.Loss of nucleus material into vitreous 0 0 0 0 0 0 6.Choroidal/suprachoroidal haemorrhage 0 0 0 0 0 0 7.Significant trauma to cornea or iris 22 1 1 3 21 1
8.Other 79 3 2 6 77 3
Figure 3.1.3: Distribution of intra-operative complications by nature of cataract surgery
Emergency Elective
Table 3.1.4: Distribution of intra-operative complications by type of anaesthesia
Type of intra-operative complications Types of anaesthesia
All patients General Local
No. % No. % No. %
N 3016 100 187 100 2829 100
Any intra-op complication 343 11 22 12 321 11 1.Posterior capsule rupture with vitreous
loss
140 5 6 3 134 5 2.Posterior capsule rupture without
vitreous loss
34 1 1 1 33 1
3.Zonular dialysis with vitreous loss 47 2 3 2 44 2 4.Zonular dialysis without vitreous loss 29 1 5 3 24 1 5.Loss of nucleus material into vitreous 0 0 0 0 0 0 6.Choroidal/suprachoroidal haemorrhage 0 0 0 0 0 0 7.Significant trauma to cornea or iris 22 1 0 0 22 1
8.Other 79 3 8 4 71 3
Figure 3.1.04: Distribution of intra-operative complications by type of anaesthesia
%
0 5 10 15
General Local
Any
45
Table 3.1.5: Distribution of intra-operative complications by type of local anaesthesia
Type of intra-op complications
Types of local anaesthesia
Local anaesthesia
Retrobulbar Peribulbar Subtenon Sub-
conjunctival
Facial block Topical Other
Type of intra-op complications
Types of local anaesthesia
Local anaesthesia
Retrobulbar Peribulbar Subtenon Sub-
conjunctival
Facial block Topical Other
No. % No. % No. % No. % No. % No. % No. % No. %
6.Choroidal/suprac horoidal
haemorrhage
0 0 0 0 0 0 0 0 0 0 0 0 0 0 0 0
7.Significant
trauma to cornea or iris
22 1 4 0 5 1 13 1 0 0 0 0 0 0 0 0
8.Other 71 3 12 1 16 3 48 4 0 0 3 1 1 1 0 0
47
Table 3.1.6: Distribution of intra-operative complications by single or multiple local anaesthesia
Type of intra-operative complications Local anaesthesia
Single Multiple
No. % No. %
N 2371 100 458 100
Any intra-op complication 277 12 44 10 1.Posterior capsule rupture with vitreous
loss
110 5 24 5
2.Posterior capsule rupture without vitreous loss
31 1 2 0
3.Zonular dialysis with vitreous loss 39 2 5 1 4.Zonular dialysis without vitreous loss 20 1 4 1 5.Loss of nucleus material into vitreous 0 0 0 0
6.Choroidal/suprachoroidal haemorrhage 0 0 0 0 7.Significant trauma to cornea or iris 22 1 0 0
8.Other 62 3 9 2
Figure 3.1.6: Distribution of intra-operative complications by single or multiple local anaesthesia
Single anaesthesia Multiple anaesthesia
Table 3.1.7: Distribution of intra-operative complications by type of sedation
Type of intra-operative complications Types of sedation
No sedation Oral alone Intravenous
alone
Intravenous plus oral
Intramuscular
No. % No. % No. % No. % No. %
N 1567 100 1058 100 50 100 121 100
Any intra-op complication 167 11 128 12 7 14 6 14 17 14 1.Posterior capsule rupture with vitreous
loss
65 4 55 5 2 4 6 14 9 7
2.Posterior capsule rupture without vitreous loss
20 1 11 1 0 0 0 0 2 2
3.Zonular dialysis with vitreous loss 26 2 16 2 1 2 0 0 1 1 4.Zonular dialysis without vitreous loss 14 1 9 1 0 0 0 0 1 1
5.Loss of nucleus material into vitreous 0 0 0 0 0 0 0 0 0 0 6.Choroidal/suprachoroidal haemorrhage 0 0 0 0 0 0 0 0 0 0 7.Significant trauma to cornea or iris 15 1 7 1 0 0 0 0 1 1
8.Other 32 2 31 3 4 8 0 0 4 3
49
Figure 3.1.7: Distribution of intra-operative complications by type of sedation
%
0 5 10 15
No sedation Oral Intravenous Intravenous plus oral Intramuscular
Any
1
2
3
4
5
6
7
8
Table 3.1.8: Distribution of intra-operative complications by sedation
Type of intra-operative complications
Sedation
No sedation Single Multiple
No. % No. % No. %
N 1567 100 1252 100 10 100
Any intra-op complication 167 11 150 12 4 40 1.Posterior capsule rupture with
vitreous loss
65 4 66 5 3 30
2.Posterior capsule rupture without vitreous loss
20 1 13 1 0 0
3.Zonular dialysis with vitreous loss 26 2 18 1 0 0 4.Zonular dialysis without vitreous
loss
14 1 10 1 0 0
5.Loss of nucleus material into vitreous
0 0 0 0 0 0
6.Choroidal/suprachoroidal haemorrhage
0 0 0 0 0 0
7.Significant trauma to cornea or iris 15 1 6 0 1 10
51
Figure 3.1.8: Distribution of intra-operative complications by sedation
%
0 10 20 30 40
No Sedation Single Sedation
Multiple Sedation
Any
1 2 3 4 5 6 7 8
Intra-op complication
Table 3.1.9: Distribution of intra-operative complications by cataract surgery with IOL
Type of intra-operative complications
Cataract surgery with IOL
All patients
53
Figure 3.1.9: Distribution of intra-operative complications by cataract surgery with IOL
%
0 20 40 60 80
Posterior Anterior
Scleral
Any
1 2 3 4 5 6 7 8
Table 3.1.10: Distribution of intra-operative complications by cataract surgery without IOL
Type of intra-operative complications
Cataract surgery without IOL
All patients
5.Loss of nucleus material into vitreous
0 0 0 0 0 0
6.Choroidal/suprachoroidal haemorrhage
0 0 0 0 0 0
7.Significant trauma to cornea or iris
1 1 1 4 0 0
55
Figure 3.1.10: Distribution of intra-operative complications by cataract surgery without IOL
%
0 20 40 60 80
IOL Planned No IOL was planned
Any
1 2 3 4 5 6 7 8
3.2 Post-Operative Complications
Table 3.2.1: Distribution of post-operative complications
Post-operative complications No. %
N 3016 100
Patients with any post-op complication 429 14 Patients with specific post-op complication
1.Central oedema within 4mm of visual axis 118 4 2.Raised IOP of more than 30mmHg 46 2
3.Suture abscess 11 0
4.Severe iritis with fibrin 13 0 5.Iris prolapse/wound dehiscence 8 0 6.Vitreous incarceration into wad 5 0 7.Vitreous in AC touching cornea 2 0 8.IOL decentration/dislocation 8 0 9.Cystoid macular oedema 21 1
10.Endophathalmitis 2 0
11.New retinal break 0 0
12.Retinal detachment 4 0 13.Astigmation of > 3 dioptres 134 4 14.Posterior capsule opacification 31 1
57 3.3 Analysis On Cataract Surgery Outcome
Table 3.3.1: Median follow-up period in weeks (Patients with only unaided vision, refraction was not performed)
Type of surgery N Median 25th percentile
75th percentile
All surgeries 555 8.1 3.9 12.1
Lens aspiration 24 6.1 3.6 9.2
ECCE 305 8 2.7 12
PE 208 8.1 4.6 12.2
PE to ECCE 13 12.9 7.4 14.1
ICCE 2 16.7 9.9 23.6
Secondary IOL Implant
3 13.7 11.1 15.6
Post –operative visual acuity was not recorded in 86 patients.
Table 3.3.2: Median follow-up period in weeks (Patients with refracted vision)
Type of surgery N Median 25th percentile 75th percentile
All surgeries 2404 10.9 7.7 13.9 Lens aspiration 62 11.6 7.9 15.3
ECCE 1349 11.3 7.9 13.7
PE 905 10.1 7.3 13.7
PE to ECCE 63 12.1 9.1 14.1
ICCE 16 11.3 7.5 15.5
Secondary IOL Implant
3.4 Post-Operative Visual Acuity
Table 3.4.1: Distribution of post-operative VA
VA post operative Unaided Refracted
N=2930 100% N=2404 100%
No. % No. %
6/5 4 0 24 1
6/6 142 5 633 26
6/9 438 15 876 36
6/12 531 18 368 15
6/18 524 18 185 8
6/24 498 17 116 5
6/36 322 11 70 3
6/60 217 7 30 1
5/60 13 0 4 0
4/60 20 1 5 0
3/60 30 1 11 0
2/60 29 1 19 1
1/60 33 1 17 1
CF 54 2 15 1
HM 52 2 23 1
PL 13 0 6 0
59
Figure 3.4.1.1: Distribution of post-operative VA
%
0 10 20 30 40
Unaided Refracted
6/5
6/6 6/9 6/126/186/246/366/605/604/603/602/601/60 CF HM PL NPL
Figure 3.4.1.2: Cumulative distribution of visual acuity by pre- and post-
61
Table 3.4.2: Distribution of post-operative refracted VA 6/12 or better at the last follow up, by surgery
Type of surgery Unaided Refracted
N VA 6/12 or
better
N VA 6/12 or better
No. % No. %
All surgeries 2930 1115 38 2404 1901 79 Lens aspiration 86 24 28 62 33 53 ECCE 1639 512 31 1349 1030 76
PE 1102 552 50 905 778 86
PE to ECCE 75 25 33 63 45 71
ICCE 18 0 0 16 6 38
Figure 3.4.2: Percent of patients with refracted VA 6/12 or better at the last follow up, by surgery
%
VA
6
/1
2
o
r
b
e
tt
e
r
Type of surgery 0
50 100
Unaided Refracted
LA ECCE PE PE to ECCE ICCE 2 IOL Implant
* LA= Lens aspiration
63
Table 3.4.3:Distribution of post-operative refracted VA 6/12 or better in relation to age and type of surgery
Factor Types of cataract surgery
Factor Types of cataract surgery
All surgeries Lens aspiration ECCE PE PE to ECCE ICCE Secondary IOL Implant
N No. % N No. % N No. % N No. % N No. % N No. % N No. %
75-84 years
376 275 73 0 0 238 169 71 127 100 79 8 5 63 3 1 33 0 0
>=85 years
65
Table 3.4.4: Distribution of post-operative refracted VA 6/12 or better in relation to gender and type of surgery
Factor Types of cataract surgery
All surgeries Lens aspiration ECCE PE PE to ECCE ICCE Secondary IOL Implant
N No. % N No. % N No. % N No. % N No. % N No. % N No. %
N 2404 1901 79 62 33 53 1349 1030 76 905 778 86 63 45 71 16 6 38 9 9 100 Gender
Table 3.4.5: Distribution of post-operative refracted VA 6/12 or better in relation to co-morbidity and type of surgery
Factor Types of cataract surgery
All surgeries Lens aspiration
ECCE PE PE to ECCE ICCE Secondary IOL Implant
N No. % N No. % N No. % N No. % N No. % N No. % N No. %
N 2404 1901 79 62 33 53 1349 1030 76 905 778 86 63 45 71 16 6 38 9 9 100
Co-morbidity
1. Ocular
Yes 651 430 66 23 7 30 369 233 63 231 174 75 11 8 73 13 4 31 4 4 100 No. 1753 1471 84 39 26 67 980 797 81 674 604 90 52 37 71 3 2 67 5 5 100
2. Systemic
67
Table 3.4.6: Distribution of post-operative refracted VA 6/12 or better in relation to complication and type of surgery
Factor Types of cataract surgery
All surgeries Lens aspiration ECCE PE PE to ECCE ICCE Secondary IOL Implant
N No. % N No. % N No. % N No. % N No. % N No. % N No. %
N 2404 1901 79 62 33 53 1349 1030 76 905 778 86 63 45 71 16 6 38 9 9 100 Complication
1. Intra-op
Yes 271 178 66 10 5 50 139 84 60 83 63 76 33 22 67 6 4 67 0 0 No. 2133 1723 81 52 28 54 1210 946 78 822 715 87 30 23 77 10 2 20 9 9 100
2. Post-op
Table 3.4.7: Distribution of post-operative refracted VA 6/12 or better in relation to nature of surgery and type of surgery
Factor Types of cataract surgery
All surgeries Lens aspiration ECCE PE PE to ECCE ICCE Secondary IOL Implant
N No. % N No. % N No. % N No. % N No. % N No. % N No. %
N 2404 1901 79 62 33 53 1349 1030 76 905 778 86 63 45 71 16 6 38 9 9 100 Nature of
surgeries
69
Table 3.4.8: Distribution of post-operative refracted VA 6/12 or better in relation to anaesthesia and type of surgery
Factor Types of cataract surgery
All surgeries Lens aspiration ECCE PE PE to ECCE ICCE Secondary IOL Implant
N No. % N No. % N No. % N No. % N No. % N No. % N No. % N 2404 1901 79 62 33 53 1349 1030 76 905 778 86 63 45 71 16 6 38 9 9 100
Anaesthesia
1. Anaesthesia
General 135 82 61 49 27 55 46 32 70 27 17 63 5 1 20 4 1 25 4 4 100 Local 2269 1819 80 13 6 46 1303 998 77 878 761 87 58 44 76 12 5 42 5 5 100
2. Local anaesthesia
Retrobulbar 656 525 80 2 0 0 382 292 76 250 216 86 13 11 85 4 1 25 5 5 100 Peribulbar 422 331 78 1 1 100 262 198 76 142 121 85 12 9 75 5 2 40 0 0 Subtenon 1115 893 80 8 4 50 693 538 78 378 326 86 32 23 72 4 2 50 0 0 Subconjunctival 6 4 67 0 0 4 2 50 2 2 100 0 0 0 0 0 0
Facial block 276 220 80 0 0 177 135 76 94 82 87 3 1 33 0 0 2 2 100 Topical 164 142 87 3 1 33 8 3 38 150 135 90 3 3 100 0 0 0 0
Factor Types of cataract surgery
All surgeries Lens aspiration ECCE PE PE to ECCE ICCE Secondary IOL Implant
N No. % N No. % N No. % N No. % N No. % N No. % N No. %
3. Sedation
71
Table 3.4.9: Distribution of post-operative refracted VA 6/12 or better in relation to combined surgery and type of surgery
Factor Types of cataract surgery
All surgeries Lens aspiration ECCE PE PE to ECCE ICCE Secondary IOL Implant
N No. % N No. % N No. % N No. % N No. % N No. % N No. %
N 2404 1901 79 62 33 53 1349 1030 76 905 778 86 63 45 71 16 6 38 9 9 100 Combined
surgery
Any 86 54 63 6 2 33 40 23 57 31 26 84 2 1 50 7 2 29 0 0
Table 3.4.10: Distribution of post-operative refracted VA 6/12 or better in relation to IOL and type of surgery
Factor Types of cataract surgery
All surgeries Lens aspiration ECCE PE PE to ECCE ICCE Secondary IOL Implant
N No. % N No. % N No. % N No. % N No. % N No. % N No. % N 2404 1901 79 62 33 53 1349 1030 76 905 778 86 63 45 71 16 6 38 9 9 100 IOL
1. IOL
With IOL 2349 1891 81 52 30 58 1319 1024 78 900 778 86 61 45 74 8 5 63 9 9 100 Without IOL 55 10 18 10 3 30 30 6 20 5 0 0 2 0 0 8 1 13 0 0
N 2349 1891 81 52 30 58 1319 1024 78 900 778 86 61 45 74 8 5 63 9 9 100 2. IOL-type
Foldable 562 487 87 12 8 67 44 31 70 499 442 89 7 6 86 0 0 0 0
Non-foldable 1787 1404 79 40 22 55 1275 993 78 401 336 84 54 39 72 8 5 63 9 9 100
3.IOL-material