Front cover photos:
left, a woman collects cockles in Nicaragua. Credit: CRC middle, a reef of hard and soft corals in the Indo-Pacific Ocean. Credit: Nancy Sefton
right, a fisherman along The Gambian coastline. Credit: James Tobey, CRC
Back cover photos:
left, erosion damages a beach in the Marshall Islands. Credit: James Tobey, CRC
middle, a fisherwoman with her harvest in Thailand. Credit: CRC
i
|
COASTS A
T RISK
An Assessment of Coastal Risks
and the Role of Environmental Solutions
COASTS
iii
|
COASTS A
T RISK
Coasts at Risk (C@R) was made possible through funding from the United States Agency for International Development (USAID), the Pew Marine Fellowship pro-gram and the Lyda Hill Foundation. USAID funding was provided through the Sustainable Coastal Communities and Ecosystems (SUCCESS) Leader with Associates Award to the University of Rhode Island, under
Cooperative Agreement Number EPP-A-00-04-00014-00. The contents of this publication do not necessarily reflect the views of USAID or the U.S. Government. Citation: Coasts at Risk: An Assessment of Coastal Risks and the Role of Environmental Solutions. Edited by Michael W. Beck. A joint publication of United Nations University - Institute for Environment and Human Security (UNU-EHS), The Nature Conservancy (TNC) and the Coastal Resources Center (CRC) at the University of Rhode Island Graduate School of Oceanography. Published 2014.
Editor: Michael W. Beck
Graphic Design: Karen Ward Design
Copy Editor: Carol McCarthy
Cooperating Partners:
United Nations University-Institute for Environment and Human Security (UNU-EHS)
The Nature Conservancy (TNC)
The University of Rhode Island, Graduate School of Oceanography, Coastal Resources Center (CRC)
COASTS A
T RISK
|
iv
ACKNOWLEDGEMENTS
We thank the following individuals for reviewing one or several chapters: Imen Meliane (TNC), Cassandra De Young (FAO) and Carmen Revenga (TNC).
We provide special thanks to reviewers of the whole report including Julie Ekstrom (Natural Resources Defense Council) and Richard Volk, Jonathan Cook and Alex Apostos (USAID). They all provided valuable feedback.
Concept and Implementation:
v
|
COASTS A
T RISK
TABLE OF CONTENTS
1
.
INTRODUCTION
...1
JAMES TOBEY AND HILARY STEVENS, CRC
2.
THE COASTS AT RISK INDEX
... 5
TORSTEN WELLE, UNU-EHS, MICHAEL W. BECK, TNC, AND JOERN BIRKMANN, UNU-EHS
3.
THE ROLE OF MANGROVES IN COASTAL RISK REDUCTION
... 25
ANNA MCIVOR AND MARK SPALDING, UNIVERSITY OF CAMBRIDGE AND TNC
4.
CORAL REEFS AND RISK REDUCTION
... 39
CHRISTINE SHEPARD AND RACHEL FABIAN, UNIVERSITY OF CALIFORNIA SANTA CRUZ,
FILIPPO FERRARIO, UNIVERSITY OF LAVAL, QUEBEC, AND MICHAEL W. BECK, TNC
5.
MARINE FISHERIES, SOCIAL VULNERABILITY AND RISK
... 49
VERA N. AGOSTINI AND SHAWN W. MARGLES, TNC
6.
RECOMMENDATIONS FOR MEETING RISK REDUCTION
& CONSERVATION GOALS
... 61
FIGURES
TABLES
Figure 1 Scheme of the concept of C@R Index ...6
Figure 2 Indicators, components and subcategories of C@R Index ...9
Figure 3 Structure, indicators and weights for susceptibility component ...10
Figure 4 Structure, indicators and weights for coping capacity component ...10
Figure 5 Structure, indicators and weights for adaptive capacity component ...11
Figure 6 Structure and weights for aggregation of C@R Index ...11
Figure 7 Exposure map ...13
Figure 8 Susceptibility map...14
Figure 9 Lack of coping capacity map ...15
Figure 10 Lack of adaptive capacity map...16
Figure 11 Vulnerability map ...17
Figure 12 C@R Index map ...18
Figure 13 Results for tropical index of susceptibility, vulnerability and risk ...19
Figure 14 Environmental scores for tropical countries based on 8 indices ... 21
Figure 15 Some of ways that mangroves contribute to risk reduction ... 26
Figure 16 Global distribution of mangrove forests ... 26
Figure 17 Waves passing through mangroves ... 27
Figure 18 Schematic showing factors influencing wave reduction by mangroves ... 27
Figure 19 Dense coastal mangrove vegetation ... 28
Figure 20 Use of mangroves in hybrid structures ... 29
Figure 21 Dense aerial roots of mangroves ... 30
Figure 22 Schematic diagram, mangroves and risk reduction ... 30
Figure 23 Mangroves provide important habitat ...32
Figure 24 Diagram and aerial photo of whole reef zones ...40
Figure 25 Benefits of coral reef restoration ...43
Figure 26 Dependence on marine fish for protein ...51
Figure 27 Global/regional country dependence on marine fish for protein ...52
Table 1 Top 10 most exposed coastal countries ...13
Table 2 Top 10 most susceptible coastal countries ...14
Table 3 Top 10 coastal countries with highest lack of coping capacity ...15
Table 4 Top 10 coastal countries with highest lack of adaptive capacity ...16
Table 5 Top 10 most vulnerable coastal countries ...17
Table 6 Top 10 coastal countries with highest risk ...18
Table 7 Top 10 tropical countries for susceptibility ...20
Table 8 Top 10 countries with lowest environmental values ...21
Table 9 Economic values of coastal defense provisions of coral reefs ...41
Table 10 Numbers of people who may receive coral reef risk reduction benefits...42
Table 11 Top 10 countries with the highest number of fishing jobs ... 51
COASTS A
T RISK
|
vii
|
COASTS A
T RISK
ACRONYMS LIST
BCPR
Bureau for Crisis Prevention and Recovery (United Nations)
C@R
Coasts at Risk
CIESIN
Center for International Earth Science Information Network
CRC
Coastal Resources Center, University of Rhode Island, Graduate School of Oceanography
CreSIS
Center for Remote Sensing of Ice Sheets
FAO
Food and Agriculture Organization of the United Nations
FAOSTAT
Food and Agriculture Organization of the United Nations, Statistical Databases
FEMA
Federal Emergency Management Agency
GRIP
Global Health Research Initiative Program
GRUMP
Global-Rural-Urban Mapping Project
IFRC
International Federation of Red Cross and Red Crescent
IPCC
Intergovernmental Panel on Climate Change
OECD
Organisation for Economic Co-operation and Development
SIDS
Small Island Developing States
TEV
Total Economic Value
TNC
The Nature Conservancy
UNDP
United Nations Development Programme
UNEP
United Nations Environment Programme
UNFCC
United Nations Framework Convention on Climate Change
UN-HABITAT
United Nations Human Settlements Programme
UNISDR
United Nations Office for Disaster Risk Reduction
ix
|
COASTS A
T RISK
EXECUTIVE SUMMARY
C
oastal development and climate change are rapidly changing the world’s coastlines and dramatically increasing risks of catastrophic damage. Erosion, inundation and extreme weather events affect hundreds of millions of vulnerable people, important infrastructure and tourism—with significant losses to national econo-mies and human suffering. Environmental degradation compounds these risks, increasing communities’ expo-sure to natural hazards and reducing their access to natu-ral resources (e.g., fish stocks). Coastal and marine habi-tats, particularly coral reefs and wetlands, are at the front line of many of these changes and are increasingly lost and degraded. Often the loss of these habitats and fish stocks is greatest around population centers. That is, where the most people could benefit from these natural resources is often where their damage and loss are the greatest.This Coasts at Risk (C@R) report 1) examines the risks that nations face from vulnerability and exposure to coastal hazards; 2) identifies where environmental degra-dation contributes to these risks; and 3) explores where environmental solutions can contribute to risk reduction. Risk is defined as the interaction between a natural haz-ard event (including the adverse impacts of climate change) and the vulnerability of societies. This report applies an indicator-based approach to assessing the risk that coastal nations face with respect to natural hazards. The C@R Index builds on the framework and methodol-ogy of the index presented in the WorldRiskReport, which was led by the Alliance Development Works and the United Nations University Institute for Environment and Human Security (UNU-EHS). The WorldRiskReport high-lighted that across all countries and hazards (e.g., earth-quakes, floods, sea level rise, storms and drought); coastal countries were consistently at the greatest risk. This re-port and the C@R Index focus only on coastal countries and adds new indicators for fisheries and coastal habitats (natural capital) to highlight the connection between
environment and social vulnerability in assessing risk for coastal nations.
Many prior papers and reports focus on recommenda-tions for either risk reduction or conservation objectives (e.g., early warning systems for risk reduction or protect-ed areas for conservation).
This report takes an integrated approach by focusing on analyses and recommendations that can benefit both people and nature across risk reduction and environ-mental conservation objectives.
There are several key findings and considerations raised in the report that help guide the recommendations. First, the nations most at risk overall are tropical and Small Island Developing States (SIDS). Second, environmental degradation increases vulnerability and exposure. Third, environmental conservation and restoration can reduce exposure and improve social vulnerability. Lastly, it is highly likely that future coastal risks will increase with climate change, population growth and further coastal development. Based on the findings, this report offers a series of recommendations relevant to policy-makers, scientists, conservationists and risk managers.
The C@R Index helps to understand the risks that nations face from coastal hazards and identifies where environ-mental degradation contributes to vulnerability. Indeed, environmental indicators (fisheries, habitat) were linked to vulnerability (r2=0.10, p ≤ 0.01), and this connection between people and environment was strongest in tropi-cal countries (r2=0.15, p ≤ 0.01).
COASTS A
T RISK
|
x
risk reduction benefits to people. These benefits include reductions in exposure (e.g., reefs reduce wave energy by 97%) and the provision of natural resources, which sup-port livelihoods and reduce social vulnerability. These benefits are important to hundreds of millions of people. More than 250 million people live in low-lying exposed areas on the coast (< 10m elevation) and within 10 km of a reef or mangrove habitat. These are the people who most likely receive direct risk reduction benefits from reefs and mangroves.
Most of the world’s coastal communities depend on fish and fish-related industries for food and jobs. An estimat-ed 660-820 million people depend on fish (both from wild capture and aquaculture) for their livelihoods, and nearly 3 billion people rely on fish as an important source of animal protein (FAO 2012). The significance of fisheries to livelihoods, food security and coastal economies makes addressing the links between fisheries and social vulnerability central to evaluating and managing overall risk from coastal hazards.
Based on our findings from the C@R Index and reviews of the role of reefs, mangroves and fisheries in risk and risk reduction, the following key recommendations were identified.
There is a need to increase risk prevention
measures and opportunities for better
post-disaster development choices
P
Pre-disaster (i.e., prevention) actions are particularly cost effective but the most difficult to support. Larger and more coordinated coalitions of stakehold-er agencies and groups could push more effectively for the support that is needed.P
Post-disaster choices could support both risk reduc-tion and conservareduc-tion goals if nareduc-tional governments and multinational funders were more cautious about rebuilding efforts in the highest risk, low- lying areas.P
A greater commitment is needed to help SIDS, the most at-risk nations, build adaptive capacity for the future through adaptation (prevention) measures and better post-disaster development choices.Habitat restoration can contribute to risk
reduction, and opportunities exist to focus
these restoration efforts
P
Coral reef and mangrove restoration offers cost-ef-fective options for risk reduction, which is particu-larly relevant in tropical, coastal countries that are most at risk from natural hazards.P
Environmental agencies and conservation groups will need to modify priorities to work effectively to support risk reduction. For example, many marine conservation efforts occur in remote areas (i.e., with low population density). More projects should be added in areas with greater population density.P
Even large temperate countries (e.g., China and the U.S.) have the need and opportunities for coral reef and mangrove restoration to reduce risks. In temper-ate countries, increased oyster reef and salt marsh restoration could also cost-effectively reduce risk.Targeted research is needed on environmental
risk reduction services to create better
opportunities for investment
P
Governments and multinational funders should develop more integrated risk assessments that better account for drivers of risk, such as environmental degradation.P
Scientists should advance research on the effects of environmental degradation on risk. For example, there needs to be more direct measures of the effects of habitat degradation on coastal erosion and on the connection between fisheries and food security.xi
|
COASTS A
T RISK
P
Many nations have substantial critical infrastructure (e.g., ports, airports, power plants, sewage treatment plants) in low-lying and highly exposed areas; gov-ernments need to better account for how this affects their national risk.Leaders need to demand more cost-effective
solutions and recognize opportunities to
create sustainable investments in natural
infrastructure
P
Adaptation and development funders should encourage better mainstreaming of cost-effective solutions for risk reduction. Where natural solutions are cost effective, they should become the preferred alternatives. This is already starting to happen as re-insurers assess the cost effectiveness of habitat restoration, and engineering agencies and firms are developing more nature-based coastal defense projects.P
Nature-based risk reduction can be increasingly viewed as an opportunity for investment and busi-ness. Engineering firms can find business in design-ing nature-based defenses. Construction firms and marine contractors can find business in developing restoration projects.Fisheries management and research need
to improve and recognize opportunities to
reduce social vulnerability
P
Our understanding of the links between fisheries and food security needs to be improved. This research will help drive actions by identifying where to focus conservation for food security.P
Fisheries management can fruitfully be approached from a risk reduction and adaptation viewpoint, which could lead to new partnerships (e.g., with aid groups); new and refined funding investment strate-gies; and better buy-in towards fisheriesenhancement.
P
Further research on the link between fisheries and climate change is critical. In the future, tropical areas are predicted to see declines in fisheries productivity. Thus, those countries most at risk overall may face the greatest pressures from climate-related declines in fisheries.COASTS A
T RISK
|
xii
1
|
COASTS A
T RISK
1
.
INTRODUCTION
BY JAMES TOBEY AND HILARY STEVENS
C
oastal development and climate change are rapidly changing the world’s coastlines
and dramatically increasing risks of catastrophic damage. The proportion of the
world’s GDP annually exposed to tropical cyclones has increased from 3.6% in the
1970s to 4.3% in the first decade of the 2000s (UNISDR, 2011). Erosion, inundation and
extreme weather events affect hundreds of millions of vulnerable people, important
infrastructure and tourism—with significant losses to national economies and
human suffering.
Environmental degradation compounds these risks, in-creasing communities’ exposure to waves, wind and wa-ter, and leads to further losses of fish stocks. Coastal and marine habitats, particularly coral reefs and wetlands, are at the front line of many of these changes and are in-creasingly lost and degraded. Global losses of coastal habitats are as high as 85% for oyster reefs, 30-50% for wetlands and over 25% for coral reefs. Often the loss of these habitats is greatest around population centers. That is, where the most people could benefit from these eco-systems is often where their damage and loss have been the greatest. Owing to overfishing and habitat degrada-tion, fish stocks have suffered major declines. Most global fish stocks are managed unsustainably with many col-lapsed or collapsing, and these losses have the greatest
impacts on the most fisheries-dependent and vulnerable communities.
COASTS A
T RISK
|
2
creation of “grey infrastructure” such as seawalls, which will further degrade coastal ecosystems and may not be cost effective for risk reduction when compared to more natural and hybrid alternatives.
The C@R report 1) examines the risks that nations face from vulnerability and exposure to coastal hazards; 2) identifies where environmental degradation contributes to these risks; and 3) explores where environmental solu-tions can contribute to risk reduction. The report exposes the links between coastal natural resources and disaster risks and raises the importance of taking societal action to reduce these risks, particularly in the context of knowl-edge that they will increase with climate change. This report is intended to inform national, regional and global decision-makers about their risks; the factors that con-tribute to them; and the role that the environment may play in reducing current and future risks.
This report applies an indicator-based approach to as-sessing the risk that coastal nations face with respect to natural hazards. The methodology for calculating risk in coastal nations is described in Chapter 2 and follows ap-proaches and definitions developed within the disaster risk reduction community (UNISDR, 2011; IPCC, 2012). Risk is a function of exposure of people and assets to a geophysical hazard (e.g., flood) and the social ity of communities. The three components of vulnerabil-ity are susceptibilvulnerabil-ity, coping capacvulnerabil-ity and adaptive capac-ity. Susceptibility is the likelihood that people will experi-ence harm or be adversely impacted by a coastal hazard event. Coping capacity is the ability of a society to handle disaster emergencies, and adaptive capacity is long-term institutional, educational and economic ability to deal with actual or future hazard events.
The C@R Index of risk was prepared by building on the framework and methodology of the index presented in the WorldRiskReport (www.worldriskreport.com), which was led by the Alliance Development Works in coopera-tion with the UNU-EHS. The WorldRiskIndex developed by UNU-EHS is constructed annually through close co-operation between scientists and practitioners, and the methodology of the index is validated by scientists for its reliability.
The WorldRiskReport highlighted that across all countries and hazards (e.g., earthquakes, fires, floods, sea level rise, storms and drought), coastal countries were consistently at the greatest risk. For example, the top 15 most at-risk
nations in the 2012 global report were all coastal, tropical nations. The world’s coastal regions are centers of popu-lation and economic activity, but they are also highly exposed to natural hazards, including those that are cli-mate change related.
This report and index have added a particular focus on coastal and environmental risks. First, this report and index focus only on coastal nations. Second, new indica-tors for fisheries and coastal habitats (natural capital) have been added to concentrate on the connection be-tween environment and social vulnerability in assessing risk for coastal nations. These coastally focused environ-mental indicators were added to each component of the assessment of social vulnerability as suggested in the WorldRiskReport 2012 (Welle et al. 2012). All of these in-dicators were global in scale except for the inin-dicators of reef and mangrove habitats, which occur only in coun-tries with tropical environments.
After assessing national risks, the C@R report provides review chapters that examine the links among natural coastal resources, risk and risk reduction. Individual chapters focus on mangrove forests (Chapter 3), coral reefs (Chapter 4) and fisheries (Chapter 5) to examine how environmental degradation in these resources con-tributes to risk, and more importantly, where conserva-tion and restoraconserva-tion could contribute to risk reducconserva-tion.
Mangroves provide habitat for numerous species includ-ing birds and juvenile fish and are a source of wood for fuel and construction. Mangrove stands have also been shown to reduce shoreline wave energy, which lessens erosion and can dampen the effects of extreme events, such as storm surge or tsunami. Mangroves also mitigate climate change, as the soils in which they grow can store large amounts of carbon. For all these reasons, man-groves are a valuable resource in reducing risk.
3
|
COASTS A
T RISK
have become degraded are important approaches to risk reduction.
Marine fisheries also represent natural capital that is linked to risk reduction by providing animal protein as well as direct and indirect employment and income for the world’s coastal communities. The fisheries chapter describes and graphically illustrates these benefits and highlights climate change risks to fisheries. It also dis-cusses the importance of fisheries vulnerability assess-ments and risk reduction strategies.
Environmental degradation can increase risk for fisher-ies, coral reefs and mangroves, and environmental health has a strong influence on vulnerability. Consequently, environmental conservation and restoration of coastal habitats and the application of strategies to increase the productivity of fisheries can reduce vulnerability.
This report concludes with recommendations for reduc-ing these risks with a particular focus on measures rel-evant across management objectives of risk reduction, adaptation and conservation (Chapter 6).
References
IPCC (2012). Managing the Risks of Extreme Events and Disasters to Advance Climate Change Adaptation. A Special Report of Working Groups I and II of the Intergovernmental Panel on Climate Change [Field, C.B., V. Barros, T.F. Stocker, D. Qin, D.J. Dokken, K.L. Ebi, M.D. Mastrandrea, K.J. Mach, G.-K. Plattner, S.K. Allen, M. Tignor, and P.M. Midgley (eds.)]. Cambridge University Press, Cambridge, UK, and New York, NY, USA, 582.
UNISDR (2011). Global Assessment Report on Disaster Risk Reduction Vol. 178. United Nations International Strategy for Disaster Reduction, Geneva, Switzerland.
COASTS A
T RISK
|
4
5
|
COASTS A
T RISK
2.
THE COASTS AT RISK INDEX
BY TORSTEN WELLE, MICHAEL W. BECK AND JOERN BIRKMANN
2.1 Theoretical concept
T
he C@R Index is an indicator-based approach that assesses the risk of coastal
nations exposed to natural hazards such as cyclones, floods, storm surges, tsunamis
and sea level rise. This Index also examines where environmental degradation of
coastal resources contributes to this risk. The C@R index is built on the concept of
the WorldRiskIndex developed by UNU-EHS (Birkmann et al., 2011, Welle et al., 2013)
with the addition of a particular focus on coastal and environmental risks. The index
is intended to inform national, regional and global decision-makers about their risks
and the factors that contribute to them so that they can seek solutions in disaster risk
reduction and climate change adaptation. The C@R Index is based on the premise that it
is not only the intensity of a natural event that is responsible for a coastal hazard turning
into a disaster, but also the social, economic and ecological factors of a society. Hence,
planning processes and proactive measures could reduce the risk of coastal nations
related to coastal hazards and the impacts of climate change.
The concept of the C@R Index is based on the core un-derstanding of risk within the natural hazards and disas-ter risk reduction community. In this context, risk is de-fined as the interaction between a natural hazard event
COASTS A
T RISK
|
6
2.2 From the WorldRiskIndex to the C@R Index
This concept emphasizes that risk is not solely anout-come of the probability and magnitude of the natural hazard event but also is determined by the structure, processes and framework conditions within a society. Consequently, social, economic and environmental fac-tors as well as governance play a major role in determin-ing whether a natural hazard will result in a disaster (Birkmann et al., 2011; IPCC, 2012). The C@R Index is
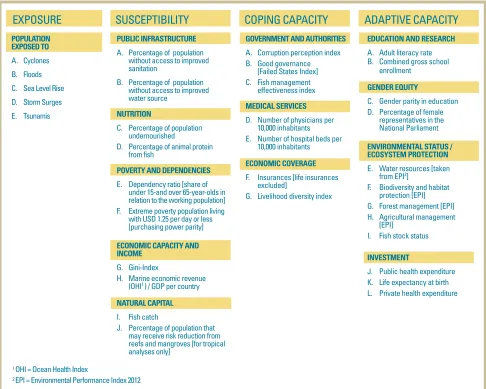
composed of 33 indicators using freely available global data and is based on a modular structure divided into four components of exposure to natural hazards, suscep-tibility, coping and adaptive capacity (Figure 1). The re-sults of the C@R Index enable a comparison of countries with one another, providing a description of a potential disaster. The index cannot forecast individual disasters.
COMPONENTS OF THE C@R INDEX
EXPOSURE
The WorldRiskIndex is the main component of the WorldRiskReport, which is released every year by the German non-governmental organization Bündnis Entwicklung Hilft (Alliance Development Works 2011, 2012, 2013). The WorldRiskIndex ranks 173 nations by examining the level of exposure to natural hazards com-bined with information on vulnerability composed of susceptibility, coping capacity and adaptive capacity. The results are a set of global indicators for risk, exposure and vulnerability that are visualized in a series of maps.
With the C@R Index, the focus is on coastal nations be-cause of the high risks that such nations face from natural hazards (e.g. storms, tsunamis, floods, storm surges) and the growing impacts of climate change, such as sea level rise. Globally, 1.2 billion people (23% of the world’s popu-lation) live within 100km of the coast and 50% are likely to do so by 2030 (Adger et al., 2005). It is estimated that some 10 million people already experience coastal flood-ing each year due to storm surges and cyclones, while projections taking into account sea level rise and increas-ing population density suggest 50 million people per year
will be at risk by 2080 (Adger et al., 2005). Coastal com-munities are literally in the front lines of coping with sea level rise as well. Some areas worldwide are already strug-gling with inundation and land loss. Changing weather patterns such as intense rainfall or drought in many areas will heighten issues with coastal flooding and limited fresh water, and it is highly likely that many areas will experience more frequent, intense storms and their con-comitant coastal flooding. Additionally, most coastal areas and island states are dependent on resources such as fishing, ports and aquaculture for their livelihoods, making them all the more susceptible to coastal hazards and climate change.
The C@R Index is based on and adds to the
WorldRiskIndex (Figure 1). This C@R Index focuses on coastal nations and hazards with the addition of environ-mental indicators designed to represent natural capital (e.g., coastal habitats and fisheries) and the contribution of environmental degradation (e.g., loss or lack of natural capital) to national risk.
7
|
COASTS A
T RISK
many indicators might allocated among subcategories differently. For example, a good economic situation in terms of savings would make people less susceptible compared to those without savings and would increase the coping capacities of the former group.
Susceptibility of coastal populations
Susceptibility refers to the conditions of exposed people, infrastructure (built capital) and ecosystems (natural capital) that make populations more or less likely to ex-perience harm and to be affected by natural hazards and climate change. If susceptibility is high, the likelihood of the community to suffer harm is also high. Susceptibility is closely linked to social and economic conditions such as nutrition, economic capacities and public infrastruc-ture. It provides a metric of the underlying likelihood that a society can suffer harm due to any stressor from natural hazards. Conceptually, susceptibility has been divided into five subcategories that represent the livelihood situa-tion and living condisitua-tions of people within a coastal country. The subcategories are:
P
Public infrastructureP
NutritionP
Poverty and dependenciesP
Economic capacity and incomeP
Natural capitalCoping capacity of coastal
populations
Coping is defined as the ability of a society to use direct action and its own resources to face and manage near-term emergencies, disasters or adverse conditions from a hazard event (UNISDR, 2009). Coping mechanisms usu-ally build on experiences that have been made during past disasters. Hence, coping mechanisms are often based on the assumption that what has happened in the past is likely to re-occur in a familiar pattern (Bankoff et al., 2004). Coping capacities encompass measures, re-sources and abilities that are immediately available to
Coastal hazards and exposure of
coastal populations
Exposure refers to entities (e.g., people, resources, infra-structure and goods) exposed and prone to be affected by a hazard event (UNISDR, 2009). Within the C@R Index, exposure is narrowed to refer to entities who may be af-fected by coastal natural hazards. Coastal hazards are natural events that happen along the coastline. The fol-lowing coastal hazards were taken into account for the calculation of exposure: storms, storm surges, floods, tsunamis and sea level rise.
The data used for exposure consider the frequency and magnitude of the hazard events, thus exposure is closely linked to characteristics of the hazard phenomena. The number of exposed people is based on models taking into account previous storms, floods, tsunamis, storm surges and population density (for details: http://preview.grid. unep.ch/). The exposure to sea level rise is calculated by considering a conservative estimate of the number of people who would be affected by one meter sea level rise (Welle et al., 2013). The number is conservative because exposure is based on current population without consid-ering future population growth.1 However, the authors
note that the gradual increase of one meter sea level rise is expected to occur only by 2100 and does not include a probabilistic component.
Vulnerability of coastal populations
In this study the vulnerability of coastal populations is de-fined by three components: susceptibility, adaptive capacity and coping capacity (Figure 1), which are described in fur-ther detail in the next three subsections below. In short, these components aim to characterize the current socio-economic condition of countries and their abilities to cope with near-term hazards and to adapt to longer-term hazards and climate change (Birkmann, 2013).
Susceptibility and coping capacity are closely interlinked and clear separation of indicators in practice is thus often difficult because some aspects overlap. This index in-cludes logical subcategories allocated with correspond-ing indicators. Nonetheless, the authors are aware that
1The combination of projected future extent of a hazard (sea level rise) with present population is a commonly accepted approach particularly when spatial patterns of future social and
COASTS A
T RISK
|
8
Adaptive capacity of coastal populations
minimize harm when a disaster strikes. Consequently, coping is hazard related and primarily short-term ori-ented. The following three subcategories characterize coping within the C@R Index:
P
Government and authoritiesP
Medical servicesP
Economic coverageAdaptation or adaptive capacity encompasses measures and strategies that enable the society to change or to transform in order to deal with the negative impacts of natural hazards and future climate change impacts. O’Brien and Vogel (2003) stress that compared to coping, adaptation is a more structured behaviour that aims to promote change and transformation. Hence, these ca-pacities and measurements focus more on the change of existing structures within a society, such as the environ-mental status or education. In contrast to coping, adapta-tion is understood as a long-term process. The following four subcategories were used to describe adaptive
capacities within the C@R Index. In the long term, actions
designed to address these elements may make societies
more resilient and adaptable to the potential impacts of
climate change and natural hazards.
P
Education and researchP
Gender equityP
Environmental status/ecosystem protectionP
Investments2.3 Data and methods
This section provides an overview of some of the indi-vidual indicators, the global data sets and the calculation of the C@R Index. All data used were freely available and global in scale. Specific criteria were followed: indicators for exposure should span a range of the main coastal natural hazards; susceptibility, coping and adaptive ca-pacity indicators should be of a generic nature, in order to be relevant for different hazards (i.e., multi-hazard perspective); all indicators should be rational, analytically and statistically sound; reproducible; appropriate in scope, in terms of the assessment; understandable, easy to interpret and comparable (Meyer, 2004).
Indicators
The individual indicators in each component were se-lected and designed based on the above-mentioned crite-ria. The challenge was to identify suitable indicators that best reflected the circumstances of coastal nations that could be allocated to the four components: exposure, susceptibility, coping and adaptation and their respective subcategories (Figure 2). The selected indicators for the
9
|
COASTS A
T RISK
the indices for susceptibility, coping capacity and adapta-tion capacity, including their respective weights.
Exposure
The C@R Index takes two different types of natural haz-ards into account; it focuses primarily on current and sudden onset hazards, such as storms, floods, storm surg-es and tsunamis, but also includsurg-es the slow onset hazard of sea level rise. The data for sudden onset hazards were taken from PREVIEW Global Risk Data Platform (http:// preview.grid.unep.ch/). This platform is a multiple agen-cy (UNEP, UNDP/BCPR (GRIP), UNISDR) effort to share spatial data information on global risk from natural haz-ards. Data obtained from PREVIEW represent an estima-tion of the average annual exposure to the four selected hazards, including the frequency of the respective hazard
ADAPTIVE CAPACITY
COPING CAPACITY
EXPOSURE
SUSCEPTIBILITY
1 OHI = Ocean Health Index
2 EPI = Environmental Performance Index 2012
EDUCATION AND RESEARCH
A. Adult literacy rate B. Combined gross school
enrollment
GENDER EQUITY
C. Gender parity in education D. Percentage of female
representatives in the National Parliament
ENVIRONMENTAL STATUS / ECOSYSTEM PROTECTION
E. Water resources [taken from EPI2]
F. Biodiversity and habitat protection [EPI] G. Forest management [EPI] H. Agricultural management [EPI]
I. Fish stock status
INVESTMENT
J. Public health expenditure K. Life expectancy at birth L. Private health expenditure
GOVERNMENT AND AUTHORITIES
A. Corruption perception index B. Good governance
[Failed States Index] C. Fish management effectiveness index
MEDICAL SERVICES
D. Number of physicians per 10,000 inhabitants E. Number of hospital beds per
10,000 inhabitants
ECONOMIC COVERAGE
F. Insurances [life insurances excluded]
G. Livelihood diversity index
POPULATION
A. Percentage of population without access to improved sanitation
B. Percentage of population without access to improved
water source
NUTRITION
C. Percentage of population undernourished
D. Percentage of animal protein from fish
POVERTY AND DEPENDENCIES
E. Dependency ratio [share of under 15-and over 65-year-olds in
relation to the working population] F. Extreme poverty population living
with USD 1.25 per day or less [purchasing power parity]
ECONOMIC CAPACITY AND INCOME
G. Gini-Index
H. Marine economic revenue (OHI1 ) / GDP per country
NATURAL CAPITAL
I. Fish catch
J. Percentage of population that may receive risk reduction from
reefs and mangroves [for tropical analyses only]
management effectiveness index (indicator C) was added under the Government and Authorities component because good management is important to food provi-sion and livelihoods that depend upon fish and seafood. Additionally, the livelihood diversity index (indicator G) was added to focus on the distribution of employment across nine marine employment sectors. Finally, under adaptive capacity, fish stock status (indicator I) was integrated as a proxy for the sustainability of national fisheries. Some of the primary sources of the new indica-tor data included global databases from the World Bank and the statistic division of the Food and Agriculture Organization of the United Nations (FAOSTAT). The development of the indices was done according to the OECD Handbook on Constructing Composite Indicators (2008). Hence, several methodological steps such as nor-malisation were taken into account to render all indica-tors comparable. Figures 3 to 5 show the composition of
COASTS A
T RISK
|
10
and information on the population distribution based on the LandScanTM Global Population Database. This spe-cific data set is called physical exposure, and the number of people exposed per hazard and per country was de-rived by calculating the zonal statistic with ArcGIS. It has to be stressed that these global data are based on model calculations and therefore the matter of uncertainty with-in the model calculation has to be taken with-into account (Peduzzi et al., 2009). The calculation of exposed people to sea level rise by one meter is based on data from the Center for Remote Sensing of Ice Sheets (CreSIS) at the University of Kansas. Using GIS techniques, this data set was combined with the population statistics of the Global-Rural-Urban Mapping Project (GRUMP) run by the Center for International Earth Science Information Network (CIESIN) at Columbia University. With respect to the aggregation of exposed people per hazard, the num-ber of individuals exposed to sea level rise has been weighted by 50%, because it is impossible to calculate an annual average exposure to sea level rise. The overall exposure index that describes the share of the population exposed per country is calculated by summing up all exposed people per hazard divided by the number of inhabitants per country.
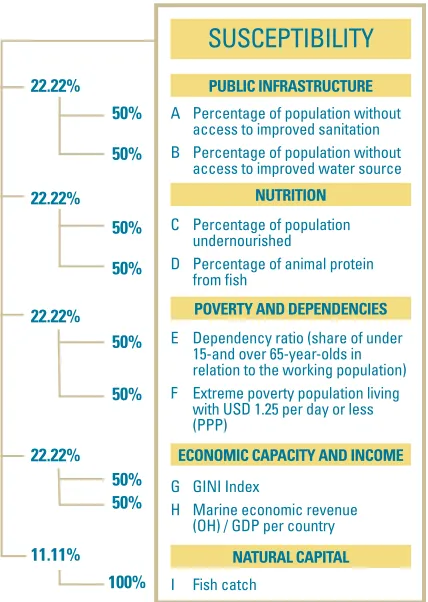
Susceptibility
The susceptibility index includes nine equally weighted indicators (A-I) distributed among five subcategories (Figure 3). Before summarizing, all indicators were nor-malized between 0 and 1. The indicator “fish catch” un-der the subcategory natural capital is a measure of the abundance of catch, however, to focus on susceptibility the indicator is 1 – Fish Catch.
Coping capacity
The coping capacity index (Figure 4) aims to measure society’s ability to immediately respond to adverse im-pacts during a disastrous event. Seven indicators (A-G) were chosen to determine the capacity of a coastal soci-ety to immediately react to or manage the impact of a hazardous event. Coping capacities include important resources to reduce the potential impacts of a disaster, such as medical services or economic coverage, as well as structures or framework conditions that could hinder coping measures of a coastal nation, for example, corrup-tion or bad governance. Figure 4 provides the structure, indicators and weights for the coping capacity index. For the aggregation of the C@R Index, the lack of coping ca-pacities will be used instead of coping caca-pacities. Therefore, the calculated value of coping capacity will be subtracted from 1.
Figure 3: Structure, indicators and weights for the susceptibility component
Figure 4: Structure, indicators and weights for the coping capacity component
C Percentage of population undernourished
D Percentage of animal protein from fish
G GINI Index
H Marine economic revenue (OH) / GDP per country
I Fish catch
A Percentage of population without access to improved sanitation B Percentage of population without
access to improved water source
E Dependency ratio (share of under 15-and over 65-year-olds in relation to the working population) F Extreme poverty population living
with USD 1.25 per day or less
E Number of hospital beds per 10000 inhabitants
A Corruption perception index B Good governance (Failed State Index)
C Fish management effectiveness index
F Insurances (life insurance excluded)
G Livelihood diversity index
11
|
COASTS A
T RISK
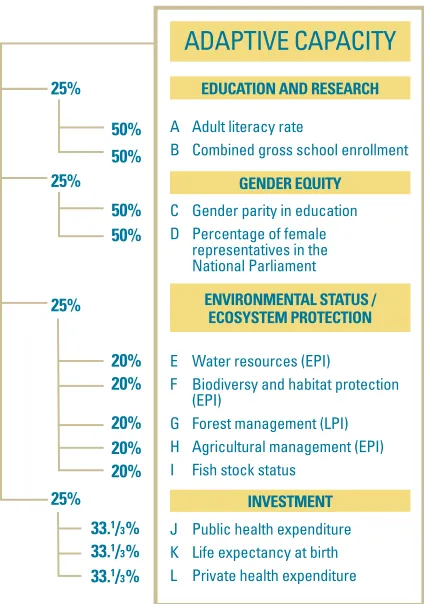
Adaptive capacity
The indicators for the adaptive capacity of a coastal nation need to portray the long-term response capacities to natural hazards and/or environmental change. They should mea-sure the ability of a society or community to transform or adapt to reduce the vulnerability to this change. The com-ponent on adaptive capacity contains four subcategories: education and research, gender equity, environmental sta-tus or ecosystem protection and investments (Welle et al., 2013). The indicators selected for adaptive capacity (A-L) are listed in Figure 5. The individual indicator weights as well as the weights for the aggregation of the adaptive capacity index also are illustrated.
Calculation of the C@R Index
The C@R Index is calculated by combining the four com-ponents: exposure, susceptibility, lack of coping capacity and lack of adaptive capacity. First, the indices of suscep-tibility, lack of coping capacity and lack of adaptive ca-pacity are added up to a vulnerability index. The vulner-ability index describes the societal component of risk that can turn a natural event into a disaster. In a second step, the vulnerability index is multiplied with the exposure index to develop the overall C@R Index. Figure 6 sche-matically presents the aggregation, including all weights for the components. The results have consistently been scaled between 0 and 1. For better comprehension and cartographic transformation, all individual indices have
been classified using the quantile method within the ArcGIS 10 software. Five classes have been selected and each class contains the same number of cases (e.g. coun-tries), which are translated into a qualitative classifica-tion of “very high – high – medium – low – very low.”
Figure 6: Structure and weights for the aggregation of the C@R index
Figure 5: Structure, indicators and weights for the adaptive capacity component
C Gender parity in education D Percentage of female
representatives in the National Parliament
J Public health expenditure K Life expectancy at birth L Private health expenditure A Adult literacy rate
B Combined gross school enrollment
E Water resources (EPI)
F Biodiversy and habitat protection (EPI)
G Forest management (LPI) H Agricultural management (EPI) I Fish stock status
EXPOSURE SUSCEPTIBILITY LACK OF COPING CAPACITY
Lack of capacity to reduce negative consequences during a disaster
COASTS A
T RISK
|
12
2.4 Results of the C@R Index
R
isk is a multi-causal phenomenon that not only depends on the exposure to natural
hazards and climate change, but also on social conditions and capacities (as is
represented in susceptibility, lack of coping capacities and lack of adaptive capacities)
that can reduce impact. These three components describe the vulnerability of societies
and can help signal whether a natural hazard or impacts of climate change could lead
to a crisis or disaster. The results of the C@R Index describe the potential risk at national
level. It is important to remember that this is neither predictive nor probabilistic; it does
not predict when and where a hazardous event may take place. It is meant to characterize
underlying risk and highlight areas that are most consistently exposed to coastal natural
hazards. Based on data availability, 139 coastal countries were considered. The aggregated
results are mapped to facilitate a general understanding and comparison between
countries and regions. A deeper analysis can be made by decomposing the numerical
indices into indicators. Unfortunately, several small island states, which are probably
highly exposed to coastal hazards including the emerging risk of rising sea level, could not
be considered due to data limitations. The individual components will be presented first,
followed by the vulnerability index and the overall C@R Index.
13
|
COASTS A
T RISK
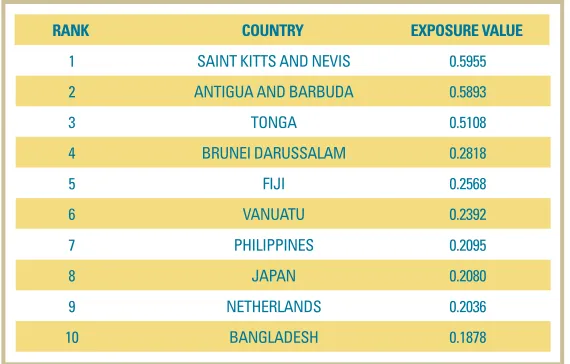
Exposure
The world map of exposed people shows the potential annual average exposure of each coastal nation to coastal hazards. Some hot-spot regions can clearly be seen, which include the Caribbean, South East Asia and the nations of Japan, the Netherlands, Suriname and Guyana (Figure 7).
Table 1 provides an overview of the 10 most exposed coastal countries: Maximum po-tential exposure value 1; this would mean the whole country and all people would be exposed.
Low 0.0041 - 0.0103
Medium 0.0104 - 0.0228 High 0.0229 - 0.0704 Very High 0.0705 - 0.5955 No data
Very Low 0.0003 - 0.0040
Max. exposure = 1
classification according to the quantile method
Legend
Exposure: Exposure of the
population to coastal hazards
(storms, floods, surges, tsunamis,
sea level rise)
Table 1: Top 10 most exposed coastal countries
Figure 7: Exposure map
2 ANTIGUA AND BARBUDA 0.5893
3 TONGA 0.5108
1 SAINT KITTS AND NEVIS 0.5955
RANK COUNTRY EXPOSURE VALUE
4 BRUNEI DARUSSALAM 0.2818
5 FIJI 0.2568
6 VANUATU 0.2392
7 PHILIPPINES 0.2095
8 JAPAN 0.2080
10 BANGLADESH 0.1878
C
O
A
S
T
S
A
T
R
IS
K
|
14
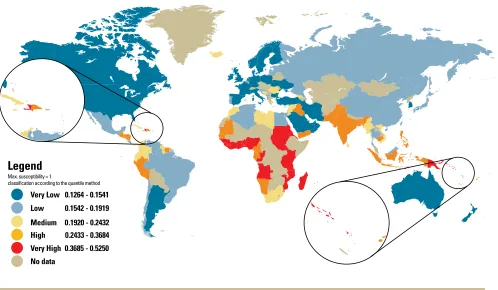
Susceptibility
Figure 8 displays the map for susceptibility by nation based on public infrastructure, nutrition, natural capital, income and eco-nomic capacities. Hot-spot regions of Very High susceptibility are clearly seen in West and East African countries, but Very High values also are identified in Haiti and Papua New Guinea, where low income and poorly constructed public infrastructure are fac-tors. Coastal countries within the High class of susceptibility are located in South and Southeast Asia. The globally significant north-south divide is less distinctive in the Americas, where only some countries of Central America as well as Peru and Suriname rank in the High class.
Table 2 shows the 10 most susceptible coastal countries. Maximum potential sus-ceptibility is the value 1; this would mean all nine indicators would reach the worst value.
Low 0.1542 - 0.1919
Medium 0.1920 - 0.2432 High 0.2433 - 0.3684 Very High 0.3685 - 0.5250 No data
Very Low 0.1264 - 0.1541
Max. susceptibility = 1
classification according to the quantile method
Legend
Table 2: Top 10 most susceptible coastal countries
Figure 8: Susceptibility map
S
usceptibility depends on public
infrastructure, nutrition, natural
capital, income and economic
framework of coastal countries.
2 VANUATU 0.5053
3 MADAGASCAR 0.4884
1 SIERRA LEONE 0.5250
RANK COUNTRY SUSCEPTIBILITY VALUE
4 MOZAMBIQUE 0.4837
5 COMOROS 0.4824
6 LIBERIA 0.4724
8 PAPUA NEW GUINEA 0.4581
10 HAITI 0.4471
9 ERITREA 0.4501
15
|
COASTS A
T RISK
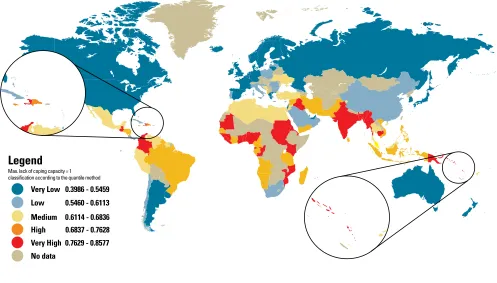
Lack of coping capacity
Countries with a high lack of coping capac-ity will have severe problems in responding and reducing the negative impacts of a di-saster. As seen in the susceptibility map, indicators for lack of coping capacity occur along a clear north-south divide that reflects developed vs. less- developed country status (Figure 9). A Very High lack of coping capac-ity is seen for many coastal countries in Africa as well as for parts of South Asia. In Europe it is interesting to note that Bosnia-Herzegovina, Montenegro and Albania have limited coping capacities. The lasting im-pacts of war in the 1990s might be the cause. Each country shows unfavorable values for the governance indicators (corruption per-ception index and failed state index), which contribute to the lack of coping capacity. In South Africa, for example, favorable values for coping capacity are likely due to a stable political system and a well-developed health system.
Low 0.5460 - 0.6113
Medium 0.6114 - 0.6836 High 0.6837 - 0.7628 Very High 0.7629 - 0.8577 No data
Very Low 0.3986 - 0.5459
Max. lack of coping capacity = 1 classification according to the quantile method
Legend
Figure 9: Lack of coping capacity map
Table 3: Top 10 coastal countries with the highest lack of coping capacity
Coping capacity depends on
governance, medical care and
material security.
Table 3 lists the top 10 coastal countries with the highest lack of cop-ing capacity. The maximum value for lack of copcop-ing capacity is 1.
2 SOLOMON ISLANDS 0.8559
3 HAITI 0.8539
1 MOZAMBIQUE 0.8577
RANK COUNTRY LACK OF COPING CAPACITY VALUE
4 MYANMAR 0.8483
5 SUDAN 0.8416
6 PAPUA NEW GUINEA 0.8350
7 CONGO 0.8335
8 LIBERIA 0.8274
10 VANUATU 0.8251
COASTS A
T RISK
|
16
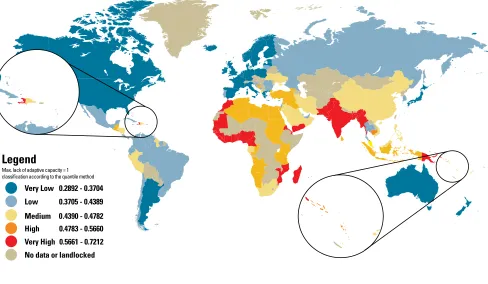
Lack of adaptive capacity
Adaptive capacities focus on conditions and strategies that enable a society to change or to transform in order to deal with the nega-tive impacts of climate change and natural hazards. The lack of adaptive capacity map (Figure 10) does not show a clear north-south divide in North and South America as compared to the lack of coping capacity map. This is based on good results in the subcategories of education and research and equal participation. Again, West Africa appears as a hot-spot region, followed by coastal countries in South Asia. Eight of the top 10 coastal countries with the highest lack of adaptive capacities are located in Africa, with Haiti and Pakistan accounting for the other two (Table 4). Maximum po-tential value for the lack of adaptive capac-ity is 1.
Low 0.3705 - 0.4389
Medium 0.4390 - 0.4782 High 0.4783 - 0.5660 Very High 0.5661 - 0.7212 No data or landlocked Very Low 0.2892 - 0.3704
Max. lack of adaptive capacity = 1 classification according to the quantile method
Legend
Figure 10: Lack of adaptive capacity map
Table 4: Top 10 coastal countries with the highest lack of adaptive capacity
Adaptive capacity depends on the
status of education, environment,
gender equity and health investments.
2 HAITI 0.6781
3 SIERRA LEONE 0.6723
1 ERITREA 0.7212
RANK COUNTRY LACK OF ADAPTIVE CAPACITY VALUE
4 PAKISTAN 0.6593
5 BENIN 0.6541
6 GUINEA 0.6539
7 MAURITANIA 0.6479
8 LIBERIA 0.6430
10 BANGLADESH 0.6381
17
|
COASTS A
T RISK
Low 0.3656 - 0.4156
Medium 0.4157 - 0.4719 High 0.4720 - 0.5614 Very High 0.5615 - 0.6597 No data
Very Low 0.2791 - 0.3655
Max. vulnerability = 1
classification according to the quantile method
Legend
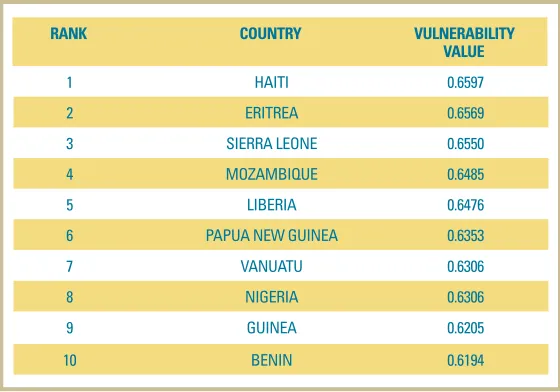
Vulnerability
Vulnerability is calculated as the combina-tion of susceptibility, lack of coping capacity and lack of adaptive capacity. The map (Figure 11) shows that West and East Africa and parts of Southeast Asia (Bangladesh, Myanmar, Papua New Guinea and Timor-Leste) are hot-spots of vulnerability. The results also underline that the most vulner-able countries (Tvulner-able 5), such as Haiti, Eritrea, Nigeria and Liberia are character-ized by relatively high levels of poverty, envi-ronmental stress and severe governance problems or even failed states. Table 5 gives an overview of the 10 most vulnerable coun-tries. Maximum potential value for vulner-ability is 1.
Vulnerability of a society as the sum of
susceptibility, lack of coping capacity
and lack of adaptive capacity
Figure 11: Vulnerability map
Table 5: Top 10 most vulnerable coastal countries
2 ERITREA 0.6569
3 SIERRA LEONE 0.6550
1 HAITI 0.6597
RANK COUNTRY VULNERABILITY VALUE
4 MOZAMBIQUE 0.6485
5 LIBERIA 0.6476
6 PAPUA NEW GUINEA 0.6353
7 VANUATU 0.6306
8 NIGERIA 0.6306
10 BENIN 0.6194
COASTS A
T RISK
|
18
from its exposure to natural hazards. The influence of vulnerability on risk is distinct and plays a central role in the determination of risk to natural hazards and climate change. This case is best illustrated by considering Haiti and New Zealand, which have similar levels of ex-posure to natural hazards (the exex-posure in Haiti is even lower than in New Zealand: value 0.0478; New Zealand: value 0.0484), but it is evi-dent that New Zealand’s low vulnerability (value: 0.3099) compared to Haiti (value: 0.6597) ranks it lower in the overall C@R index (New Zealand: risk value: 0.0150 and rank: 46; Haiti: risk value: 0.0316, rank: 28).
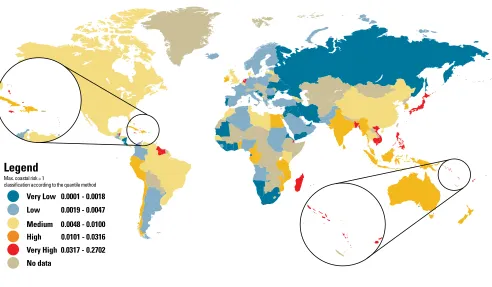
Coasts@Risk Index
The coastal areas highlighted as most at risk are in Southeast Asia, the Caribbean and in Oceania, and in particular the SIDS (Figure 12, Table 6). Surprisingly, countries in Africa such as Namibia, Cote d’Ivoire, Liberia and Ghana are identified as at Very Low risk to coastal haz-ards. This is primarily attributed to a Very Low exposure towards coastal hazards (Figure 7). However, taking their Very High vulnerability into account (Figure 11), one could imagine what could happen if an incalculable extreme event were to hit those countries. Overall, there is a strong influence of exposure on the final risk value because vulnerability multiplies the weight of that factor in the overall risk equa-tion. For example, Japan and the Netherlands have a relatively high risk level for developed countries, mainly caused by the high level of exposure (for the Netherlands the main driver is sea level rise), while the vulnerability levels are rather low compared to less-developed countries. The results show clearly that the social vulnerability of a country is very separate
Low 0.0019 - 0.0047
Medium 0.0048 - 0.0100 High 0.0101 - 0.0316 Very High 0.0317 - 0.2702 No data
Very Low 0.0001 - 0.0018
Max. coastal risk = 1
classification according to the quantile method
Legend
Table 6: Top 10 coastal countries with the highest risk
2 TONGA 0.2482
3 SAINT KITTS AND NEVIS 0.2366 1 ANTIGUA AND BARBUDA 0.2702
RANK COUNTRY RISK VALUE
4 VANUATU 0.1508
5 FIJI 0.1254
6 BRUNEI DARUSSALAM 0.1093
7 BANGLADESH 0.1056
8 PHILIPPINES 0.1003
10 KIRIBATI 0.0830
9 SEYCHELLES 0.0851
19
|
COASTS A
T RISK
salt marsh, seagrass and oyster reefs are simply not glob-ally available. Coastal habitats, and in particular coral reefs and mangroves, provide crucial risk reduction ben-efits that include exposure reduction, nutrition and the provision of livelihoods (including fishery and tourism). These benefits are explained more fully in Chapters 4 and 5. This indicator is calculated as the percentage of a country’s population that lives below 10m elevation and within 10 km of a reef or a mangrove forest. These are the low-lying exposed populations near reefs and mangroves that are likely to receive risk reduction benefits from these habitats (see section 5.2 and Ferrario et al. 2014 for a fuller discussion of these considerations). Additionally the overall availability of tropical data for two of the fisher ies indicators (fish catch and stock status) is limited (see Discussion Section and Chapter 5). The Tropical C@R
The C@R for tropical nations
Vulnerability and risk were examined further in tropical nations for two reasons. First all of the most at-risk na-tions are tropical (Table 6) and second an analysis of the effects of natural capital on overall risk could be further expanded because of data availability on tropical coastal habitats. The core addition to this “Tropical C@R” Index was the “Percentage of population that may receive risk reduction from reefs and mangroves” (Figure 2 Indicator “J” under susceptibility). In the future, this indicator could be expanded globally as an indicator for all coastal habitats, not only tropical ones. However, this is one of the few cases where data—and specifically—coastal habi-tat data are far better for tropical nations than for tem-perate nations. Data for key temtem-perate habitats such as
Figure 13: Results for the tropical indices of susceptibility, vulnerability and risk
Tropical Susceptibility Index
Dependent on public infrastructure, income, economic
framework and natural capital
Tropical Vulnerability Index
Vulnerability of a society as the sum of susceptibility, lack
of coping capacity and lack of adaptive capacity
Tropical Coast @ Risk Index
Risk as the combination of exposure and vulnerability
very low 0.2203 - 0.2781
low 0.2782 - 0.3188
medium 0.3189 - 0.3727
high 0.3728 - 0.4797
very high 0.4798 - 0.5739
no data
very low 0.3280 - 0.4320
low 0.4321 - 0.4782
medium 0.4783 - 0.5186
high 0.5187 - 0.6052
very high 0.6053 - 0.6829
no data
very low 0.0004 - 0.0028
low 0.0029 - 0.0085
medium 0.0086 - 0.0183
high 0.0184 - 0.0510
very high 0.0511 - 0.2651
COASTS A
T RISK
|
20
Index was calculated using the same approach as for the C@R Index, but with the narrower geographic focus and the addition of 1 key indicator. The data availability for reefs and mangroves enabled the analysis for 90 tropical countries.
Tropical C@R results
The additional results presented here for the Tropical C@R Index focus only on susceptibility, vulnerability and risk (Figure 13), as no new indicators for coping and adaptive capacities were added.
In considering just the top 10 most susceptible coun-tries, eight of the most susceptible countries in the Tropical C@R Index are African (Table 7). Compared to the top 10 countries of the C@R Index (filtered with tropi-cal countries), the rankings for Vanuatu, the Comoros and Eritrea changed. The susceptibility of Vanuatu and the Comoros was reduced when the reefs and mangroves
indicator was added. Almost half of the populations of Vanuatu and the Comoros benefits from coral reefs and mangroves (Vanuatu: C@R Susceptibility rank: 2 and Tropical C@R: Susceptibility rank 6; Comoros: C@R Susceptibility rank: 5 and Tropical C@R: Susceptibility rank 9). Eritrea is more susceptible compared to the over-all C@R Index rankings because only 2% of the popula-tion benefits from reefs and mangroves (C@R rank: 9 and Tropical C@R: rank 5).
The influence of this “reefs and mangroves” indicator also affects the overall vulnerability scores (Table 7). For example, Eritrea and Haiti changed their ranks compared to the C@R ranking due to the lower percentage of people who are likely to receive benefits from reefs and man-groves (index value: Haiti: 19% and Eritrea: 1.9%). Within the top 10 ranking, Vanuatu and Benin changed com-pared to the C@R rankings. Vanuatu improved four ranks from rank 7 (C@R) to rank 11 (tropical C@R) due to the benefits they are likely to receive from reefs (index value: Table 7: Top 10 tropical countries for susceptibility compared with top 10 countries from the C@R index filtered with tropical countries and top 10 countries for tropical vulnerability and Tropical C@R
RANK SUSCEPTIBILITY RANK SUSCEPTIBILITY RANK VULNERABILITY RANK TROPICAL (TROPICAL C@R) (C@R) (TROPICAL C@R) COASTS@RISK
1 SIERRA LEONE 1 SIERRA LEONE 1 ERITREA 1 ANTIGUA AND
BARBUDA
2 MADAGASCAR 2 VANUATU 2 HAITI 2 TONGA
3 MOZAMBIQUE 3 MADAGASCAR 3 LIBERIA 3 SAINT KITTS
AND NEVIS
4 LIBERIA 4 MOZAMBIQUE 4 SIERRA LEONE 4 VANUATU
5 ERITREA 5 COMOROS 5 MOZAMBIQUE 5 FIJI
6 VANUATU 6 LIBERIA 6 PAPUA NEW GUINEA 6 BRUNEI DARUSSALAM
7 TANZANIA 7 TANZANIA 7 NIGERIA 7 BANGLADESH
8 PAPUA NEW GUINEA 8 PAPUA NEW GUINEA 8 BENIN 8 PHILIPPINES
9 COMOROS 9 ERITREA 9 TOGO 9 SEYCHELLES
21
|
COASTS A
T RISK
45.50%). Benin changed from rank 10 (C@R ranking) to rank 8 within the Tropical C@R ranking as they are likely to receive few benefits from reefs and mangroves. The ranking of top 10 countries of the Tropical C@R index does not change compared to the C@R index ranking (see Tables 6 and 7), which owes most importantly to the influence of exposure overall.
New environmental indicators
of vulnerability
A core addition the C@R Index makes to the WorldRiskIndex is the inclusion of several new indicators that focus on the connection be-tween environment and vulnerability. These indicators include three new fishery indicators for the whole index and a fourth habitat indica-tor (reefs and mangroves) for the tropical in-dex. These are in addition to the four environ-mental indicators (E-H in the adaptive capacity component from the Yale Environmental Performance Index 2012) that were considered in the WorldRiskIndex. Coastally focused envi-ronmental indicators were added into each component of the assessment of vulnerability as recommended in the WorldRiskReport 2012 (Welle et al., 2012). Natural assets and the con-dition of those assets have a clear link to disas-ter risk reduction (Welle et al., 2012).
Figure 14: Environmental scores for tropical countries based on eight environmental indicators (fish catch, fish management effectiveness, fish stock status, benefits from reefs and mangroves, water resources, biodiversity and habitat protection, forest management, agricultural management)
Under susceptibility, a natural capital component was added to in-clude a measure of the total marine fish catch in each nation and to consider the value of reefs and mangroves. Within coping capacity fish management effectiveness is an indicator of the value of gover-nance of fisheries. In general, coping capacity is assumed to be close-ly tied to the effectiveness of current governance. Under adaptive capacity, fish stock status was added to the four natural assets indica-tors from the Yale EPI 2012. It is assumed that when fish stocks, as with other resources, are in better condition, they increase the adap-tive capacity by creating more resource options for the future.
These environmental indicators described significant variation in social vulnerability. First, all seven global environmental indicators were equally weighted and calculated to an overall index. This index represented the scores for environmental status (very high=1, very low=0). In the global analyses, this indicator was significantly and negatively correlated with overall vulnerability (r2=0.10, with p ≤ 0.01);
Very Good Environmental status = 1
Very low 0.3047 - 0.4385 Low 0.4385 - 0.4761 Medium 0.4762 - 0.5154 High 0.5155 - 0.5478 Very High 0.5479 - 0.7725
No data or landlocked country
2 LIBYA 0.318
3 MAURITANIA 0.319
1 CAPE VERDE 0.305
RANK COUNTRY ENVIRONMENTAL VALUE
4 ERITREA 0.325
5 HAITI 0.334
6 TIMOR-LESTE 0.379
7 LIBERIA 0.392
8 ALGERIA 0.397
10 NIGERIA 0.416
9 GUATEMALA 0.409
COASTS A
T RISK
|
22
where environmental status was greater, vulnerability was lower. The same analysis was repeated solely for tropical countries (90 countries, see Figure 14) with the addition of the indicator for reef and mangrove natural habitat capital. In this case the relationship was even stronger in its significant and negative correlation
(r2=0.15, p ≤ 0.01). These results show these
environmen-tal indicators are linked to social vulnerability, and that this linkage is even stronger in tropical countries where the connection between people and environment is criti-cal. The top 10 countries within the tropics with the low-est environmental values are shown in Table 8.
2.5 Conclusion
The C@R Index helps to understand the risks that nations face from coastal hazards and social vulnerability and identifies where environmental degradation contributes to this vulnerability. The results of the index should facili-tate further discussions on how to reduce exposure and susceptibility and increase coping and adaptive capaci-ties to natural coastal hazards including the impacts of climate change. This analysis also helps highlight the crucial role that natural resources can play in disaster risk reduction and risk management.
There are important limitations to any index, which in-clude subjectivity regarding variable selection and weighting; lack of data availability for key variables; nor-malization; problems with aggregation to different scales and difficulties validating the results (OECD, 2008). Composite indices are much like mathematical or com-putational models. As such, they are constructs; there are no universally accepted scientific rules for exactly how they should be encoded. As for models, the justification for a composite indicator lies in its fitness to the intended purpose and the acceptance of peers (Rosen, 1991). In this regard the WorldRiskIndex, which offers the base for the C@R Index, was approved by scientists and practitio-ners during an international symposium and also was published in peer reviewed literature (Welle et al., 2013). The C@R team ran a reliability analysis and sensitivity analysis to proof the model assumptions. The reliability analysis resulted in a Cronbachs Alpha= 0.889, which describes a very good correlation between model output and input variables. The sensitivity analysis showed that all indicators have a median greater than zero, indicating that every indicator contributed sufficiently to the model
output (see Appendix at http://www.ehs.unu.edu/ CoastsatRisk for more details). Also, as with any model, the effectiveness of the outputs relies on the quality of the data used. The accuracy of the indicators provided in the global data and their ability to effectively and equally capture conditions across a range of latitudes impact the reliability of the outputs. For example, the C@R Index can only be calculated for 139 coastal nations, and thus not all SIDS could be considered because either socio-eco-nomic or exposure data were not available (more infor-mation regarding the individual indicators could be found in the Appendix at http://www.ehs.unu.edu/ CoastsatRisk). Also some of the data used to calculate fish related indicators (i.e., fish catch and stock status) are known to be less reliable for some tropical countries in particular given limitations in fisheries data collection in those countries. These issues are common to virtually all global indicators, yet there is still a pressing need for quantitative indicators to help in reducing complexity, measuring progress, mapping and setting priorities, which makes them an important tool for decision makers (Cutter et al., 2008).