APPLICATION OF FIVE-STAGE CONCEPTUAL TEACHING MODEL BY UTILIZING CMAPTOOLS TO ANALYZE CONCEPTUAL CHANGE AND COGNITIVE LEARNING
OUTCO
MES ON LIGHT AND OPTICS TOPIC
RESEARCH PAPER
Submitted as requirement to obtain degree of Sarjana Pendidikan in International Program on Science Education study program
Arranged By:
Muhammad Rifqi Rofiuddin 1002326
INTERNATIONAL PROGRAM ON SCIENCE EDUCATION FACULTY OF MATHEMATICS AND SCIENCE EDUCATION
INDONESIA UNIVERSITY OF EDUCATION BANDUNG
Application of Five-Stage Conceptual Teaching Model by Utilizing
CmapTools to Analyze Conceptual Change and Cognitive Learning
Outco
mes on Light and Optics Topic
Oleh
Miuhammad Rifqi Rofiuddim
Sebuah skripsi yang diajukan untuk memenuhi salah satu syarat memperoleh gelar Sarjana pada Fakultas Pendidikan Matematika dan Ilmu Pengetahuan Alam
© Muhammad Rifqi Rofiuddin 2014 Universitas Pendidikan Indonesia
Agustus 2014
Hak Cipta dilindungi undang-undang.
Muhammad Rifqi Rofiuddin, 2014
APPLICATION OF FIVE-STAGE CONCEPTUAL TEACHING MODEL BY UTILIZING CMAPTOOLS TO ANALYZE CONCEPTUAL CHANGE AND
COGNITIVE LEARNING OUTCOMES ON LIGHT AND OPTICS TOPIC
Muhammad Rifqi Rofiuddin
International Program on Science Education
ABSTRACT
Science teachers need to help students identify their prior ideas and modify them based on scientific knowledge. This process is called as conceptual change. One of essential tools to analyze students’ conceptual change is by using concept map. Concept Maps are graphical representations of knowledge that are comprised of concepts and the relationships between them. Constructing concept map is implemented by adapting the role of technological information and communication, as it is suitable with Educational Ministry Regulation No.68 year 2013 that stated the aids of multimedia to support learning process. Institute for Human and Machine Cognition (IHMC) has developed CmapTools, a client-server software for easily construct and visualize concept maps. This research aims to investigate secondary students’ conceptual change and cognitive learning outcomes after experiencing five-stage conceptual teaching model by utilizing CmapTools in learning Light and Optics. Convergent parallel mixed method is implemented in order to collect and assess conceptual change as qualitative data and cognitive learning outcomes as quantitative data. Sample was taken purposively (n= 22 students) at grade VIII in an International School Bandung, West Java. Conceptual change based on comparison of preliminary and post concept map construction is assessed based on rubric of concept map scoring and structure whereas cognitive learning outcomes is assessed based on normality gain in each cognitive level from C1 (remembering) until C4 (analyzing) aspect. Results shows significance conceptual change differences at 50.92 % that is elaborated into concept map element based on Novak and Gowin’s criteria such as prepositions and hierarchical level in high category, cross links in medium category and specific examples in low category. Strong correlation coefficient (rxy = 0.78) illustrates the implementation of five-stage conceptual teaching model by utilizing CmapTools in helping students to construct concept map is capable to improve secondary students’ cognitive learning outcomes in high category that is obtained based on normalized gain value <g = 0.86>. All of the results are supported with the students’ positive response towards CmapTools utilization that indicates improvement of motivation, interest, and behavior aspect towards Physics lesson.
Muhammad Rifqi Rofiuddin, 2014
Application Of Five-Stage Conceptual Teaching Model By Utilizing Cmaptools To
APLIKASI MODEL LIMA TAHAP PEMBELAJARAN KONSEPTUAL DENGAN PENERAPAN CMAPTOOLS UNTUK MENGANALISIS PERUBAHAN KONSEP
DAN HASIL BELAJAR KOGNITIF PADA TOPIK CAHAYA DAN OPTIK
Muhammad Rifqi Rofiuddin
International Program on Science Education
ABSTRAK
Muhammad Rifqi Rofiuddin, 2014
TABLE OF CONTENTS
DECLARATION ... i
ABSTRACT ... ii
PREFACE ... iii
TABLE OF CONTENTS ... vi
LIST OF FIGURES ... viii
LIST OF TABLES ... xii
LIST OF APPENDICES ... xiv
CHAPTER I INTRODUCTION ... 1
A. Background ... 1
B. Research Problem ... 5
C. Research Questions ... 5
D. Limitation of Problems ... 6
E. Research Objectives... 7
F. Research Benefits ... 7
CHAPTER CONCEPTUAL CHANGE, CONCEPT MAP, CMAPTOOLS,COGNITIVE LEARNING OUTCOMES, LIGHT AND OPTICS ... 9
A. Concept, Conception and its Acquisition Process ... 9
B. Conceptual Change ... 11
C. Concept Map for Mapping Conceptual Change ... 16
D. CmapTools for Facilitating Concept Maps Construction ... 20
E. Cognitive Learning Outcomes ... 24
G. Assumptions ... 37
H. Hypothesis ... 37
CHAPTER III METHODOLOGY ... 38
A. Location and Subject ... 38
B. Research Method and Design ... 38
C. Operational Definition ... 40
D. Research Instrument ... 41
E. Instrument Development and Analysis ... 42
F. Data Collection Technique ... 49
G. Data Processing and Analysis ... 54
H. Research Procedure ... 60
I. Research Scheme ... 65
CHAPTER IV RESULT AND DISCUSSION ... 66
A. Research Results ... 66
B. Research Discussion ... 79
CHAPTER V CONCLUSION AND SUGGESTION ... 128
A. Conclusion ... 128
B. Suggestion ... 129
REFERENCES ... 130
APPENDICES ... 134
LIST OF FIGURES
Figure 2.1 The Five-Stage Conceptual Teaching Model ... 15
Figure 2.2 Concept Map Structure ... 18
Figure 2.3 CmapTools Interface ... 21
Figure 2.4 CmapTools Utilization for Linking Concept Node to Many Resources ... 22
Figure 2.5 Rectilinear Experiment ... 29
Figure 2.6 Law of Light Reflection ... 30
Figure 2.7 Specular and Diffuse Reflection ... 31
Figure 2.8 Elements of Curved Mirror ... 31
Figure 2.9 Three Special Rays in Curved Mirror ... 32
Figure 2.10 Image formation of concave and convex mirror in front of Focal point ... 34
Figure 2.11 Three Special Rays in Convex and Concave Lens ... 36
Figure 2.12 Image formation of concave and convex lens behind Focal Point .. 36
Figure 3.1 Convergent Parallel Design ... 40
Figure 3.2 Diagram of Research Scheme ... 65
Figure 4.2 Graph of Students’ Conceptual Change based on Percentage Score of Preliminary and Post Concept Map in each Novak and
Gowin’s Criteria ... 68
Figure 4.3 Graph of Students’ Concept Map Structure based on Preliminary and Post Concept Map ... 69 Figure 4.4 Improvement of Map Structure of Student 15 ... 70 Figure 4.5 The Ability of Student 15 in Visualizing Concept Node by
Linking to Videos and Interactive Flash. ... 71 Figure 4.6 Graph of Students’ Cognitive Improvement in Learning Light
and Optics after CmapTools Utilization. ... 73 Figure 4.7 Graph of Students’ Improvement in Four-Leveled Cognitive
Domain. ... 74 Figure 4.8 Graph of Students’ Response towards CmapTools utilization. ... 78 Figure 4.9 Comparison of Preliminary and Post Concept Map of
Student 3. ... 91 Figure 4.10 Comparison of Preliminary and Post Concept Map of
Student 5. ... 92 Figure 4.11 Comparison of Preliminary and Post Concept Map of
Student 10. ... 93 Figure 4.12 Comparison of Preliminary and Post Concept Map of
Student 13 ... 94
Figure 4.13 Comparison of Preliminary and Post Concept Map of
Figure 4.14 Comparison of Preliminary and Post Concept Map of
Student 16. ... 96 Figure 4.15 Comparison of Preliminary and Post Concept Map of
Student 22. ... 97 Figure 4.16 Comparison of Preliminary and Post Concept Map of
Student 1. ... 105 Figure 4.17 Comparison of Preliminary and Post Concept Map of
Student 4. ... 106 Figure 4.18 Comparison of Preliminary and Post Concept Map of
Student 9 ... 107 Figure 4.18 Comparison of Preliminary and Post Concept Map of
Student 9 ... 107 Figure 4.19 Comparison of Preliminary and Post Concept Map of
Student 12 ... 108 Figure 4.20 Comparison of Preliminary and Post Concept Map of
Student 17 ... 109 Figure 4.21 Comparison of Preliminary and Post Concept Map of
Student 18 ... 110 Figure 4.22 Comparison of Preliminary and Post Concept Map of
Figure 4.23 Comparison of Preliminary and Post Concept Map of
Student 2 ... 116 Figure 4.24 Comparison of Preliminary and Post Concept Map of
Student 6 ... 117 Figure 4.25 Comparison of Preliminary and Post Concept Map of
Student 7 ... 118 Figure 4.26 Comparison of Preliminary and Post Concept Map of
Student 8 ... 119 Figure 4.27 Comparison of Preliminary and Post Concept Map of
Student 11 ... 120 Figure 4.28 Comparison of Preliminary and Post Concept Map of
Student 19 ... 121 Figure 4.29 Comparison of Preliminary and Post Concept Map of
LIST OF TABLES
Table 2.1 Core Competence and Basic Competence of Light and Optics
... 28
Table 3.1 Interpretation of Difficulty Level ... 43
Table 3.2 Interpretation of Discriminator Power ... 44
Table 3.3 Interpretation of Validity ... 45
Table 3.4 Interpretation of Reliability ... 46
Table 3.5 Recapitulation of Test Item for Students’ Cognitive Outcomes ... 47
Table 3.6 Concept Map Scoring Rubric ... 49
Table 3.7 Concept Map Structure Rubric ... 51
Table 3.8 Blueprint of Objective Questions to Measure Cognitive Learning Outcomes ... 52
Table 3.9 Blueprint of Students’ Response Questionnaire ... 54
Table 3.10 Concept Map Scoring Interpretation ... 55
Table 3.11 Category Scale of Students’ Score ... 55
Table 3.12 Criteria of N Gain Improvement ... 57
Table 3.13 Scoring Guideline of Students’ Response ... 58
Table 3.14 Percentage Interpretation of Questionnaire ... 58
Table 4.1 Recapitulation of Students’ Conceptual Change based on
Preliminary and Post Concept Map Scoring ... 67 Table 4.2 Recapitulation Students’ Score of Preliminary and Post Concept
Map based on Novak and Gowin’s Criteria ... 68
Table 4.3 Recapitulation of Students’ Concept Map Structure ... 69 Table 4.4 Recapitulation of Students’ Cognitive Learning Outcomes based
on Statistical Test ... 72 Table 4.5 Recapitulation of Students’ Cognitive Domain based on
Anderson’s Taxonomy ... 73
LIST OF APPENDICES
A. INSTRUCTIONAL TOOLS ...134
A.1. LESSON PLAN ...134
1. Lesson Plan 1st Meeting ...134
2. Lesson Plan 2nd Meeting ...136
3. Lesson Plan 3rd Meeting ...139
4. Lesson Plan 4th Meeting ...142
A.2. WORKSHEET ...144
1. Worksheet 2nd Meeting ...144
2. Worksheet 3rd Meeting ...147
B. RESEARCH INSTRUMENT ...149
B.1. Objective Test of Light and Optics ...149
B.2. Questionnaire towads CmapTools Utilization ...158
B.3. Expert Concept Map ...161
B.4. Observation Sheet ...162
B.5. Preliminary Study Instruments ...169
C. INSTRUMENT JUDGEMENT AND TRIAL ...172
C.1. Analysis of Objective Test ...172
C.2. Analysis of Expert Concept Map ...186
C.3. Objective Test Validation Results ...190
D. RESEARCH DATA RESULTS...192
D.1. Recapitulation of Five-Stage Conceptual Teaching Model Learning Activities ...192
D.2. Data Distribution of Preliminary Concept Map ...196
D.3. Data Distribution of Post Concept Map ...197
D.4. Data Distribution of Pretest ...198
D.5. Data Distribution of Posttest ...199
D.7. Normalized Gain Recapitulation of C1 (Remembering) Aspect ...201
D.8. Normalized Gain Recapitulation of C2 (Understanding) Aspect ...202
D.9. Normalized Gain Recapitulation of C3 (Applying) Aspect ...203
D.10. Normalized Gain Recapitulation of C4 (Analyzing) Aspect ...204
D.11. Normality Test Result ...205
D.12. Hypothesis Test Result ...206
D.13. Data Distribution of Students’ Worksheet ...207
D.14. Recapitulation of Students’ Response Towards CmapTools Utilization ...208
D.15. Preliminary Study (Questionnaire Results) ...210
D.16. Preliminary Study (Teacher Interview Results) ...211
E. RESEARCH ADMINISTRATION ...213
E.1. Research Permission Letter ...213
E.2. Statement Letter of Research Completion ...214
1
CHAPTER I
INTRODUCTION
A. Background
Students are viewed as goal-directed agents who actively seek information as it is stated based on Piaget (1978) that they come to formal education with prior knowledge, skills, beliefs and concepts that significantly influence what they notice about the environment and how to organize and interpret it in order to develop their thinking process. The process of transferring knowledge especially during teaching and learning science is focused on the completion of thinking pattern as stated on Educational Ministry Regulation No.68 year 2013 that involves nine main aspects such based on student-centred approach, interactive learning, network based learning, active learning, team-based learning, multimedia based learning, independent learning based on students’ needs, multidiscipline that integrate essentials knowledge and critical learning.
2
In the implementation of science teaching and learning, those expectations are not promising. According to preliminary study that is conducted by the researcher that aims to figure out students’ problem in learning Physics, it is obtained that most of students find several obstacles and difficulties that describes by these statements:
1. Based on the average of mid-term Physics exam results, it is obtained that only three students or 13.64% pass the criterion standard at 80 whereas the rest of them or 86.36% have score below.
2. Majority of Students state that physics lesson is extremely difficult that covers 86.36% from total twenty two respondents whereas 13.64% feel also that physics lesson is difficult.
3. Several factors that underlined difficulties in learning Physics such as low motivation in learning is stated by 9.09% of students as well as high achievement standards, inclusion of complicated formulas is stated by 18.18% of students, and mostly students think that lack of learning media involvement is considered as main factor that covers 63.64% of total respondents.
4. Students cannot be independent to construct their own idea because they prefer to learn in group based learning as stated on questionnaire result that covers 59.09%.
5. Students’ motivation in learning is low that is indicated by their response of 72.73% that states willingness to review Physics material only while exam is announced as well as 22.73% of students review only if there is homework or group assignment.
6. The learning environment is not supported as stated by 77.23% students that feel boring to conduct the lesson.
3
specific software in order to visualize concept. The role of teacher during instructional process is also dominant because teacher often uses speech with the lack of discussion process that is stated by 59.09% students. After doing self-reflection as stated on interview result, teacher thinks that inappropriate teaching method and media is considered as main factor of lower cognitive outcomes although remedial program is already conducted.
Two main problems underline students’ low achievement results based on preliminary study through questionnaire and teacher interview. These problems are classified into two; the inappropriate method and time for students to construct their own concept and the lack use of learning media in science teaching and learning process. In order to overcome those problems; method based on constructivism is essential in order to improve students’ independence in learning as well as thinking process. Students actively construct new information by making use of their prior knowledge and experience; therefore they construct their own understanding through the interaction with the physical and social environment (Liang and Gabel, 2005). Therefore, learning process develops students strongly held assumptions or ideas that are not consistent with accepted scientific understanding (Posner et.al, 1982). As a result, science teaching and learning must address these ideas.
4
acquisition and accommodation of new knowledge as maps are modified over time (Kern and Crippen, 2008).
Constructing concept map can be implemented by adapting the role of technological information and communication, as it is suitable with Educational Ministry Regulation No.68 year 2013 that stated the aids of multimedia to support learning process. Bennett, 2003 (in Qarerah, 2010) explains that as technology has become ever central to schooling, assessing students via technology-based methods will be increasingly required. With the help of ICT tools such as computer and software, complex Physics concepts can be visualized statically or dynamically i.e, graphic animation (Utari et al, 2013).
Institute for Human and Machine Cognition (IHMC) has developed CmapTools, software that provide many capabilities for the creation of concept maps including highly intuitive, modeless editor and the ability to connect links into several trusted resources through serves (Canas et al. 2003). This software is designed based on client-server architecture that allows users to browse and share concept map that is stored in CmapServers distributed throughout the network by supporting synchronous and asynchronous collaboration (Granados, 2003). Synchronous collaboration through CmapTools allows two users to construct concept maps simultaneously in spite of at different place, meanwhile asynchronous collaboration through CmapTools is existed by the role of Concept Map sharing and Knowledge Soups that allow users to add or modify annotations and discussion threads (Canas et al. 2003). The knowledge soups that is stored in CmapServer allows students from distant schools to share claims (propositions) derived from their concept maps regarding with any domain of knowledge being studied (Canas et al. 2003).
5
map to another (Canas et al. 2003). CmapTools also provide beneficial features that allows user to easily construct knowledge model; a set of concept maps and associated resources about a particular domain of knowledge (Canas et al. 2003). Users can create concept map based on their conceptual understanding by establishing informative linking words and cross links, therefore publish and share them through CmapServers, social media or personal websites.
Based on the statement above, it is essential to implement research that able to investigate students’ conceptual change by optimizing the role of technology through CmapTools utilization. Conceptual change can be investigated under conceptual teaching strategy that involves concept acquisition process by modifying students’ prior conception. Therefore, the researcher has intention to conduct research entitles, “Application of Five-Stage Conceptual Teaching Model by Utilizing CmapTools to Analyze Conceptual Change and Cognitive
Learning Outcomes on Light and Optics Topic.”
B. Research Problem
According to the background which has already stated, the problem of this research is formulated into: “How is secondary student’s conceptual change and cognitive learning outcomes after experiencing five-stage conceptual teaching model by utilizing CmapTools in learning Light and Optics?”
C. Research Questions
Based on the research problem that has been stated before, there are several specific questions that come up to be answered by the results of this study, as follow:
6
2. How is the improvement of secondary students’ cognitive learning outcomes in learning Light and Optics after utilizing CmapTools under five-stage conceptual teaching model?
3. How is the correlation of secondary students’ conceptual change by utilizing CmapTools towards cognitive learning outcomes in learning Light and Optics?
4. How is student’s response towards CmapTools utilization in learning Light and Optics?
D. Limitation of Problem
The problem stated is limited to the aspects as follow:
1. Conceptual change based on students’ preliminary and post concept map is limited on quantitative and qualitative domain. Quantitative domain deals with concept map validity that covers four main aspects; relationship, hierarchy level, cross link, and examples (Novak, 1984 in Karakuyu, 2010) based on scoring rubric that is developed by researcher together with experts, whereas qualitative aspect deals with form of concept map into spoke, chain or net (Kinchin et. al., 2000) as well as indication of misconception including the acquisition and accommodation of new knowledge (Kern and Crippen, 2008).
2. Cognitive learning outcomes that is measured in this research is limited into C1 level (remembering), C2 level (understanding), C3 level (applying), and C4 level (analyzing) based on Anderson’s and Krathwohl's Taxonomy.
3. Students’ response towards CmapTools utilization is limited into four indicators that is arranged based on students’ internal factors towards Physics lesson.
7
refraction including refraction in lenses as well as nature of image formation in various distance using geometrical optic formula in curved mirror and lenses, also the application of mirror and lenses in daily life. Deeper comprehension of interference, diffraction pattern and polarization of light waves will not be investigated since those are classified into advance concepts that might produce confusion and further misconception for secondary level.
E. Research Objectives
According to research problems and questions that are stated above, this research aims to investigate several aspects as follow:
1. Investigate significance of secondary student’s conceptual change in Learning Light and Optics by comparing preliminary and post concept map construction through quantitative and qualitative analysis.
2. Investigate secondary students’ improvement of cognitive learning outcomes in learning Light and Optics by comparing pretest and posttest results through quantitative analysis.
3. Analyze the correlation between secondary students’ conceptual change and cognitive learning outcomes.
4. Investigate secondary students’ response towards CmapTools utilization in facilitating concept map construction.
F. Research Benefits
It is expected that the results of this study able to conquer these following benefit aspects:
8
comprehension by constructing concept maps with great validity. The role of CmapToolsis possible to improve their interest while learning physics’ concept that deals with daily life phenomena, so that they are able to achieve better result of cognitive outcomes compared to traditional teaching method.
2. For students, along with the existence of this research, they can feel new experience in constructing concept map using CmapTools for making interconnection and interrelation within one concept and another. Students will experience deeper concept mastery that prevents memorizing; because CmapTools provides constructive idea for students to dig scientific concepts as well as benefits in visualizing concepts.
3. For other researchers, this study may use as precious references in analyzing how CmapTools affects the significance of students’ conceptual change and cognitive learning outcomes as well as response towards physics lesson by understanding research treatment and essential instruments in supporting better results such as concept map scoring rubric and physics pretest and posttest questions with good discrimination power, difficulty level, validity and reliability based on Anderson’s Taxonomy. 4. For further research, it is expected to analyze CmapTools utilization for
38
CHAPTER III
RESEARCH METHODOLOGY
A. Location and Subject
1. Research Location and Period
The research was conducted at International School in Bandung, West Java that applied 2013 Curriculum during instructional process. Data is obtained in the period of May until June 2014.
2. Population and Sample
Population is defined as generalization consists of objects or subjects that cover whole quality and specific properties; meanwhile sample is a part of whole quality and specific properties of population (Sugiyono, 2008:118)
The population of this research is all of students’ significance in conceptual change and cognitive learning outcomes that belongs to all secondary students in the school. Samplings are selected by purposive sample technique since researcher has the specific objective. The sample is all of students’ significance in conceptual change and cognitive learning outcomes under the topic of light and optics that consists of 22 students of VIII Grade.
B. Research Method and Design
1. Research Method
39
mapping the preliminary and post concept map is required in order to analyze its relation towards cognitive learning outcomes that is assessed quantitatively through statistical means; therefore mixed method is developed in this research. Research variables are classified into two; independent variable (X) and dependent variable (Y) that is affected by the treatment process. Five-stage conceptual teaching model by utilizing CmapTools is the independent variable, whereas the dependent variable is students’ cognitive learning outcomes.
2. Research Design
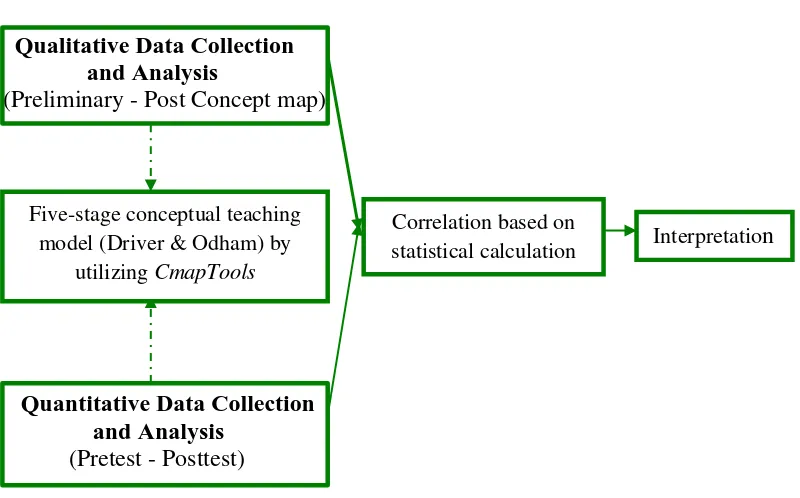
Type of mixed method design that is applied in this research is convergent parallel that simultaneously collect both quantitative and qualitative data, merge the data and use the results to understand research problem. The datasets is analyzed separately based on its own indicator in order to make interpretation as to whether the results support or contradict each other that provides a convergence of data sources (Creswell, 2011).
Students’ preliminary and post concept map will be analyzed qualitatively based on the scoring rubric that is developed by researcher and experts based on Novak’s criteria (1984, in Karakuyu, 2010) including concept map pattern based on Kinchin (1999 in Hay and Adams, 2000). Concept elaboration of each individual that is developed can be analyzed descriptively based on comparison of preliminary and post concept map construction. Qualitative investigation is also concern on students’ ability in linking concept node to various resources by utilizing CmapTools to understand their thinking process.
Quantitative analysis focuses on students’ cognitive learning outcomes that is obtained from pretest and posttest result by statistical calculation in order to investigate achievement in each cognitive domain; from C1 (remembering) until C4 (analyzing).
40
Figure 3.1 below represents the convergent parallel design for better understanding.
Qualitative Data Collection and Analysis
(Preliminary - Post Concept map)
Quantitative Data Collection and Analysis
(Pretest - Posttest)
Figure 3.1 Type of Mixed Method Design; Convergent Parallel (Cresswell, 2012: 541)
C. Operational Definition
Operational definition is required in order to give the clarity of the research that has to be suitable with the expected aims; that described as follows:
1. Conceptual change is the significance change of students’ conception in learning Light and Optics based on comparison of preliminary and post concept map construction that emphasizes on significance changing of concept map criteria into relationship, hierarchical structure, cross link and specific example as well as significance changing of concept map structure into spoke, chain or net under five stage conceptual teaching model consists of orientation, elicitation, restructure, application and review change of ideas. 2. Concept map is a visual set of concepts aims to answer focus question.
According to Novak (1984) concept map is constructed under four elements; Interpretation Five-stage conceptual teaching
model (Driver & Odham) by utilizing CmapTools
41
such as (1) prepositions is the connection among concept node through the inclusion of meaningful an informative linking words that represents students’ understanding, (2) hierarchical structure based on arrangement from inclusive to exclusive concepts represents concept organization and classification, (3) cross links is the interconnection among concepts in different map segments or domain represents mapping complexity and analysis ability, and (4) example of specific concept node represents concept application.
3. Cognitive learning outcomes is the competencies of students to achieve cognitive dimension after utilizing CmapTools that is determined from C1 (remembering) – C2 (understanding) – C3 (applying) and C4 (analyzing) in learning Light and Optics through pretest and posttest that consists of 25 multiple questions.
4. CmapTools that is used in this research is a prototype media developed by IHMC (Institute of Human and Machine Cognition) that aims to mapping students’ conceptual change based on concept map construction. CmapTools has benefits to link concept node into various learning resources that is used for qualitative analysis to investigate students’ visual learning.
5. Students’ response towards CmapTools utilization is classified into four criteria such as; (1) impression of improvement in learning Physics, (2) interest and motivation towards Physics lesson, (3) improvement of behavior aspect towards Physics lesson, and (4) cognition towards the benefits of CmapTools feature.
D. Research Instrument
The research instrument that is applied for collecting data in this research consists of:
42
and concept map structure rubric (Table 3.7) that aims to analyze changing of map structure that is obtained from preliminary and post concept map construction.
2. Improvement of students’ cognitive learning outcomes is analyzed by implementing objective test (Appendix B.1) in form of multiple questions with four distractors that is obtyained from pretest and posttest.
3. Students’ response towards CmapTools utilization in learning Light and Optics is analyzed based on unstructured questionnaire form (Appendix B.2) that emphasizes on four indicator such as; (1) impression of improvement in learning Physics, (2) interest and motivation towards Physics lesson, (3) improvement of behavior aspect towards Physics lesson, and (4) cognition towards the benefits of CmapTools feature.
E. Instrument Development and Analysis
Research instruments development is initiated with the content analysis of 2013 curriculum that is used in school. Expert concept map as main reference for scoring students’ concept map for investigating conceptual change has to be developed first by the researcher under suggestion from Physics expert (Appendix B.3). The expert concept map is formulated based on the applicable content that has to be suitable with the ability of secondary students.
43
accordance with the questions statement. The instrument analysis of objective test requires levels of difficulty, discriminating power validity and reliability.
1. Instrument Test Requirements a. Level of Difficulty
Good quality question has to be arranged in balanced; the proportion should not consist of whole easy or hard questions, since easy question will not stimulate students to spend more effort in answering as well as hard questions will make students desperate and doesn’t have any motivation to solve it (Arikunto, 2013: 222). Consideration of difficulty level is based on proportion of problem categories easy, medium and difficult. The formula to determine levels of difficulty is represented as follow:
.
Where:
P= difficulty level
B = number of students who answer correctly N= Total number of students
(Arikunto, 2013: 224)
Classification of difficulty level based on Arikunto is represented on Table 3.1 as follow:
Table 3.1 Interpretation of Difficulty Level
No. Difficulty Value Criteria
1. 0.00 – 0.30 Hard
2. 0.31 – 0.70 Middle
3. 0.71 – 1.00 Easy
44
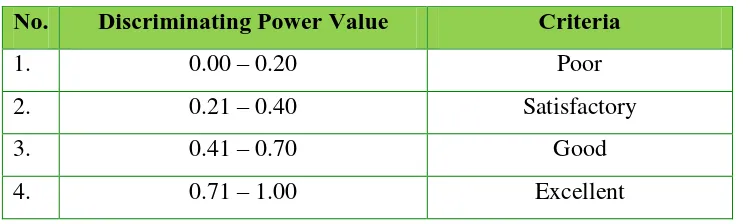
b. Discriminating Power
Discriminating power is defined as the ability of particular question to distinguish students who classified as higher achievement and lower achievement. The amount of higher achievement students who can answer more particular questions compared to lower achievement means that those questions have positive discriminating power index (Arikunto, 2013: 226). Discriminating power index shows the scale from minus one until positive one, with the negative represents lower discriminating power index and vice versa. The formula to determine the discriminating power is represented below followed by criteria as seen on Table 3.2
DP =
Where:
DP = Discriminating Power
Ba = The number of upper group that answer correctly Ja = Total of students in upper group
Bb = The number of upper group that answer incorrectly Jb = Total of students in lower group
(Arikunto, 2013: 228)
Table 3.2 Interpretation of Discriminator Power No. Discriminating Power Value Criteria
1. 0.00 – 0.20 Poor
2. 0.21 – 0.40 Satisfactory
3. 0.41 – 0.70 Good
4. 0.71 – 1.00 Excellent
45
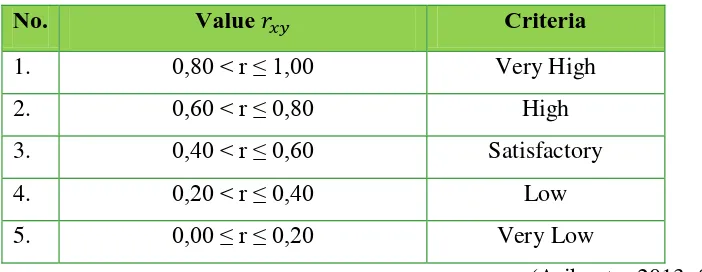
…….. (3.3) c. Validity
Validity is defined as the extent to which the instrument measures what it is designed to measure that emphasizes not on the test itself, but on the result (Arikunto, 2013: 80). Validity which is used in this study is Construct Validity since each question item is formulated based on Cognitive Taxonomy. Arikunto (2013:83) describe construct validity measures thinking aspect based on logical; such as classified question item into cognitive dimension. The formula to determine validity is shown below followed by Table 3.3 that interprets the classification of coefficient correlation criteria.
∑ ∑ ∑
√{ ∑ ∑ } { ∑ ∑ }
Where:
= coefficient correlation or item validity
∑ = sum of total score of all students for each question’s item
∑ = sum of total score of all students for whole test N = total number of students
X = score of each student for each question’s item Y = total score of each student
(Arikunto, 2013: 87)
Table 3.3 Interpretation of Validity
No. Value Criteria
1. 0,80 < r ≤ 1,00 Very High
2. 0,60 < r ≤ 0,80 High
3. 0,40 < r ≤ 0,60 Satisfactory
4. 0,20 < r ≤ 0,40 Low
5. 0,00 ≤ r ≤ 0,20 Very Low
46
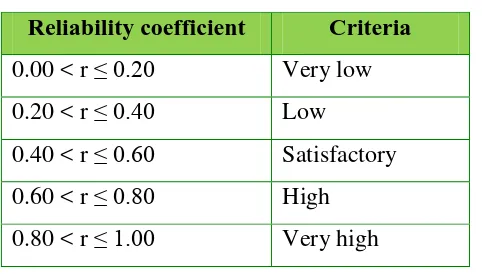
d. Reliability
Reliability is defined as the extent to which a questionnaire, test, observation or any measurement procedure produces the same results on repeated trials. In short, it is the stability or consistency of scores over time or across raters (Arikunto, 2013: 101). The split-half method using KR 20 equation is used to calculate reliability of the test by giving score one for correct answer and zero for wrong answer (Arikunto, 2013: 108). The equation is described as follow:
r
11= (
)(1-∑
)
Where:
r11 = instrument reliability k = amount of test item
∑pq = multiplication result of p and q s = deviation standard
The reliability interpretation represents on the table below.
Table 3.4 Interpretation of Reliability
(Arikunto, 2013: 109) Reliability coefficient Criteria
0.00 < r ≤ 0.20 Very low 0.20 < r ≤ 0.40 Low
0.40 < r ≤ 0.60 Satisfactory 0.60 < r ≤ 0.80 High 0.80 < r ≤ 1.00 Very high
47
e. Recapitulation of Students’ Cognitive Outcomes Instrument
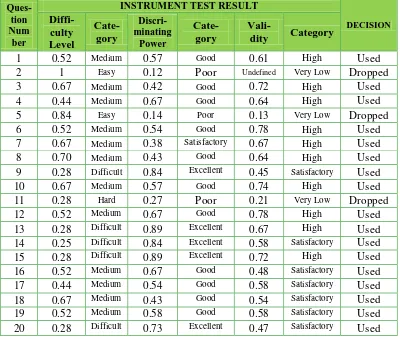
Objective test for measuring students’ cognitive learning outcomes in form of 30 questions has to be tested in terms of difficulty level, discriminating power, validity and reliability that are given to 25 students grade IX who already gained the material of Light and Optics before. Decision based on test requirement result can be used, dropped, or revised with experts related with the probability of particular question item to be used. The recapitulation of objective test as well as specification for each question item is represented on following table and Appendix C.3 for more distinct result.
Test item recapitulation :
Reliability test : 0. 81 (Very High)
Table 3.5 Recapitulation of Test Item for Students’ Cognitive Outcomes
Ques-9 0.28 Difficult 0.84 Excellent 0.45 Satisfactory Used
10 0.67 Medium 0.57 Good 0.74 High Used
11 0.28 Hard 0.27 Poor 0.21 Very Low Dropped
12 0.52 Medium 0.67 Good 0.78 High Used
13 0.28 Difficult 0.89 Excellent 0.67 High Used
14 0.25 Difficult 0.84 Excellent 0.58 Satisfactory Used
15 0.28 Difficult 0.89 Excellent 0.72 High Used
16 0.52 Medium 0.67 Good 0.48 Satisfactory Used
17 0.44 Medium 0.54 Good 0.58 Satisfactory Used
18 0.67 Medium 0.43 Good 0.54 Satisfactory Used
19 0.52 Medium 0.58 Good 0.58 Satisfactory Used
48
21 0.52 Medium 0.48 Good 0.78 High Used
22 0.67 Medium 0.77 Excellent 0.54 Satisfactory Used
23 0.28 Difficult 0.74 Excellent 0.67 High Used
24 0.44 Medium 0.48 Good 0.42 Satisfactory Used
25 0.81 Easy 0.10 Poor 0.13 Very Low Dropped
26 0.77 Easy 0.12 Poor 0.19 Very Low Dropped
27 0.44 Medium 0.57 Good 0.78 High Used
28 0.52 Medium 0.57 Good 0.53 Satisfactory Used
29 0.67 Medium 0.71 Excellent 0.67 High Used
30 0.52 Medium 0.87 Excellent 0.75 High Used
2. Instrument Non-Test Requirements
a. Rubrics
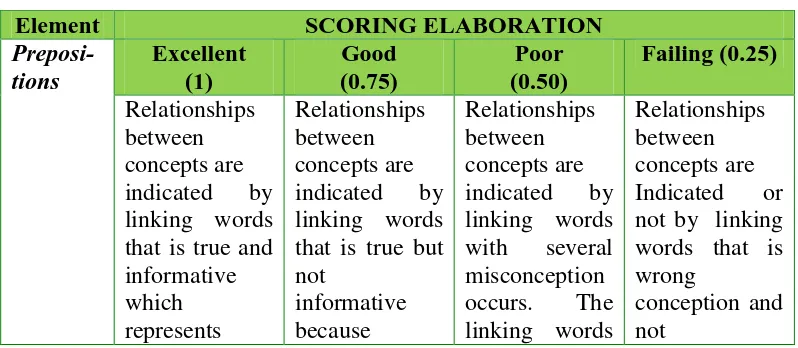
Concept map scoring and concept map structure are two main rubrics that are applied in this research. Concept map scoring rubric is designed based on Novak and Gowin (1984) that covers four main elements such as preposition, hierarchical level, cross link and example that aims to analyse significance of conceptual change that is obtained from preliminary and post concept map construction. Concept map structure is adapted based on Kinchin and Hay (2000) that concern on the pattern of concept map into spoke, chain or net that represents the conceptual changing. Concept map scoring rubric is elaborated by the researcher and revised based on related experts’ recommendation that utilizes scale to calculate students’ concept map score compared to expert concept map.
b. Questionnaire
49
F. Data Collection Technique
Qualitative and quantitative data that is obtained in this research requires different collection technique as well as scoring method. Qualitative data is obtained from preliminary and post concept map construction that empathizes on conceptual change based on significance changing of students’ concept map scoring as well as concept map structure. Meanwhile quantitative data concern on cognitive learning outcomes emphasizes on changing in each cognitive level that is obtained from pretest and posttest. Data collection techniques are explained a follow:
1. Data of Students’ Conceptual Change based on Concept Map Scoring
Students’ conceptual change that is obtained from preliminary and post concept map construction is assessed by Concept map scoring rubric. Scoring based on Novak and Gowin (1984) such valid preposition is one, hierarchical structure is five, cross link is ten, and specific example is one for each meaningful mapping is used as maximum score. Each element is elaborated into four different criteria such as excellent-good-poor-and failing that aims to differentiate each student’s concept map quality after whole preliminary and post concept map is collected. Scoring will be divided by four in order to indicate each indicator that represents different characteristics under discussion with experts.
Table 3.6 Concept Map Scoring Rubric
51
2. Data of Students’ Conceptual Change based on Concept Map Structure
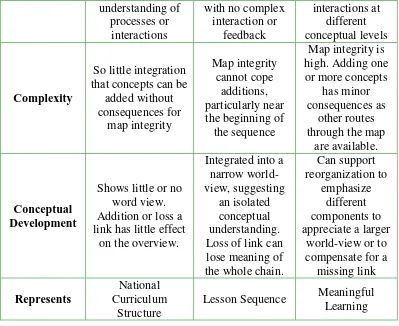
Significance changing of concept map structure that is obtained from preliminary and post concept map structure represents well restructure of ideas that illustrate how students change their conception. Qualitative approach that aims to investigate concept map pattern for analyzing conceptual change is developed by Kinchin and Hay (2000: 48). They classified concept map structure into spoke, chain and net as seen on Figure 2.2.a, 2.2.b, and 2.2.c that emphasizes on hierarchy level, processes, complexity, conceptual development and representation as seen on Table 3.7 as follow:
Table 3.7 Concept Map Structure Rubric
Aspect Map Type
52
Lesson Sequence Meaningful Learning
3. Data of Students’ Cognitive Learning Outcomes
Students’ cognitive learning outcomes in each cognitive level are obtained two times based on pretest and posttest. Test is carried out with the form of multiple choices using 25 test items under the topic of Light and Optics. Objective test is formulated based on factual and conceptual knowledge in the form of multiple choices using four options with the cognitive dimension as C1 (remembering), C2 (Understanding), C3 (Applying), and C4 (Analyzing). The blueprint of the objective test is shown based on table 3.8 below represents proportion for each cognitive level.
Table 3.8 Blueprint of Objective Questions
No Subtopic
Correlate the properties of
53 diffusion reflection on the rough surface using diagram.
3 Interpret concept of Law of
Reflection and image formation in plane mirror
4,5 Apply geometrical optic
formula in curved mirror 11,12
Analyze nature of image
mediums with different density based on Snell’s Law
8 Analyse the form of
refraction using ray diagram based on refraction index
9 Apply geometrical optic
formula in lenses
18,19, 21,22 Analyse nature of image
formation in lenses 20,23
Exemplify the principle of
54
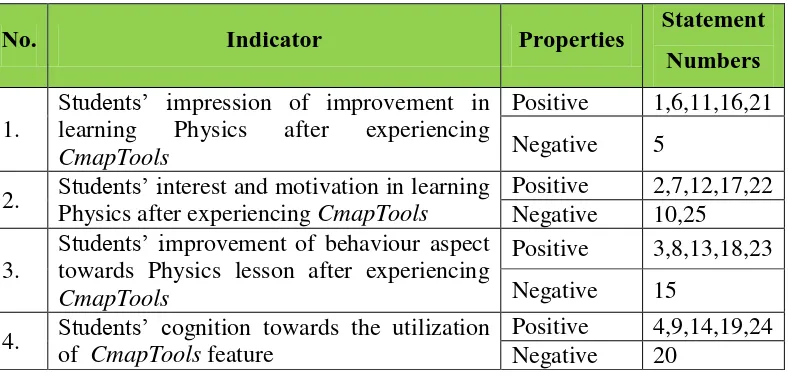
lesson, (3) improvement of behavior aspect towards Physics lesson, and (4) cognition towards the benefits of CmapTools feature. There are 25 statements with the inclusion of 5 questions that states negative statement in order to control students’ answer. This attitude scale uses Likert with four points of type scale (absolutely agree, agree, do not agree, absolutely do not agree) based on Measurement of Successive Interval (MSI) computation. Type of scale which states do not agree is prevented in order to make the clarity of student’s response after experiencing CmapTools. Scoring of positive statement is given point 5 until 1 orderly from strongly agree until strongly disagree criteria; whereas scoring of negative statement is vice versa. The blueprint is represented based on Table 3.9 as follow:
Table 3.9 Blueprint of Students’ Response Questionnaire
No. Indicator Properties Statement
Numbers
1. Students’ i
mpression of improvement in learning Physics after experiencing CmapTools
Positive 1,6,11,16,21 Negative 5
2. Students’ iPhysics after experiencing nterest and motivation in learning CmapTools
Positive 2,7,12,17,22 Negative 10,25 3. Students’ i
mprovement of behaviour aspect towards Physics lesson after experiencing CmapTools
G. Data Processing and Analysis
55
………….. (3.6) 1. Data Processing of Students’ Conceptual Change
Students’ concept map that is obtained twice in preliminary and post implementation in order to illustrate significance of conceptual change will be assessed based on concept map scoring rubric (Table 3.6). Expert concept map that is already developed by researcher together with Physics expert is used as maximum score. Concept map scoring is represented as follow including the score interpretation on Table 3.10.
……. (3.5)
Table 3.10 Concept Map Scoring Interpretation
No. Score Criteria
1. 81% - 100% Very High
2. 61% - 80% High
3. 41% - 60% Medium
4. 21% - 40% Low
5. 0% - 20% Very Low
(Syah, 1999 in Sairan, 2008:40)
2. Data Processing of Students’ Cognitive Learning Outcomes
Objective test that consists of 25 multiple questions based on arrngemet of cognitive level from C1 (remember) until C4 (analysing) will be assessed based on scoring. For each correct answer will be given score 1 whereas wrong answer will be given score 0. Scores then will be converted into 0-100 scale value.The score conversion in form percentage (%) represents based on this equation:
Table 3.11Category Scale of Students’ Score
Score Category
S ≤ 40 Very poor
41 ≤ S ≤ 55 Poor
Student’s score (%) =
� � ℎ �
56
56 ≤ S ≤ 65 Satisfactory
66 ≤ S ≤ 80 Good
81 ≤ S ≤ 100 Excellent
(Arikunto 2013: 281)\
Gain score (actual gain) was obtained from the difference of pre-test score and post-test score. The difference in pre-test scores and the post-test is assumed as the effect of the intervention. Normalized gain calculations are intended to determine the categories of students’ achievement improvement. According to Hake (1999) normalized gain is calculated by using this following formula:
(Hake, 1999) Where :
G = Gain
= Post-test score = Pre-test score
The improvement of cognitive learning outcomes in learning Light and Optics after utilizing CmapTools for constructing concept maps will be seen from the result of the normalized gain that achieved by students. For the calculation of the normalized gain value and its classification will use equations as follows:
Where:
<g> = Normalized gain
G = Actual gain
G max = Maximum gain possible Sf = Post-test score
Si = Pre-test score
(Hake, 1999)
< �> �
����
� �� ��
………….. (3.7)
57
The value of <g> is determined based on criteria below on the table below:
Table 3.12 Criteria of N Gain Improvement N-Gain <g> Improvement Criteria
0,00 – 0,29 Low
0,30 – 0,69 Medium
0,70 – 1,00 High
(Hake, 1999)
3. Data Processing of Students’ Response towards CmapTools Utilization
Qualitative analysis of students’ response is carried out in order to analyze students’ interest, motivation, impression and cognition towards the implementation of using CmapTools in constructing concept map. Processing is executed by calculating Likert scale into score then percentage conversion. The formula of converting score into percentage is seen below followed by scoring guideline of Likert scale that is represented on Table 3.13 as follow:
Score =
x 100%
(Arikunto, 2013: 262) Table 3.13 Scoring Guideline of Students’ Response
Strongly
Disagree Disagree Not sure Agree
Strongly Agree
Negative Statement 5 4 3 2 1
Positive Statement 1 2 3 4 5
(Sugiyono, 2008: 203)
The interpretation of score percentage is categorized into certain criteria according to Arikunto (2013) is represented as follows.
Tabel 3.14 Percentage Interpretation of Questionnaire
Percentage (%) Criteria
0% None
0 %- 25% A few of criteria
26%-40% Almost half of
58
41%-50% Half of
51% - 75% Mostly
76% - 99% Generally
100% All of them
(Arikunto, 2013: 263)
4. Data Analysis and Hypothesis Test
a. Normality Test
Parametric statistic is implemented in this research since it aims to measure the parameter of particular sample that has normal distribution. If the distribution is free, non-parametric statistic is used. Parametric statistic is more valid and powerful compared to non-parametric related with interval and ratio data; if the assumptions are reasonably met (Phopan, 1973 in Sugiyono, 2008: 211). Normality test is executed in order to analyze whether samples comes from population that has normal distribution or not. SPSS version 17.0 is used as supporting software to determine normality test for each pretest and posttest based on Kolmogorov-Smirnov. Data is considered as normal distribution if the criterion is higher than assumption of significance in two-tailed.
b. Hypothesis Test
59
Table 3.15 Interpretation of Correlation Coefficient Correlation coefficient (rxy) Interpretation
0,0 – 0,19 Very low
0,20 – 0,39 Low
0,40 – 0,59 Medium
0,60 – 0,79 Strong
0,80 – 1,00 Very strong
(Sugiyono, 2008: 257)
Determination coefficient can be calculated in order to determine the regression equation as represented by the equation as follow:
Where:
R = Determination coefficient r = Correlation coefficient
(Sugiyono, 2008: 259)
Regression analysis aims to obtain the equation that is used to investigate the prediction of high or low dependent variable value (Y) if the independent variable is being modified or manipulated (Sugiyono, 2008: 261). The equation is represented as follow:
Where:
Y = Value that will be predicted a = Constanta or if the X value is zero b = Regression coefficient
X = Value of independent variable
(Sugiyono, 2008: 259) ……….. (4.0)
60
H. Research Procedure
This research is carried out into three stages; preparation, implementation and final stage under conceptual change teaching model according to Driver and Oldham. The stage description will be explained as follows:
1. Preparation stage
In the planning stages consists of preliminary study, literature study, and design the research instrument.
a. Preliminary Study
Preliminary study aims to identify the problem in real Physics classroom environmental system. It is useful to find out obstacles which students faced, so questionnaires have to be distributed. A questionnaire consists of ten questions is given to each student one week before entering the lesson stage. Teacher also are being interviewed about several problems that she faced during teach physics. By analyzing the results of both questionnaires and teacher’s interview, research problem can be formulated.
b. Literature Review
61
c. Research Instrument Design
Research instrument is designed as quantitative and qualitative instrument into test and non-test. Non-test instrument such as concept map scoring rubric under Novak and Gowin’s criteria; preposition, hierarchical level, cross links and examples is developed by researcher together with the related experts as well as adoption of concept map structure rubric based on Kinchin. Researcher also has to developed expert concept map as maximum score to assess students’ concept map based on recommendation of lecturer and supervisors. Questionnaire is developed using Likert scale under four indicators such as (1) impression of improvement in learning Physics, (2) interest and motivation towards Physics lesson, (3) improvement of behavior aspect towards Physics lesson, and (4) cognition towards the benefits of CmapTools feature. Test instrument emphasizes on objective tests that has to be judged first based on discriminator power, level of difficulty, reliability, and validity using Ms. Excel computation before distributing the questions to the treatment group. Researcher also has to concern with the role of CmapTools to utilize students in constructing concept map during Light and Optics so several features has to be optimized first.
2. Implementation Stage
Research implementation is explained as follow:
a. Experimental class determination based on purposive sampling. b. Pretest implementation in order to describe students’ prior conception. c. Processing pretest result.
d. Conduct research activity by implementing conceptual change teaching model based on Driver and Oldham (1986 in Lin et. al., 2010) under following scenarios:
62
students report their prior knowledge in order to investigate their prior conception through preliminary concept map construction by answering how light behaves, how light is reflected and refracted as focus question using conventional method or handwriting. Concept Text is used as assistant to helps students elaborate their prior conception. Before constructing preliminary mapping, concept map introduction based on Novak’s criteria into preposition, hierarchical level, cross links, and examples. Preliminary discussion together with students is conducted first to make them realize the differences between concept map and mind map that is usually made. This session also concerns how to construct concept map by classifying and organizing general to specific concepts including linking words formulation to connect each concept node.
2) Second meeting emphasizes on restructure of ideas that is elaborated into first sequence of clarification and exchange based on small group discussion in order to examine and criticize of others’ prior conception related with focus question that is proposed by teacher; “How you can see the twinkling of stars in the night which is really bright? How the light can propagate to your eyes though the hole of roof in your house? How is the image that you see if you use the inner part of spoon and the outer part of spoon? How come a pencil can be bent inside a glass of
63
reflection principle including specular and diffuse reflection in order to make students investigate whether the value of angle formation between incident and reflected ray is same or not using laser, plane mirror, rough aluminum, and arc. Experiment also focus on Snell’s law of
refraction by using laser and two baker glasses that is empty and filled with water. Students have to determine the path of refraction in different medium
density.
3) Third meeting still emphasizes on restructure of ideas phase that is elaborated into sequence of construction of new ideas and evaluation. Students are guided how to draw ray tracing diagram based on light reflection and refraction through teacher demonstration using laser, curved mirror and lenses. Students also are guided how to determine image distance, height and magnification by applying geometrical optic formula as well as nature of image formation analysis based on ray tracing diagram. Evaluation focus to solve problems under small group discussion.
64
e. Posttest implementation to analyze gain in each cognitive level.
f. Questionnaire distribution to investigate students’ response towards CmapTools utilization.
3. Final Stage
65
I. Research Scheme
Preliminary study
(giving questionnaire to students and interviewing Physics teacher)
Literature study of conceptual change, concept map, CmapTools utilization, cognitive learning outcomes
(Cognitive test, Cmap Scoring Rubric, Unstructured Questionnaire, Expert Cmap)
Instrument validation
Test of discrimination power, difficulty level, reliability and validity of cognitive test, validity of expert concept map, judgement of scoring rubric and unstructured questionnaire
Preliminary Concept Map
Implementation of conceptual change teaching model by utilizing CmapTools
Students’ response
Data Processing and Analysis
Result and Conclusion
128
Muhammad Rifqi Rofiuddin, 2014
CHAPTER V
CONCLUSION AND RECOMMENDATION
A. Conclusion
Research of CmapTools utilization under five stage conceptual change teaching model that is adopted from Driver & Odham (1986 in Lin et. al., 2010) has been conducted systematically, based on the research result it is acquired some conclusions as follows:
1. Secondary students’ conceptual change that is analyzed based on
comparison of preliminary and post concept map construction shows significance of 50.92 % differences that is elaborated into concept map element based on Novak and Gowin criteria such as prepositions and hierarchical level in high category, cross links in medium category and example in low category.
2. Secondary students’ cognitive learning outcomes after experiencing
CmapTools utilization shows high category improvement based on normalized gain <g> as 0.86 that under four leveled of cognitive taxonomy; from C1 until C4.
3. The implementation of five-stage conceptual change model by utilizing CmapTools as prototyped media in helping students to construct concept map is capable to improve secondary students’ cognitive learning outcomes based on statistical calculation result that indicates strong correlation as value of correlation coefficient (rxy) is 0.78.
4. Secondary students’ response towards CmapTools utilization is
129
Muhammad Rifqi Rofiuddin, 2014 B. Recommendation
Based on the findings of the research that has been conducted and concluded, there are several recommendations that necessary to be conveyed by the researchers as follow:
1. It is recommended for the other researcher to make a research about mapping conceptual change by utilizing CmapTools to analyze cognitive learning outcomes in others topics with higher level of cognitive level at evaluating (C5) and creating (C6) aspect by integrating it into project based learning.
2. Time allocation should be well-arranged in developing the conceptual teaching model so that efficient time with better result can be obtained. 3. Before designing or adapting a learning model, teacher should be able to
adapt with new characteristics of students based on their learning style.
4. Teacher has to concern with every students’ need in conducting treatment
therefore they will be not feel being pressured and learning atmosphere can be more enjoyable.
5. In conducting introduction of concept map that describes its elements such as propositions, hierarchical levels, cross links and examples, it is highly recommended to directly train students how to build concept map by using concept bank in order to stimulate students to classify and organize their prior conception. Concept bank can be made by using small papers that attached on the whiteboard.
6. For the researchers, it is suggested to build good communication with related subject teacher at school in order to overcome and minimize obstacles such as providing equipment for experiment and demonstration using local resources materials if school does not provide it.
130
REFERENCES
Anderson, L.W and Karthwohl, D. R. (2001). A Taxonomy for Learning,
Teaching and Assessing: A Revision of Bloom’s Taxonomy of Educational
Objectives. Addison Wesley Longmam.Inc
Arikunto, S. (2013). Dasar-Dasar Evaluasi Pendidikan. Bandung: Bumi Aksara Ausubel, D. P. (2000). The acquisition and retention of knowledge. Dordrecht:
Kluwer.
Aydin, G. & Balim A., G. (2011). The Activities based on Conceptual Change Strategies Prepared by Science Teacher Candidates. Western Anatolia Journal of Educational Sciences (WAJES), Dokuz Eylul University Institute, Izmir, Turkey ISSN 1308-8971.
Basso, S. & Margarita S. (2004). Teaching By Doing with Concept Maps: Integrating Plone And Cmaptools, Liases. Department of Statistics and Applied Mathematics: University of Torino, Italy.
Broggy, J., & McClelland, G. (2008). Undergraduate Students’ Attitudes Towards Physics After A Concept Mapping Experience. Proceeding of the Third Int. Conference on Concept Mapping, Tallinn, Estonia & Helsinki, Finland.
Cañas, A. J., Carff, R., Hill, G., Carvalho, M., Arguedas, M., Eskridge, T., et al. (2005). Concept maps: Integrating knowledge and information visualization. In S.-O. Tergan & T. Keller (Eds.), Knowledge and information visualization: Searching for synergies (pp. 205-219). Heidelberg/NY: Springer Lecture Notes in Computer Science.
Cañas, A. J., Hill, G., & Lott, J. (2003). Support for constructing knowledge models in CmapTools (Technical Report No. IHMC CmapTools 2003-02). Pensacola, FL: Institute for Human and Machine Cognition. [Online]. Available:
http://cmap.ihmc.us/Publications/WhitePapers/SupportforConstructingKno wledgeModelsonCmapTools.pdf [17th June 2014]
Candan, A. (2006). The effect of concept mapping on primary school students’ understanding of the concepts of the force and motion. Journal of Turkish Science Education, 3(1): 66-75.
131
Carvalho, M., Hewett, R. & Cañas, A. J. (2001). Enhancing Web Searches from Concept Map-based Knowledge Models, SCI 2001: Fifth Multi-Conference on Systems, Cybernetics and Informatics, Orlando, FL.
Chiu, M.H. (2000). Reflections and Implications of Research on Conceptual Change. Chinese Journal of Science Education Vol.8, No.1, 1-34.
Ciomoş, F. (2010), Students’ perception on learning science. Anuarul Institututîlui
de pregătire didactică.
Creswell, J. W. (2012). Educational Research Planning, Conducting, and Evaluating Quantitative and Qualitative Research. Boston: Edward Brothers, Inc.
Cutnell, J. (2007). General Physics 7th Edition. Wiley International Publish Dahar , Ratna Wilis. (2011). Teori-teori Belajar dan Pembelajaran. Bandung : PT
Gelora Aksara Pratama Erlangga
Esen, U. & Ömer, G. Effect of conceptual change approach accompanied with concept mapping on understanding of solution concepts. Instructional Science, 2005 p: 311–339.
Granados, A., J. D. Pérez & C. Pérez, Canas, A. J. (2003). The network architecture of CmapTools, Technical Report IHMC CmapTools 93-02, Institute for Human and Machine Cognition.
Gunstone, Richard F., (2002). Constructivist Learning and the Teaching of Science. Faculty of Science Education, Monash University.
Hill, G., Cañas, A. J., Carff, R. & Suri, N. (2003). CmapTools: A knowledge modeling and sharing toolkit, Technical Report IHMC CmapTools 93-01, Institute for Human and Machine Cognition
Karakuyu, Y. (2010). The Effect of Concept Mapping on Attitude and Achievement in A Physics Course. International Journal of the Physical Sciences Vol. 5(6), pp. 724-737, June 2010
Kern, C. & Crippen, K., J. (2008) Mapping for Conceptual Change; Concept Mapping Activities Encourage Students to Develop Scientific Understanding. University of Nevada, Las Vegas.
Kinchin I., M. & Hay D., B (2000) How a qualitative approach to concept map analysis can be used to aid learning by illustrating patterns of conceptual development. University of Surrey, Guildford.