ABSTRAK
Saat ini kota Bandung merupakan salah satu kota yang memiliki beberapa fakultas terkemuka yang menawarkan beragam pilihan fakultas dan jurusan, salah satunya adalah Universitas Kristen Maranatha (UKM), dengan banyaknya perguruan tinggi tersebut membuat anak-anak SMA memiliki kesempatan untuk memilih universitas yang sesuai dengan minatnya.
Setelah melakukan penelitan pendahuluan, terdapat hal yang menjadi perhatian, yaitu terjadinya penurunan jumlah siswa yang masuk ke Universitas Kristen Maranatha (UKM) tiap tahunnya. Karena hal itu dilakukan penelitian mengenai faktor yang dipentingkan seorang siswa dalam memilih perguruan tinggi dan kepuasan terhadap promosi yang telah dilakukan pihak Universitas Kristen Maranatha (UKM), dengan cara penyebaran kuesioner yang terdiri atas 3 bagian. Kuesioner dibagikan kepada siswa SMA BPK 1, 2, 3, dan Aloysius 1, 2 yang melakukan Ujian Saringan Masuk (USM) pada tanggal 16 Desember 2007 dan 28 Januari 2008. Untuk kemudian diolah dan dianalisa faktor apa yang dipentingkan oleh seorang anak SMA dalam memilih sebuah universitas dan bagaimana kepuasan siswa SMA terhadap promosi yang telah dilakukan Universitas Kristen Maranatha (UKM).
Dari hasil penyebaran kuesioner yang tediri dari 3 bagian, bagian pertama adalah profil responden yang dijelaskan dalam pie chart, bagian kedua adalah hal-hal yang dipentingkan mengenai perguruan tinggi yang diolah dengan menggunakan analisis klaster, bagian ketiga adalah respon terhadap promosi yang diolah dengan menggunakan metode regresi.
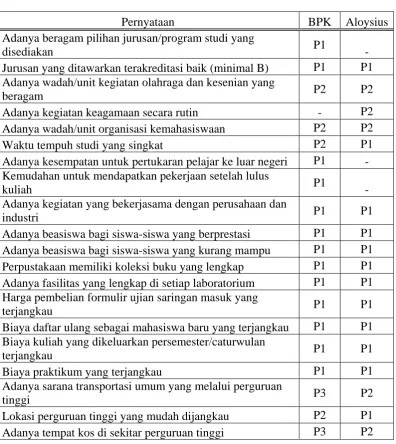
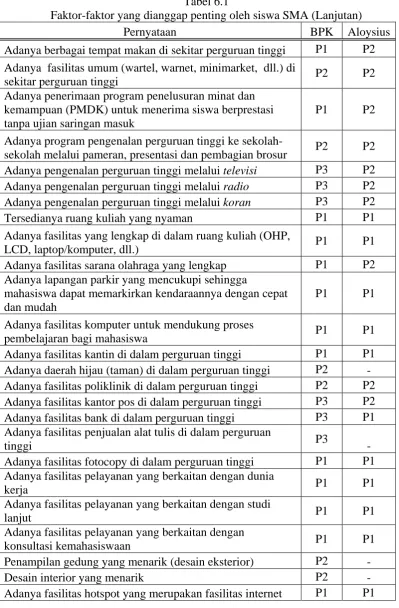
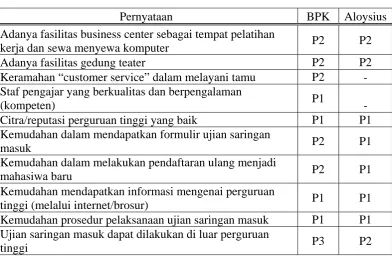
Hasil analisis menunjukkan bahwa terdapat 2 variabel yang dianggap penting tetapi belum dipenuhi UKM, yaitu variabel beasiswa bagi siswa berprestasi dan tersedianya fasilitas penjualan alat tulis di dalam perguruan tinggi dan beberapa faktor yang dianggap penting oleh siswa, seperti adanya berbagai tempat makan di sekitar perguruan tinggi; adanya fasilitas umum (wartel, warnet, minimarket, dll.) di sekitar perguruan tinggi; adanya penerimaan program penelusuran minat dan kemampuan (PMDK) untuk menerima siswa berprestasi tanpa ujian saringan masuk, faktor yang mempengaruhi siswa SMA memilih UKM dikarenakan adanya jurusan yang diminati, kepuasan terhadap promosi yang telah dilakukan oleh pihak UKM saat ini dirasakan kurang.
DAFTAR ISI
Abstrak iv
Kata Pengantar dan Ucapan Terima Kasih v
Daftar Isi viii
Daftar Tabel xii
Daftar Gambar xvi
Daftar Lampiran xix
BAB 1 PENDAHULUAN
1.1 Latar Belakang Masalah... 1-1
1.2 Identifikasi Masalah ... 1-2
1.3 Batasan dan Asumsi ... 1-2
1.4 Perumusan Masalah ... 1-2
1.5 Tujuan Penelitian ... 1-3
1.6 Sistematika Penulisan ... 1-3
BAB 2 TINJAUAN PUSTAKA
2.1 Riset/penelitian... 2-1
2.2 Jasa ...2-1
2.2.1 Pengertian Jasa... 2-1
2.2.2 Konsep dan Pengertian Jasa... 2-2
2.2.3 Klasifikasi Jasa ... 2-2
2.2.4 Karakteristik Jasa... 2-5
2.3 Bauran Pemasaran... 2-6
2.4 Teknik pengumpulan data ... 2-9
2.5 Populasi dan Sampel ... 2-10
2.6 Teknik Sampling ... 2-10
2.7.1 Macam-macam Skala Pengukuran... 2-12
2.7.2 Tipe Skala Pengukuran ... 2-13
2.8 Validitas dan Reliabilitas Instrumen ... 2-14
2.8.1 Pengujian Validitas Instrumen... 2-15
2.8.2 Pengujian Reliabilitas Instrumen ... 2-16
2.9 Analisis Klaster ... 2-18
2.9.1 Pembagian Analisis Kluster ... 2-18
2.9.2 Langkah-langkah analisis klaster... 2-18
2.10 Regresi Linear ... 2-19
2.10.1 Regresi Linear Berganda (Multiple Linear Regretion)... 2-19
2.10.2 Asumsi Klasik dalam Regresi... 2-20
BAB 3 METODOLOGI PENELITIAN
3.1 Studi Pendahuluan... 3-5
3.2 Identifikasi Masalah ... 3-5
3.3 Tinjauan Pustaka ... 3-5
3.4 Pembatasan Masalah dan Asumsi ... 3-5
3.5 Perumusan Masalah ... 3-6
3.6 Tujuan Penelitian ... 3-6
3.7 Identifikasi Variabel Penelitian... 3-7
3.8 Penyusunan Kuesioner ... 3-9
3.9 Pengujian Validitas Konstruk ... 3-9
3.10 Pengumpulan Data ... 3-9
3.11 Pengujian Validitas dan Reliabilitas ... 3-10
3.12 Pengolahan Data ... 3-11
3.13 Analisis... 3-12
3.14 Usulan perbaikan... 3-12
3.15 Kesimpulan dan Saran ... 3-12
4.1 Data Umum Perusahaan... 4-1
4.2 Struktur Organisasi ... 4-3
4.3 Pengumpulan Data Awal ... 4-4
4.4 Teknik Sampel ... 4-6
4.5 Skala Pengukuran... 4-6
4.6 Pengumpulan Data ... 4-7
BAB 5 PENGOLAHAN DATA DAN ANALISIS
5.1 Profil Responden (Bagian I) ... 5-1
5.1.1 BPK... 5-1
5.1.2 Aloysius ... 5-11
5.2 Hal-hal yang dipentingkan mengenai perguruan tinggi (Bagian II) ... 5-21
5.2.1 Pengujian Validitas ... 5-21
5.2.1.1 BPK ... 5-22
5.2.1.2 Aloysius ... 5-24
5.2.2 Pengujian Reliabilitas ... 5-25
5.2.2.1 BPK ... 5-25
5.2.2.2 Aloysius ... 5-26
5.2.3 Analisis Klaster... 5-26
5.2.3.1 BPK ... 5-26
5.2.3.2 Aloysius ... 5-43
5.2.4 Koefisien Keragaman ... 5-59
5.2.4.1 BPK ... 5-60
5.2.4.2 Aloysius ... 5-64
5.3 Respon Terhadap Promosi (Bagian III) ... 5-68
5.3.1 Pengujian Validitas ... 5-68
5.3.1.1 BPK ... 5-68
5.3.1.2 Aloysius ... 5-69
5.3.2 Pengujian Reliabilitas ... 5-70
5.3.2.2 Aloysius ... 5-71
5.3.3 Regresi ... 5-71
5.3.3.1 BPK ... 5-71
5.3.3.2 Aloysius ... 5-74
5.3.4 Pengujian Model ... 5-76
5.3.4.1 BPK ... 5-77
5.3.4.1.1 Uji Linearitas ... 5-77
5.3.4.1.2 Uji Nonmultikolinearitas ... 5-77
5.3.4.2 Aloysius ... 5-78
5.3.4.2.1 Uji Linearitas ... 5-78
5.3.4.2.2 Uji Nonmultikolinearitas ... 5-78
5.3.5 Analisis kepuasan terhadap respon promosi ... 5-79
5.3.5.1 BPK ... 5-79
5.3.5.2 Aloysius ... 5-94
5.3.6 Koefisien Keragaman ... 5-107
5.3.6.1 BPK ... 5-108
5.3.6.2 Aloysius ... 5-109
5.3.7 Usulan Strategi Pemasaran ... 5-116
5.3.7.1 Produk... 5-116
5.3.7.2 Price ... 5-116
5.3.7.3 Place... 5-117
5.3.7.4 Promotion ... 5-117
5.3.7.5 Physical Evidence... 5-117
5.3.7.6 People ... 5-117
5.3.7.7 Process ... 5-118
BAB 6 KESIMPULAN DAN SARAN
6.1 Kesimpulan ... 6-1
6.2 Saran...6-7
6.2.2 Saran untuk penelitian lebih lanjut ... 6-8
Daftar Pustaka
DAFTAR GAMBAR
Gambar Judul Halaman
Gambar 2.1 Teknik Sampling 2-10
Gambar 2.2 Langkah-langkah analisis klaster 2-18
Gambar 3.1 Bagan Sistematika Metodologi Penelitian 3-1
Gambar 4.1 Struktur Organisasi UKM 4-3
Gambar 5.1 Pie chart pekerjaan orang tua siswa BPK 5-1
Gambar 5.2 Pie chart penghasilan orang tua siswa BPK 5-2
Gambar 5.3 Histogram asal SMA siswa BPK 5-3
Gambar 5.4 Histogram jurusan program studi yang
diminati siswa BPK 5-5
Gambar 5.5 Histogram perguruan tinggi selain UKM
yang diminati siswa BPK 5-6
Gambar 5.6 Pie chart alasan memilih perguruan tinggi
selain UKM oleh siswa BPK 5-7
Gambar 5.7 Pie chart informasi mengenai UKM
yang didapat siswa BPK 5-9
Gambar 5.8 Pie chart alasan memilih UKM oleh siswa BPK 5-10
Gambar 5.9 Pie chart pekerjaan orang tua siswa Aloysius 5-12
Gambar 5.10 Pie chart penghasilan orang tua siswa Aloysius 5-13
Gambar 5.11 Pie chart asal SMA siswa Aloysius 5-14
Gambar 5.12 Pie chart jurusan program studi
yang diminati siswa Aloysius 5-16
Gambar 5.13 Pie chart perguruan tinggi selain UKM
yang diminati siswa Aloysius 5-17
Gambar 5.14 Pie chart alasan memilih perguruan tinggi
selain UKM oleh siswa Aloysius 5-18
yang didapat siswa Aloysius 5-19
Gambar 5.16 Pie chart alasan memilih UKM oleh siswa Aloysius 5-20
Gambar 5.17 Grafik F tabel untuk BPK 5-30
Gambar 5.18 Grafik F tabel untuk Aloysius 5-46
Gambar 5.19 Grafik uji T untuk BPK 5-73
Gambar 5.20 Grafik uji T untuk Aloysius 5-75
Gambar 5.21 Grafik uji linearitas untuk BPK 5-77
Gambar 5.22 Grafik uji linearitas untuk Aloysius 5-78
Gambar 5.23 Grafik Pembobotan variabel X1 untuk BPK 5-80
Gambar 5.24 Grafik Pembobotan variabel X2 untuk BPK 5-81
Gambar 5.25 Grafik Pembobotan variabel X3 untuk BPK 5-82
Gambar 5.26 Grafik Pembobotan variabel X4 untuk BPK 5-83
Gambar 5.27 Grafik Pembobotan variabel X5 untuk BPK 5-84
Gambar 5.28 Grafik Pembobotan variabel X6 untuk BPK 5-85
Gambar 5.29 Grafik Pembobotan variabel X7 untuk BPK 5-86
Gambar 5.30 Grafik Pembobotan variabel X8 untuk BPK 5-87
Gambar 5.31 Grafik Pembobotan variabel X9 untuk BPK 5-88
Gambar 5.32 Grafik Pembobotan variabel X10 untuk BPK 5-89
Gambar 5.33 Grafik Pembobotan variabel X11 untuk BPK 5-91
Gambar 5.34 Grafik Pembobotan variabel X12 untuk BPK 5-92
Gambar 5.35 Grafik Pembobotan variabel Y untuk BPK 5-93
Gambar 5.36 Grafik Pembobotan variabel X1 untuk Aloysius 5-95
Gambar 5.37 Grafik Pembobotan variabel X2 untuk Aloysius 5-96
Gambar 5.38 Grafik Pembobotan variabel X3 untuk Aloysius 5-97
Gambar 5.39 Grafik Pembobotan variabel X4 untuk Aloysius 5-98
Gambar 5.40 Grafik Pembobotan variabel X5 untuk Aloysius 5-99
Gambar 5.41 Grafik Pembobotan variabel X6 untuk Aloysius 5-100
Gambar 5.42 Grafik Pembobotan variabel X7 untuk Aloysius 5-101
Gambar 5.43 Grafik Pembobotan variabel X8 untuk Aloysius 5-102
Gambar 5.45 Grafik Pembobotan variabel X11 untuk Aloysius 5-104
Gambar 5.46 Grafik Pembobotan variabel X12 untuk Aloysius 5-105
DAFTAR TABEL
Tabel Judul Halaman
Tabel 5.1 Pekerjaan orang tua siswa BPK 5-1
Tabel 5.2 Penghasilan orang tua siswa BPK 5-2
Tabel 5.3 Asal SMA siswa BPK 5-3
Tabel 5.4 Jurusan program studi yang diminati siswa BPK 5-4
Tabel 5.5 Perguruan tinggi selain UKM yang
diminati siswa BPK 5-5
Tabel 5.6 Alasan memilih perguruan tinggi selain UKM
oleh siswa BPK 5-7
Tabel 5.7 Informasi mengenai UKM yang
didapat siswa BPK 5-8
Tabel 5.8 Alasan memilih UKM oleh siswa BPK 5-10
Tabel 5.9 Pekerjaan orang tua siswa Aloysius 5-11
Tabel 5.10 Penghasilan orang tua siswa Aloysius 5-12
Tabel 5.11 Asal SMA siswa Aloysius 5-13
Tabel 5.12 Jurusan program studi yang
diminati siswa Aloysius 5-14
Tabel 5.13 Perguruan tinggi selain UKM
yang diminati siswa Aloysius 5-16
Tabel 5.14 Alasan memilih perguruan tinggi selain UKM
oleh siswa Aloysius 5-17
Tabel 5.15 Informasi mengenai UKM yang
didapat siswa Aloysius 5-19
Tabel 5.16 Alasan memilih UKM oleh siswa Aloysius 5-20
Tabel 5.17 Rekapitulasi uji validitas kepentingan BPK 5-22
Tabel 5.18 Rekapitulasi uji validitas kepentingan Aloysius 5-24
Tabel 5.20 Rekapitulasi uji reliabilitas kepentingan Aloysius 5-26
Tabel 5.21 Rekapitulasi perhitungan jumlah responden
tiap kluster untuk BPK 5-26
Tabel 5.22 Rekapitulasi final kluster untuk BPK 5-27
Tabel 5.23 Hasil uji ANOVA untuk BPK 5-29
Tabel 5.24 Prioritas kepentingan untuk BPK 5-31
Tabel 5.25 Jurusan/Program studi yang
disediakan UKM untuk BPK 5-34
Tabel 5.26 Akreditasi jurusan/Program studi UKM
untuk BPK 5-36
Tabel 5.27 Wadah/unit kegiatan olahraga dan kesenian
untuk BPK 5-41
Tabel 5.28 Rekapitulasi perhitungan jumlah responden
tiap kluster untuk Aloysius 5-43
Tabel 5.29 Rekapitulasi final kluster untuk Aloysius 5-44
Tabel 5.30 Hasil ANOVA untuk Aloysius 5-45
Tabel 5.31 Prioritas kepentingan untuk Aloysius 5-47
Tabel 5.32 Akreditasi jurusan/Program studi UKM
untuk Aloysius 5-51
Tabel 5.33 Wadah/unit kegiatan olahraga dan kesenian
untuk Aloysius 5-55
Tabel 5.34 Rekapitulasi prioritas untuk BPK dan Aloysius 5-57
Tabel 5.35 Rekapitulasi koefisien keragaman bagian 2
untuk BPK 5-60
Tabel 5.36 Rekapitulasi koefisien keragaman bagian 2
untuk Aloysius 5-64
Tabel 5.37 Rekapitulasi uji validitas kepuasan BPK 5-69
Tabel 5.38 Rekapitulasi uji validitas kepuasan Aloysius 5-70
Tabel 5.40 Rekapitulasi uji reliabilitas kepuasan Aloysius 5-71
Tabel 5.41 Model summary BPK 5-71
Tabel 5.42 Hasil Coefficients BPK 5-72
Tabel 5.43 Model summary Aloysius 5-74
Tabel 5.44 Hasil Coefficients Aloysius 5-74
Tabel 5.45 Hasil Uji Nonmultikolinearitas untuk BPK 5-77
Tabel 5.46 Rekapitulasi statistika deskriptif untuk BPK 5-79
Tabel 5.47 Pembobotan variabel X1 untuk BPK 5-80
Tabel 5.48 Pembobotan variabel X2 untuk BPK 5-81
Tabel 5.49 Pembobotan variabel X3 untuk BPK 5-82
Tabel 5.50 Pembobotan variabel X4 untuk BPK 5-83
Tabel 5.51 Pembobotan variabel X5 untuk BPK 5-84
Tabel 5.52 Pembobotan variabel X6 untuk BPK 5-85
Tabel 5.53 Pembobotan variabel X7 untuk BPK 5-86
Tabel 5.54 Pembobotan variabel X8 untuk BPK 5-87
Tabel 5.55 Pembobotan variabel X9 untuk BPK 5-88
Tabel 5.56 Pembobotan variabel X10 untuk BPK 5-89
Tabel 5.57 Pembobotan variabel X11 untuk BPK 5-90
Tabel 5.58 Pembobotan variabel X12 untuk BPK 5-92
Tabel 5.59 Pembobotan variabel Y untuk BPK 5-93
Tabel 5.60 Rekapitulasi statistika deskriptif untuk Aloysius 5-94
Tabel 5.61 Pembobotan variabel X1 untuk Aloysius 5-95
Tabel 5.62 Pembobotan variabel X2 untuk Aloysius 5-96
Tabel 5.63 Pembobotan variabel X3 untuk Aloysius 5-97
Tabel 5.64 Pembobotan variabel X4 untuk Aloysius 5-98
Tabel 5.65 Pembobotan variabel X5 untuk Aloysius 5-99
Tabel 5.66 Pembobotan variabel X6 untuk Aloysius 5-100
Tabel 5.67 Pembobotan variabel X7 untuk Aloysius 5-101
Tabel 5.68 Pembobotan variabel X8 untuk Aloysius 5-102
Tabel 5.70 Pembobotan variabel X11 untuk Aloysius 5-104
Tabel 5.71 Pembobotan variabel X12 untuk Aloysius 5-105
Tabel 5.72 Pembobotan variabel Y untuk Aloysius 5-106
Tabel 5.73 Rekapitulasi koefisien keragaman bagian 3
untuk BPK 5-108
Tabel 5.74 Rekapitulasi koefisien keragaman bagian 3
untuk Aloysius 5-109
Tabel 6.1 Faktor-faktor yang dianggap penting
DAFTAR LAMPIRAN
Lampiran Judul Halaman
A Data mentah BPK dan Aloysius (Bagian 1, 2, 3) LA-1
B Hasil Pengolahan dengan menggunakan
SPSS 11.5 LB-1
C Kuesioner Penelitian LC-1
D Tabel Nilai-nilai r product moment LD-1
E Tabel F LE-1
LAMPIRAN A
Data mentah BPK dan Aloysius
Data mahasiswa yang masuk ke Universitas Kristen Maranatha
Tahun Jumlah yang
masuk Penurunan
% Penurunan
2002 8856 956 10.79%
2003 7900 1748 22.13%
2004 6152 -976 -15.86%
2005 7128 630 8.84%
2006 6498 -176 -2.71%
2007 6674
Rata-rata penurunan tiap tahunnya:
tahun 3
8.84% 22.13%
10.79%+ +
LAMPIRAN B
Hasil Pengolahan dengan menggunakan
Pengujian Valid BPK (Bagian 2)
R E L I A B I L I T Y A N A L Y S I S - S C A L E (A L P H A)
Item-total Statistics
Scale Scale Corrected
Item-total Statistics
Scale Scale Corrected
if Item if Item Total if Item Deleted Deleted Correlation Deleted
P42 181.6150 247.3223 .4820 .9418
P43 181.7743 246.7088 .5030 .9416
P44 181.7301 245.9935 .5439 .9414
P45 181.5398 248.3651 .4764 .9418
P46 181.7124 247.5569 .4444 .9420
P47 181.9646 248.7899 .3620 .9425
P48 181.5310 246.8635 .5321 .9415
P49 181.2611 250.0960 .4646 .9419
P50 181.2965 249.1962 .4981 .9418
P51 181.6106 246.1766 .5738 .9413
P52 181.5885 245.1232 .6680 .9408
P53 181.6681 245.6360 .6312 .9410
P54 181.5619 246.6206 .6030 .9412
P55 182.1150 248.4134 .3124 .9432
Reliability Coefficients N of Cases = 226.0 N of Items = 55 Alpha = .9428
P50 178.2257 247.0200 .4980 .9427
P51 178.5398 243.9562 .5770 .9422
P52 178.5177 242.9264 .6703 .9418
P53 178.5973 243.4505 .6326 .9420
P54 178.4912 244.4110 .6057 .9422
P55 179.0442 246.1847 .3145 .9442
Reliability Coefficients N of Cases = 226.0 N of Items = 54 Alpha = .9438
Pengujian Valid BPK (Bagian 3) R E L I A B I L I T Y A N A L Y S I S - S C A L E (A L P H A) Item-total Statistics Scale Scale Corrected Mean Variance Item- Alpha if Item if Item Total if Item Deleted Deleted Correlation Deleted X1 33.2097 22.5248 .4328 .8696
X2 33.6532 19.8056 .7102 .8534
X3 33.5645 20.1178 .6486 .8570
X4 33.4597 20.4943 .6157 .8592
X5 33.2258 21.7535 .3832 .8715
X6 33.7258 19.6478 .7217 .8525
X7 33.6290 19.4222 .7362 .8513
X9 33.3226 21.3910 .3528 .8753 X10 33.2016 21.4468 .3990 .8713 X11 33.4194 20.0504 .6115 .8591 X12 33.4839 20.3656 .5814 .8610 Y 32.9597 22.2667 .2938 .8757
Reliability Coefficients
N of Cases = 124.0 N of Items = 13
Alpha = .8722
Pengujian Valid Aloysius (Bagian2)
R E L I A B I L I T Y A N A L Y S I S - S C A L E (A L P H A)
Item-total Statistics
Scale Scale Corrected
Mean Variance Item- Alpha if Item if Item Total if Item Deleted Deleted Correlation Deleted
P15 173.1846 180.5904 .4616 .9068
Item-total Statistics
Scale Scale Corrected
Reliability Coefficients
N of Cases = 65.0 N of Items = 55
Pengujian Valid setelah variabel yang tidak valid dihilangkan
R E L I A B I L I T Y A N A L Y S I S - S C A L E (A L P H A)
Item-total Statistics
Scale Scale Corrected
Mean Variance Item- Alpha if Item if Item Total if Item Deleted Deleted Correlation Deleted
P29 146.4000 157.4313 .4209 .9100
Item-total Statistics
Scale Scale Corrected
Reliability Coefficients
N of Cases = 65.0 N of Items = 47
Alpha = .9119
Pengujian Valid setelah variabel yang tidak valid dihilangkan(2)
R E L I A B I L I T Y A N A L Y S I S - S C A L E (A L P H A)
Item-total Statistics
P9 143.3077 153.7476 .3905 .9105 P10 143.3385 154.4149 .3387 .9111 P11 143.2769 153.4846 .3926 .9105 P12 143.3538 154.0760 .3843 .9106 P13 143.3077 155.3101 .2933 .9115 P14 143.6154 149.8966 .6255 .9080 P15 143.4769 151.7534 .4871 .9095 P16 143.3231 153.1909 .4858 .9097 P17 143.4769 152.3471 .4944 .9095 P18 143.9692 151.5928 .4681 .9097 P19 143.7077 151.7726 .6066 .9087 P20 144.2308 149.5553 .4890 .9094 P21 143.7692 152.0553 .5599 .9090 P22 143.8000 150.8500 .5806 .9086 P23 143.7231 150.1096 .4688 .9097 P24 143.8462 152.9135 .3659 .9109 P25 144.4462 152.4697 .2984 .9124 P26 144.4154 151.7466 .3516 .9114 P27 144.1231 153.2659 .2947 .9120 P28 143.2615 154.2899 .4068 .9105 P29 143.3538 153.7635 .4084 .9104 P30 143.6923 154.3726 .2682 .9121 P31 143.4000 153.2125 .4246 .9102 P32 143.3846 154.7716 .3523 .9109 P33 143.6462 153.7322 .4394 .9101 P35 143.8923 152.0038 .4474 .9099 P36 144.3538 151.6697 .4023 .9105 P37 143.6923 154.1851 .3731 .9107 P39 143.5385 153.7837 .4540 .9101 P40 143.4000 153.4313 .4086 .9104 P41 143.4769 154.0034 .3520 .9109 P42 143.7692 151.3678 .4994 .9093 P45 143.4154 153.5279 .3812 .9106 P46 143.6615 151.9774 .4746 .9096 P47 144.3231 153.4721 .2913 .9120 P50 143.2615 156.1024 .2553 .9118 P51 143.6462 152.0760 .5406 .9091 P52 143.5846 153.7154 .4160 .9103 P53 143.6769 152.5659 .5194 .9094 P54 143.7077 151.8038 .6039 .9087 P55 144.2615 149.4462 .5214 .9090
Reliability Coefficients
N of Cases = 65.0 N of Items = 46
Pengujian Valid Aloysius (Bagian 3)
( R E L I A B I L I T Y A N A L Y S I S - S C A L E (A L P H A)
Item-total Statistics
Scale Scale Corrected Reliability Coefficients
N of Cases = 33.0 N of Items = 13 Alpha = .8683
Pengujian Valid setelah variabel yang tidak valid dihilangkan
R E L I A B I L I T Y A N A L Y S I S - S C A L E (A L P H A)
Item-total Statistics
Scale Scale Corrected
Reliability Coefficients
N of Cases = 33.0 N of Items = 12 Alpha = .8710
Initial Cluster Centers
4.00 4.00 3.00
4.00 4.00 3.00
3.00 4.00 3.00
2.00 4.00 2.00
3.00 4.00 3.00
4.00 4.00 3.00
4.00 4.00 3.00
4.00 4.00 3.00
4.00 4.00 3.00
4.00 4.00 4.00
1.00 4.00 4.00
4.00 4.00 4.00
3.00 4.00 3.00
4.00 4.00 3.00
4.00 4.00 3.00
4.00 4.00 3.00
2.00 4.00 3.00
4.00 4.00 2.00
3.00 4.00 2.00
4.00 4.00 4.00
4.00 4.00 4.00
4.00 4.00 4.00
1.00 4.00 3.00
1.00 4.00 2.00
1.00 4.00 3.00
1.00 4.00 3.00
4.00 4.00 3.00
4.00 4.00 3.00
4.00 4.00 3.00
4.00 4.00 3.00
4.00 4.00 2.00
4.00 4.00 2.00
4.00 4.00 2.00
3.00 4.00 2.00
2.00 4.00 4.00
1.00 4.00 3.00
3.00 4.00 3.00
3.00 4.00 4.00
4.00 4.00 2.00
4.00 3.00 3.00
2.00 3.00 4.00
2.00 4.00 2.00
2.00 3.00 2.00
4.00 4.00 3.00
4.00 3.00 4.00
4.00 4.00 2.00
2.00 4.00 2.00
4.00 4.00 4.00
4.00 4.00 2.00
4.00 4.00 3.00
4.00 4.00 3.00
2.00 4.00 2.00
3.00 4.00 3.00
4.00 2.00 4.00
Iteration Historya
5.244 3.896 5.117
.905 .316 .314
.587 .146 .188
.450 .108 .161
.311 .055 .126
.121 .036 .000
.239 .078 .000
.164 .057 .000
.269 .077 .071
.504 .133 .184
Iteration 1 2 3 4 5 6 7 8 9 10
1 2 3
Change in Cluster Centers
Iterations stopped because the maximum number of iterations was performed. Iterations failed to
Final Cluster Centers
3.67 3.77 3.42
3.52 3.60 3.32
3.24 3.19 2.91
3.07 3.16 2.84
3.16 3.31 2.91
3.16 3.61 3.24
3.90 3.98 3.55
3.67 3.88 3.32
3.52 3.80 3.41
3.67 3.89 3.38
3.38 3.83 3.19
3.52 3.86 3.15
3.57 3.73 3.11
3.72 3.89 3.23
3.74 3.86 3.18
3.53 3.85 3.09
2.90 3.40 2.80
3.29 3.70 3.00
2.86 3.46 2.70
3.28 3.66 2.97
3.34 3.71 2.91
3.26 3.82 3.16
3.07 3.64 2.97
2.52 3.10 2.54
2.57 2.94 2.53
2.69 3.26 2.70
3.83 3.91 3.26
3.81 3.93 3.27
3.53 3.55 3.03
3.64 3.86 3.15
3.72 3.90 3.18
3.38 3.81 3.04
3.48 3.77 3.00
3.16 3.70 2.96
2.41 3.20 2.78
2.97 3.62 2.89
3.00 3.52 2.86
3.33 3.76 3.03
3.47 3.88 3.08
3.47 3.88 3.16
3.28 3.70 3.05
3.19 3.53 2.85
3.29 3.59 2.84
3.55 3.69 3.08
3.21 3.54 3.01
3.07 3.22 2.76
3.48 3.76 3.08
3.83 3.93 3.42
3.83 3.89 3.35
3.26 3.79 2.97
3.24 3.85 2.97
3.03 3.78 2.99
3.26 3.81 3.09
2.55 3.21 2.72
ANOVA
2.569 2 .223 223 11.541 .000
1.561 2 .275 223 5.677 .004
2.361 2 .339 223 6.974 .001
2.199 2 .289 223 7.617 .001
3.377 2 .430 223 7.844 .001
4.559 2 .375 223 12.151 .000
3.971 2 .142 223 28.003 .000
6.488 2 .236 223 27.453 .000
3.439 2 .231 223 14.897 .000
5.497 2 .202 223 27.168 .000
9.106 2 .270 223 33.686 .000
10.546 2 .175 223 60.224 .000
8.375 2 .286 223 29.314 .000
9.450 2 .196 223 48.317 .000
10.456 2 .220 223 47.548 .000
11.853 2 .236 223 50.171 .000
8.872 2 .466 223 19.028 .000
10.420 2 .277 223 37.676 .000
13.283 2 .402 223 33.028 .000
9.902 2 .281 223 35.252 .000
13.498 2 .281 223 48.017 .000
10.521 2 .247 223 42.579 .000
10.809 2 .239 223 45.164 .000
8.786 2 .471 223 18.659 .000
4.219 2 .459 223 9.199 .000
8.561 2 .349 223 24.555 .000
9.852 2 .151 223 65.160 .000
9.537 2 .143 223 66.491 .000
6.710 2 .348 223 19.280 .000
10.702 2 .179 223 59.717 .000
11.417 2 .163 223 69.865 .000
12.388 2 .193 223 64.116 .000
12.209 2 .230 223 53.038 .000
12.460 2 .216 223 57.718 .000
11.489 2 .465 223 24.691 .000
13.263 2 .275 223 48.266 .000
10.082 2 .341 223 29.541 .000
11.227 2 .207 223 54.317 .000
13.401 2 .214 223 62.709 .000
10.972 2 .207 223 52.962 .000
9.122 2 .283 223 32.275 .000
9.628 2 .295 223 32.687 .000
11.590 2 .273 223 42.447 .000
8.073 2 .224 223 36.069 .000
6.021 2 .349 223 17.252 .000
4.564 2 .402 223 11.353 .000
9.424 2 .248 223 37.956 .000
5.651 2 .147 223 38.460 .000
6.731 2 .162 223 41.609 .000
14.349 2 .201 223 71.406 .000
17.034 2 .146 223 116.943 .000
16.272 2 .158 223 103.010 .000
11.746 2 .170 223 68.911 .000
9.322 2 .543 223 17.162 .000
P1
Mean Square df
Cluster
Mean Square df
Error
F Sig.
Number of Cases in each Cluster
58.000 94.000 74.000 226.000 .000 1
2 3 Cluster
4 klaster
Initial Cluster Centers
4.00 4.00 3.00 3.00
4.00 3.00 3.00 2.00
3.00 3.00 3.00 4.00
2.00 3.00 3.00 4.00
3.00 4.00 2.00 4.00
4.00 3.00 2.00 4.00
4.00 4.00 1.00 4.00
4.00 2.00 3.00 4.00
4.00 2.00 4.00 4.00
4.00 4.00 4.00 4.00
1.00 3.00 3.00 4.00
4.00 3.00 3.00 4.00
3.00 4.00 1.00 4.00
4.00 4.00 1.00 4.00
4.00 4.00 1.00 4.00
4.00 4.00 1.00 4.00
2.00 3.00 4.00 4.00
4.00 3.00 4.00 4.00
3.00 3.00 4.00 4.00
4.00 3.00 4.00 4.00
4.00 4.00 4.00 4.00
4.00 2.00 4.00 4.00
1.00 3.00 4.00 4.00
1.00 3.00 3.00 4.00
1.00 3.00 3.00 4.00
1.00 3.00 3.00 4.00
4.00 4.00 4.00 4.00
4.00 4.00 4.00 4.00
4.00 4.00 3.00 4.00
4.00 4.00 3.00 4.00
4.00 3.00 3.00 4.00
4.00 3.00 3.00 4.00
4.00 4.00 3.00 4.00
3.00 4.00 3.00 4.00
2.00 2.00 3.00 4.00
1.00 3.00 3.00 4.00
3.00 2.00 3.00 4.00
3.00 4.00 4.00 4.00
4.00 2.00 4.00 4.00
4.00 1.00 4.00 4.00
2.00 4.00 3.00 4.00
2.00 3.00 3.00 4.00
2.00 4.00 3.00 4.00
4.00 4.00 3.00 4.00
4.00 1.00 3.00 4.00
4.00 4.00 3.00 4.00
2.00 4.00 4.00 4.00
4.00 3.00 4.00 4.00
4.00 3.00 4.00 4.00
4.00 3.00 3.00 4.00
4.00 4.00 3.00 4.00
2.00 2.00 3.00 4.00
3.00 2.00 3.00 4.00
4.00 1.00 3.00 4.00
Iteration Historya
5.869 5.757 5.591 4.015
.474 .504 .256 .280
.213 .429 .241 .150
.453 .571 .355 .131
.167 .452 .262 .225
.262 .286 .169 .187
.094 .185 .166 .113
.227 .107 .099 .086
.159 .080 .102 .076
.000 .071 .000 .070
Iteration 1 2 3 4 5 6 7 8 9 10
1 2 3 4
Change in Cluster Centers
Iterations stopped because the maximum number of iterations was performed. Iterations failed to
Final Cluster Centers
3.45 3.62 3.41 3.83
3.48 3.50 3.20 3.64
2.93 3.12 2.98 3.25
2.62 3.16 2.93 3.12
2.90 3.20 2.86 3.32
3.21 3.32 3.14 3.62
3.72 3.92 3.41 3.99
3.48 3.72 3.18 3.90
3.52 3.61 3.27 3.81
3.38 3.68 3.39 3.92
2.86 3.51 3.27 3.87
3.10 3.61 3.09 3.90
3.17 3.59 3.02 3.77
3.48 3.71 3.09 3.92
3.38 3.72 3.05 3.90
3.28 3.54 3.00 3.90
2.48 3.03 2.89 3.45
2.97 3.30 3.07 3.75
2.45 3.01 2.77 3.49
3.00 3.17 3.11 3.75
2.83 3.32 3.05 3.77
3.07 3.38 3.18 3.84
2.86 3.16 2.98 3.71
1.79 2.79 2.73 3.13
1.83 2.80 2.73 2.94
2.07 2.92 2.84 3.31
3.45 3.82 3.11 3.95
3.52 3.82 3.09 3.95
3.14 3.43 3.07 3.58
3.41 3.58 3.11 3.88
3.38 3.68 3.09 3.95
3.14 3.38 3.07 3.84
2.97 3.51 3.02 3.79
2.93 3.18 3.02 3.77
2.34 2.61 2.91 3.29
2.79 3.01 2.95 3.71
2.72 2.96 3.02 3.64
3.07 3.36 3.05 3.79
3.28 3.50 3.00 3.91
3.28 3.53 3.09 3.91
2.83 3.34 3.16 3.75
2.69 3.22 2.91 3.60
2.66 3.32 2.91 3.65
3.17 3.51 3.02 3.75
2.86 3.25 3.02 3.62
2.72 3.05 2.80 3.26
3.10 3.50 3.07 3.79
3.69 3.79 3.27 3.96
3.66 3.75 3.20 3.95
3.07 3.26 3.00 3.84
3.07 3.30 2.98 3.88
2.97 3.16 3.00 3.82
3.24 3.29 3.02 3.88
2.41 2.71 2.80 3.27
ANOVA
2.077 3 .219 222 9.497 .000
1.747 3 .267 222 6.550 .000
1.050 3 .347 222 3.023 .031
2.369 3 .278 222 8.527 .000
2.651 3 .427 222 6.209 .000
2.780 3 .380 222 7.308 .000
3.540 3 .130 222 27.151 .000
5.176 3 .226 222 22.912 .000
2.718 3 .226 222 12.019 .000
3.633 3 .204 222 17.836 .000
8.211 3 .243 222 33.840 .000
8.163 3 .161 222 50.828 .000
6.399 3 .276 222 23.189 .000
6.825 3 .189 222 36.041 .000
7.616 3 .212 222 35.896 .000
8.182 3 .234 222 35.036 .000
7.670 3 .445 222 17.249 .000
6.802 3 .280 222 24.311 .000
9.706 3 .392 222 24.730 .000
6.974 3 .277 222 25.167 .000
8.474 3 .289 222 29.274 .000
6.557 3 .254 222 25.775 .000
8.249 3 .226 222 36.446 .000
12.584 3 .382 222 32.937 .000
9.049 3 .376 222 24.034 .000
11.024 3 .278 222 39.606 .000
7.534 3 .139 222 54.275 .000
7.657 3 .127 222 60.512 .000
3.138 3 .368 222 8.536 .000
5.809 3 .198 222 29.348 .000
7.532 3 .165 222 45.592 .000
7.185 3 .209 222 34.445 .000
8.049 3 .232 222 34.626 .000
8.336 3 .216 222 38.514 .000
8.896 3 .451 222 19.737 .000
10.145 3 .258 222 39.260 .000
8.933 3 .313 222 28.547 .000
6.898 3 .216 222 32.001 .000
8.434 3 .221 222 38.092 .000
7.134 3 .211 222 33.882 .000
7.278 3 .268 222 27.181 .000
7.793 3 .277 222 28.102 .000
9.310 3 .253 222 36.813 .000
5.881 3 .218 222 26.968 .000
5.708 3 .328 222 17.416 .000
3.079 3 .403 222 7.633 .000
6.352 3 .248 222 25.565 .000
4.541 3 .137 222 33.105 .000
5.262 3 .152 222 34.611 .000
8.927 3 .210 222 42.409 .000
9.907 3 .166 222 59.723 .000
9.748 3 .174 222 56.173 .000
8.546 3 .162 222 52.894 .000
6.892 3 .536 222 12.847 .000
P1
Mean Square df
Cluster
Mean Square df
Error
F Sig.
Number of Cases in each Cluster
29.000 76.000 44.000 77.000 226.000 .000 1
2 3 4 Cluster
5 klaster
Initial Cluster Centers
4.00 3.00 4.00 4.00 3.00
4.00 3.00 4.00 4.00 4.00
3.00 3.00 4.00 3.00 3.00
2.00 3.00 4.00 3.00 3.00
3.00 2.00 4.00 2.00 2.00
4.00 2.00 4.00 4.00 3.00
4.00 1.00 4.00 4.00 3.00
4.00 3.00 4.00 4.00 2.00
4.00 4.00 4.00 4.00 3.00
4.00 4.00 4.00 4.00 3.00
1.00 3.00 4.00 4.00 3.00
4.00 3.00 4.00 4.00 3.00
3.00 1.00 4.00 4.00 2.00
4.00 1.00 4.00 4.00 3.00
4.00 1.00 4.00 4.00 4.00
4.00 1.00 4.00 4.00 3.00
2.00 4.00 4.00 3.00 2.00
4.00 4.00 4.00 3.00 1.00
3.00 4.00 4.00 1.00 2.00
4.00 4.00 4.00 1.00 3.00
4.00 4.00 4.00 2.00 3.00
4.00 4.00 4.00 2.00 2.00
1.00 4.00 4.00 2.00 3.00
1.00 3.00 4.00 3.00 1.00
1.00 3.00 4.00 2.00 2.00
1.00 3.00 4.00 3.00 2.00
4.00 4.00 4.00 4.00 4.00
4.00 4.00 4.00 4.00 4.00
4.00 3.00 4.00 4.00 3.00
4.00 3.00 4.00 2.00 3.00
4.00 3.00 4.00 4.00 3.00
4.00 3.00 4.00 2.00 3.00
4.00 3.00 4.00 4.00 3.00
3.00 3.00 4.00 2.00 3.00
2.00 3.00 4.00 4.00 1.00
1.00 3.00 4.00 2.00 3.00
3.00 3.00 4.00 2.00 3.00
3.00 4.00 4.00 2.00 3.00
4.00 4.00 4.00 1.00 3.00
4.00 4.00 4.00 4.00 3.00
2.00 3.00 4.00 4.00 3.00
2.00 3.00 4.00 4.00 2.00
2.00 3.00 4.00 3.00 2.00
4.00 3.00 4.00 3.00 3.00
4.00 3.00 4.00 4.00 1.00
4.00 3.00 4.00 4.00 1.00
2.00 4.00 4.00 4.00 2.00
4.00 4.00 4.00 4.00 4.00
4.00 4.00 4.00 4.00 3.00
4.00 3.00 4.00 2.00 3.00
4.00 3.00 4.00 2.00 3.00
2.00 3.00 4.00 2.00 3.00
3.00 3.00 4.00 4.00 3.00
4.00 3.00 4.00 2.00 2.00
Iteration Historya
4.493 4.907 3.732 5.003 5.189
.984 .753 .259 1.066 .314
.000 .739 .217 .802 .183
.904 .727 .285 .512 .101
.000 .328 .244 .497 .119
.000 .143 .097 .340 .173
.000 .181 .060 .240 .151
.000 .129 .000 .133 .065
.000 .000 .070 .159 .066
.000 .000 .050 .085 .000
Iteration 1 2 3 4 5 6 7 8 9 10
1 2 3 4 5
Change in Cluster Centers
Iterations stopped because the maximum number of iterations was performed. Iterations failed to converge. The maximum absolute coordinate change for any center is .028. The current iteration is 10. The minimum distance between initial centers is 8.944.
Final Cluster Centers
3.50 3.60 3.82 3.66 3.36
3.50 3.43 3.59 3.56 3.31
2.75 3.10 3.22 3.22 2.90
2.50 3.30 3.13 3.00 2.81
3.50 3.17 3.33 3.04 2.92
3.50 3.30 3.60 3.26 3.17
4.00 3.70 3.99 3.92 3.54
4.00 3.57 3.90 3.66 3.29
3.75 3.37 3.77 3.76 3.32
3.50 3.47 3.89 3.84 3.32
3.25 3.23 3.86 3.56 3.12
3.75 3.30 3.89 3.64 3.07
3.00 3.03 3.77 3.78 3.10
4.00 3.03 3.93 3.98 3.20
4.00 3.03 3.90 3.94 3.17
4.00 2.90 3.89 3.76 3.08
2.00 3.10 3.41 2.98 2.75
3.00 3.40 3.71 3.30 2.95
2.75 3.23 3.49 2.74 2.64
3.75 3.43 3.71 3.00 3.02
3.75 3.57 3.73 3.12 2.88
3.25 3.37 3.84 3.32 3.10
2.50 3.30 3.70 3.02 2.93
1.50 2.87 3.13 2.66 2.37
1.25 2.80 2.95 2.72 2.41
1.50 2.97 3.30 2.80 2.59
3.75 3.70 3.95 3.80 3.17
3.75 3.67 3.95 3.80 3.20
3.75 3.60 3.57 3.32 3.02
3.75 3.53 3.87 3.54 3.19
3.50 3.63 3.94 3.70 3.10
3.75 3.43 3.83 3.30 3.02
3.75 3.50 3.77 3.44 2.93
3.25 3.13 3.72 3.24 2.92
2.25 2.60 3.25 2.60 2.71
3.00 3.07 3.67 2.90 2.92
3.00 3.13 3.61 2.78 2.92
3.25 3.47 3.77 3.26 3.00
4.00 3.67 3.90 3.30 3.03
3.75 3.73 3.90 3.34 3.08
2.75 3.43 3.73 3.22 3.03
2.75 3.43 3.58 3.02 2.81
2.75 3.50 3.63 3.18 2.75
4.00 3.53 3.73 3.34 3.08
3.00 3.33 3.59 3.20 2.92
3.00 3.00 3.25 3.08 2.69
3.25 3.53 3.77 3.50 2.98
3.75 3.77 3.95 3.78 3.37
3.75 3.77 3.92 3.78 3.29
3.75 3.30 3.82 3.18 2.97
4.00 3.30 3.87 3.20 2.95
3.25 3.10 3.81 3.06 3.00
3.50 3.17 3.87 3.28 3.08
3.00 2.67 3.24 2.68 2.64
ANOVA
1.886 4 .214 221 8.824 .000
.798 4 .277 221 2.879 .024
1.180 4 .342 221 3.452 .009
1.748 4 .280 221 6.252 .000
1.717 4 .434 221 3.958 .004
1.919 4 .385 221 4.982 .001
1.987 4 .143 221 13.895 .000
3.441 4 .235 221 14.648 .000
2.497 4 .219 221 11.411 .000
3.505 4 .190 221 18.401 .000
5.406 4 .257 221 21.008 .000
6.455 4 .155 221 41.561 .000
6.718 4 .242 221 27.707 .000
8.861 4 .122 221 72.338 .000
8.658 4 .160 221 54.171 .000
9.492 4 .174 221 54.601 .000
5.196 4 .457 221 11.376 .000
5.228 4 .279 221 18.752 .000
8.061 4 .380 221 21.205 .000
6.071 4 .263 221 23.068 .000
7.487 4 .270 221 27.698 .000
5.298 4 .249 221 21.307 .000
6.878 4 .215 221 32.016 .000
6.886 4 .430 221 16.016 .000
4.763 4 .415 221 11.482 .000
6.798 4 .306 221 22.201 .000
5.565 4 .141 221 39.463 .000
5.070 4 .139 221 36.396 .000
3.208 4 .354 221 9.067 .000
4.060 4 .204 221 19.882 .000
6.180 4 .156 221 39.523 .000
6.156 4 .196 221 31.465 .000
6.201 4 .231 221 26.896 .000
6.131 4 .220 221 27.913 .000
5.252 4 .478 221 10.978 .000
7.161 4 .268 221 26.752 .000
6.996 4 .309 221 22.642 .000
5.515 4 .210 221 26.220 .000
7.533 4 .201 221 37.557 .000
6.625 4 .188 221 35.160 .000
5.119 4 .275 221 18.608 .000
6.163 4 .273 221 22.592 .000
7.458 4 .245 221 30.389 .000
4.156 4 .224 221 18.583 .000
4.140 4 .332 221 12.480 .000
2.727 4 .398 221 6.858 .000
5.467 4 .237 221 23.078 .000
2.943 4 .146 221 20.133 .000
3.583 4 .159 221 22.490 .000
7.214 4 .202 221 35.707 .000
8.465 4 .148 221 57.226 .000
7.646 4 .168 221 45.442 .000
6.535 4 .160 221 40.837 .000
4.380 4 .553 221 7.919 .000
P1
Mean Square df
Cluster
Mean Square df
Error
F Sig.
Number of Cases in each Cluster
4.000 30.000 83.000 50.000 59.000 226.000 .000 1
2 3 4 5 Cluster
Quick Cluster (Aloysius) 3 klaster
Initial Cluster Centers
4.00 2.00 4.00
4.00 4.00 4.00
3.00 2.00 2.00
4.00 2.00 2.00
4.00 3.00 3.00
4.00 2.00 4.00
4.00 2.00 4.00
4.00 2.00 4.00
4.00 3.00 4.00
4.00 4.00 4.00
4.00 3.00 3.00
4.00 3.00 4.00
4.00 3.00 4.00
4.00 3.00 4.00
4.00 2.00 4.00
4.00 2.00 4.00
4.00 3.00 1.00
4.00 3.00 4.00
4.00 2.00 4.00
4.00 2.00 4.00
4.00 2.00 1.00
4.00 1.00 1.00
4.00 1.00 1.00
4.00 2.00 1.00
4.00 4.00 4.00
4.00 4.00 4.00
3.00 4.00 4.00
4.00 4.00 4.00
4.00 4.00 4.00
4.00 4.00 2.00
4.00 2.00 3.00
4.00 2.00 1.00
4.00 4.00 3.00
4.00 3.00 4.00
4.00 2.00 4.00
4.00 2.00 4.00
4.00 2.00 1.00
4.00 4.00 4.00
4.00 4.00 4.00
3.00 4.00 1.00
4.00 4.00 4.00
4.00 2.00 4.00
4.00 2.00 4.00
4.00 2.00 2.00
4.00 2.00 4.00
4.00 2.00 1.00
Iteration Historya
4.614 5.215 5.002
.386 .537 .000
.526 .497 .411
.143 .258 .711
.135 .179 .351
.000 .000 .000
Iteration 1 2 3 4 5 6
1 2 3
Change in Cluster Centers
Final Cluster Centers
3.69 3.14 3.60
3.19 2.86 3.10
3.08 2.72 2.00
3.27 2.69 2.60
3.23 2.93 3.20
3.73 3.34 3.90
3.69 3.28 4.00
3.88 3.24 4.00
3.69 3.41 3.50
3.77 3.41 3.60
3.69 3.00 3.00
3.77 3.10 3.40
3.88 3.24 3.70
3.73 3.07 3.60
3.19 2.59 3.20
3.46 2.90 3.30
3.15 2.38 2.20
3.35 2.90 3.20
3.38 2.86 3.00
3.50 3.00 2.80
3.35 3.00 2.40
2.69 2.55 1.50
2.85 2.48 1.50
3.04 2.86 1.80
3.85 3.38 3.80
3.69 3.31 3.80
3.31 3.03 3.40
3.65 3.34 3.50
3.62 3.31 3.80
3.50 3.07 3.10
3.31 2.86 2.60
2.88 2.31 2.30
3.46 3.07 2.90
3.58 3.10 3.50
3.62 3.31 3.70
3.54 3.17 3.80
3.42 3.00 2.70
3.73 3.21 3.60
3.42 3.07 3.20
2.81 2.48 2.20
3.85 3.34 3.90
3.58 3.07 2.90
3.50 3.17 3.20
3.54 3.03 2.90
3.46 3.03 2.90
3.12 2.24 2.50
ANOVA
2.276 2 .345 62 6.598 .003
.776 2 .393 62 1.973 .148
4.211 2 .414 62 10.183 .000
2.862 2 .286 62 10.012 .000
.684 2 .324 62 2.113 .129
1.609 2 .267 62 6.021 .004
2.365 2 .247 62 9.564 .000
3.710 2 .225 62 16.473 .000
.540 2 .275 62 1.963 .149
.867 2 .259 62 3.351 .042
3.738 2 .251 62 14.917 .000
3.040 2 .286 62 10.645 .000
2.937 2 .162 62 18.094 .000
3.204 2 .216 62 14.848 .000
2.971 2 .333 62 8.911 .000
2.267 2 .181 62 12.491 .000
5.371 2 .449 62 11.973 .000
1.421 2 .229 62 6.214 .003
1.922 2 .284 62 6.770 .002
2.519 2 .518 62 4.866 .011
3.288 2 .359 62 9.149 .000
5.425 2 .568 62 9.553 .000
6.545 2 .470 62 13.932 .000
5.764 2 .420 62 13.741 .000
1.663 2 .191 62 8.729 .000
2.151 2 .175 62 12.307 .000
2.477 2 .211 62 11.714 .000
.804 2 .262 62 3.070 .054
2.329 2 .199 62 11.713 .000
1.729 2 .199 62 8.695 .000
5.337 2 .395 62 13.526 .000
P2
Mean Square df Cluster
Mean Square df Error
F Sig.
Number of Cases in each Cluster
26.000 29.000 10.000 65.000 .000 1
2 3 Cluster
4 klaster
Initial Cluster Centers
4.00 4.00 4.00 1.00
3.00 4.00 4.00 4.00
3.00 3.00 2.00 2.00
3.00 4.00 2.00 3.00
3.00 4.00 3.00 4.00
3.00 4.00 4.00 4.00
3.00 4.00 4.00 4.00
3.00 4.00 4.00 4.00
3.00 4.00 4.00 4.00
3.00 4.00 4.00 4.00
3.00 4.00 3.00 3.00
3.00 4.00 4.00 3.00
4.00 4.00 4.00 4.00
3.00 4.00 4.00 4.00
2.00 4.00 4.00 2.00
3.00 4.00 4.00 3.00
2.00 4.00 1.00 3.00
2.00 4.00 4.00 3.00
2.00 4.00 4.00 3.00
2.00 4.00 4.00 1.00
2.00 4.00 1.00 2.00
2.00 4.00 1.00 1.00
2.00 4.00 1.00 1.00
2.00 4.00 1.00 1.00
4.00 4.00 4.00 4.00
3.00 4.00 4.00 4.00
3.00 3.00 4.00 4.00
3.00 4.00 4.00 4.00
3.00 4.00 4.00 4.00
3.00 4.00 2.00 4.00
3.00 4.00 3.00 1.00
2.00 4.00 1.00 4.00
3.00 4.00 3.00 4.00
3.00 4.00 4.00 4.00
2.00 4.00 4.00 4.00
2.00 4.00 4.00 4.00
2.00 4.00 1.00 4.00
2.00 4.00 4.00 4.00
2.00 4.00 4.00 4.00
2.00 3.00 1.00 3.00
3.00 4.00 4.00 4.00
3.00 4.00 4.00 2.00
3.00 4.00 4.00 2.00
3.00 4.00 2.00 2.00
3.00 4.00 4.00 2.00
2.00 4.00 1.00 3.00
Iteration Historya
3.976 3.469 3.712 .000
.000 .269 1.210 .000
.000 .000 .000 .000
Iteration 1 2 3
1 2 3 4
Change in Cluster Centers
Final Cluster Centers
3.31 3.72 4.00 1.00
2.86 3.39 3.00 4.00
2.69 3.17 1.75 2.00
2.71 3.39 2.75 3.00
3.00 3.17 3.50 4.00
3.45 3.78 4.00 4.00
3.43 3.72 4.00 4.00
3.45 3.89 4.00 4.00
3.40 3.78 3.75 4.00
3.43 3.83 4.00 4.00
3.05 3.72 3.75 3.00
3.26 3.67 4.00 3.00
3.40 3.83 4.00 4.00
3.24 3.67 4.00 4.00
2.74 3.17 4.00 2.00
3.00 3.44 4.00 3.00
2.48 3.11 2.50 3.00
2.98 3.39 3.50 3.00
2.86 3.50 3.75 3.00
2.93 3.72 3.75 1.00
2.98 3.50 2.00 2.00
2.38 3.00 1.00 1.00
2.43 3.00 1.00 1.00
2.76 3.17 1.50 1.00
3.48 3.89 4.00 4.00
3.36 3.83 4.00 4.00
2.98 3.56 3.75 4.00
3.31 3.83 3.75 4.00
3.36 3.72 4.00 4.00
3.12 3.56 3.00 4.00
2.88 3.33 3.25 1.00
2.31 2.94 2.75 4.00
3.07 3.50 3.00 4.00
3.17 3.61 4.00 4.00
3.38 3.67 3.75 4.00
3.26 3.67 3.75 4.00
3.00 3.50 2.50 4.00
3.31 3.72 4.00 4.00
2.98 3.61 4.00 4.00
2.38 3.11 2.00 3.00
3.52 3.83 3.75 4.00
3.10 3.61 3.50 2.00
3.19 3.56 3.75 2.00
3.07 3.67 3.00 2.00
3.02 3.56 3.50 2.00
2.33 3.39 2.25 3.00
ANOVA
3.117 3 .272 61 11.463 .000
1.506 3 .351 61 4.289 .008
1.780 3 .171 61 10.396 .000
1.767 3 .545 61 3.241 .028
.920 3 .234 61 3.939 .012
2.351 3 .236 61 9.964 .000
4.664 3 .379 61 12.291 .000
3.128 3 .319 61 9.798 .000
5.386 3 .490 61 10.986 .000
5.310 3 .431 61 12.322 .000
4.140 3 .412 61 10.053 .000
.961 3 .201 61 4.786 .005
2.761 3 .250 61 11.043 .000
2.752 3 .454 61 6.064 .001
.471 3 .225 61 2.092 .111
1.722 3 .211 61 8.143 .000
1.392 3 .224 61 6.211 .001
2.066 3 .177 61 11.686 .000
1.788 3 .171 61 10.467 .000
4.926 3 .334 61 14.757 .000
P2
Mean Square df
Cluster
Mean Square df
Error
F Sig.
Number of Cases in each Cluster
42.000 18.000 4.000 1.000 65.000 .000 1
2 3 4 Cluster
5 klaster
Initial Cluster Centers
4.00 4.00 3.00 4.00 1.00
3.00 2.00 4.00 4.00 4.00
1.00 3.00 4.00 2.00 2.00
2.00 3.00 4.00 2.00 3.00
3.00 4.00 3.00 3.00 4.00
3.00 4.00 4.00 4.00 4.00
4.00 3.00 4.00 4.00 4.00
4.00 4.00 4.00 4.00 4.00
3.00 4.00 3.00 4.00 4.00
4.00 3.00 4.00 4.00 4.00
1.00 3.00 4.00 3.00 3.00
2.00 4.00 4.00 4.00 3.00
3.00 4.00 4.00 4.00 4.00
2.00 4.00 4.00 4.00 4.00
3.00 4.00 4.00 4.00 2.00
3.00 3.00 4.00 4.00 3.00
1.00 3.00 2.00 1.00 3.00
3.00 3.00 4.00 4.00 3.00
3.00 3.00 4.00 4.00 3.00
2.00 2.00 4.00 4.00 1.00
2.00 3.00 3.00 1.00 2.00
1.00 1.00 4.00 1.00 1.00
1.00 2.00 3.00 1.00 1.00
1.00 3.00 3.00 1.00 1.00
3.00 4.00 4.00 4.00 4.00
3.00 3.00 4.00 4.00 4.00
3.00 1.00 4.00 4.00 4.00
2.00 3.00 4.00 4.00 4.00
4.00 4.00 4.00 4.00 4.00
3.00 3.00 4.00 2.00 4.00
2.00 4.00 4.00 3.00 1.00
2.00 3.00 2.00 1.00 4.00
3.00 4.00 4.00 3.00 4.00
4.00 4.00 4.00 4.00 4.00
3.00 4.00 4.00 4.00 4.00
4.00 3.00 4.00 4.00 4.00
2.00 3.00 4.00 1.00 4.00
3.00 4.00 4.00 4.00 4.00
2.00 2.00 4.00 4.00 4.00
2.00 1.00 4.00 1.00 3.00
4.00 4.00 4.00 4.00 4.00
3.00 4.00 4.00 4.00 2.00
4.00 3.00 4.00 4.00 2.00
4.00 3.00 4.00 2.00 2.00
2.00 3.00 4.00 4.00 2.00
3.00 3.00 3.00 1.00 3.00
Iteration Historya
4.801 4.429 3.747 2.828 3.240
.448 .357 .775 .000 .000
.000 .137 .248 .000 .000
.000 .000 .000 .000 .000
Iteration 1 2 3 4
1 2 3 4 5
Change in Cluster Centers
Convergence achieved due to no or small change in cluster centers. The maximum absolute coordinate change for any center is .000. The current iteration is 4. The minimum distance between initial centers is 7.483.
Final Cluster Centers
3.27 3.41 3.72 4.00 1.50
2.82 2.81 3.39 3.50 4.00
2.64 2.66 3.22 1.50 2.00
2.55 2.78 3.44 2.50 2.50
2.64 3.09 3.28 3.50 3.50
3.36 3.53 3.83 4.00 3.00
3.36 3.53 3.72 4.00 3.00
3.36 3.56 3.89 4.00 3.00
3.18 3.50 3.78 4.00 3.50
3.36 3.47 3.83 4.00 4.00
2.73 3.22 3.72 3.50 3.00
2.91 3.44 3.67 4.00 3.00
3.18 3.53 3.83 4.00 3.50
3.00 3.38 3.67 4.00 3.50
2.36 2.91 3.28 4.00 2.00
2.82 3.16 3.44 4.00 2.50
1.91 2.66 3.22 1.50 3.00
2.73 3.09 3.39 3.50 3.00
2.73 2.97 3.50 4.00 2.50
3.00 2.97 3.72 4.00 1.50
2.73 3.13 3.39 1.50 2.00
2.27 2.47 2.83 1.00 1.00
2.00 2.59 2.89 1.00 1.00
2.36 2.94 3.06 1.00 1.50
3.27 3.56 3.89 4.00 4.00
3.18 3.41 3.89 4.00 4.00
2.82 3.03 3.56 4.00 4.00
3.09 3.41 3.83 3.50 4.00
3.09 3.47 3.72 4.00 4.00
3.00 3.16 3.56 2.50 4.00
2.45 3.06 3.39 3.00 1.50
2.09 2.38 3.06 2.50 3.00
2.82 3.13 3.56 2.50 4.00
3.09 3.22 3.67 4.00 3.50
3.00 3.56 3.72 3.50 3.00
3.18 3.34 3.72 3.50 3.00
2.64 3.16 3.56 1.50 3.00
3.00 3.44 3.72 4.00 4.00
2.73 3.06 3.67 4.00 4.00
2.36 2.38 3.06 1.50 3.50
3.55 3.47 3.89 4.00 4.00
3.09 3.13 3.67 3.50 2.00
3.27 3.22 3.61 3.50 2.00
3.27 3.03 3.72 2.50 2.00
3.09 3.03 3.61 3.50 2.00
2.27 2.38 3.39 2.00 2.50
ANOVA
2.655 4 .256 60 10.358 .000
2.075 4 .431 60 4.816 .002
1.580 4 .201 60 7.846 .000
.996 4 .181 60 5.493 .001
1.065 4 .266 60 3.997 .006
.705 4 .316 60 2.229 .076
2.827 4 .228 60 12.372 .000
1.182 4 .291 60 4.057 .006
2.370 4 .234 60 10.118 .000
2.487 4 .433 60 5.742 .001
.666 4 .208 60 3.204 .019
1.788 4 .182 60 9.835 .000
1.354 4 .207 60 6.539 .000
2.431 4 .121 60 20.084 .000
1.782 4 .144 60 12.354 .000
3.670 4 .341 60 10.762 .000
P2
Mean Square df Cluster
Mean Square df Error
F Sig.
Number of Cases in each Cluster
Regresi (BPK) Metode Enter
Variables Entered/Removedb
X12, X9,
All requested variables entered. a.
Dependent Variable: Y b.
Model Summaryb
.422a .178 .089 .522
Std. Error of the Estimate
Predictors: (Constant), X12, X9, X1, X8, X5, X10, X2, X3, X11, X6, X4, X7
a.
Dependent Variable: Y b.
ANOVAb
6.552 12 .546 2.007 .030a
30.190 111 .272
36.742 123
Squares df Mean Square F Sig.
Predictors: (Constant), X12, X9, X1, X8, X5, X10, X2, X3, X11, X6, X4, X7 a.
Coefficientsa
2.041 .473 4.313 .000
.101 .154 .065 .657 .512
-.024 .140 -.027 -.171 .865
-.326 .151 -.367 -2.157 .033
.255 .147 .272 1.734 .086
-.064 .098 -.066 -.652 .516
-.027 .143 -.031 -.189 .851
.177 .143 .211 1.235 .219
.151 .138 .167 1.094 .276
.025 .083 .032 .307 .760
.041 .101 .046 .406 .686
.213 .115 .256 1.859 .066
-.099 .113 -.114 -.873 .385
(Constant)
B Std. Error Unstandardized
Dependent Variable: Y a.
Residuals Statisticsa
2.64 4.06 3.24 .231 124
-2.596 3.558 .000 1.000 124
.066 .301 .157 .062 124
2.28 4.09 3.24 .261 124
-1.14 1.15 .00 .495 124
-2.186 2.198 .000 .950 124
-2.407 2.690 .000 1.016 124
-1.38 1.72 .00 .571 124
-2.462 2.769 .001 1.024 124
.992 39.893 11.903 9.468 124
.000 .277 .013 .030 124
.008 .324 .097 .077 124
Predicted Value Std. Predicted Value Standard Error of Predicted Value
Adjusted Predicted Value Residual
Std. Residual Stud. Residual Deleted Residual Stud. Deleted Residual Mahal. Distance Cook's Distance
Centered Leverage Value
Minimum Maximum Mean Std. Deviation N
Dependent Variable: Y a.
Normal P-P Plot of Regression Stand
Dependent Variable: Y
Observed Cum Prob
1.00 .75
.50 .25 0.00
Expected Cum Prob
1.00
Dependent Variable: Y
Regression Standardized Predicted Value
4
Regression Studentized Deleted (Press) Residual
3
Dependent Variable: Y
Y
Regression Standardized Predicted Value
4
Variables Entered/Removeda
Dependent Variable: Y a.
Model Summaryc
.293a .086 .079 .525
Std. Error of the Estimate
Predictors: (Constant), X8 a.
Predictors: (Constant), X8, X11 b.
Dependent Variable: Y c.
ANOVAc
3.163 1 3.163 11.493 .001a
33.579 122 .275
36.742 123
4.297 2 2.148 8.012 .001b
32.445 121 .268
36.742 123
Squares df Mean Square F Sig.
Predictors: (Constant), X8 a.
Predictors: (Constant), X8, X11 b.
Coefficientsa
2.540 .212 11.965 .000
.266 .078 .293 3.390 .001
2.222 .261 8.528 .000
.228 .080 .252 2.870 .005
.150 .073 .180 2.056 .042
(Constant)
B Std. Error Unstandardized
Dependent Variable: Y a.
Excluded Variablesc
.123a 1.388 .168 .125 .953
Predictors in the Model: (Constant), X8 a.
Predictors in the Model: (Constant), X8, X11 b.
Residuals Statisticsa
2.60 3.74 3.24 .187 124
-3.432 2.644 .000 1.000 124
.055 .168 .076 .026 124
2.55 3.79 3.24 .190 124
-1.21 1.10 .00 .514 124
-2.332 2.123 .000 .992 124
-2.363 2.209 .000 1.005 124
-1.24 1.19 .00 .527 124
-2.409 2.245 .001 1.011 124
.402 11.980 1.984 2.313 124
.000 .134 .009 .016 124
.003 .097 .016 .019 124
Predicted Value Std. Predicted Value Standard Error of Predicted Value
Adjusted Predicted Value Residual
Std. Residual Stud. Residual Deleted Residual Stud. Deleted Residual Mahal. Distance Cook's Distance
Centered Leverage Value
Minimum Maximum Mean Std. Deviation N
Dependent Variable: Y a.
Charts
Normal P-P Plot of Regression Stand
Dependent Variable: Y
Observed Cum Prob
1.00 .75
.50 .25 0.00
Expected Cum Prob
1.00
Dependent Variable: Y
Regression Standardized Predicted Value
3
Regression Studentized Deleted (Press) Residual
Scatterplot
Dependent Variable: Y
Y
Regression Standardized Predicted Value
3
Metode Remove
Warnings
Invalid REGRESSION METHOD subcommand specification--REMOVE cannot be used as the first method when building an equation. REGRESSION has inserted ENTER as the first method; REMOVE is now the second method.
Variables Entered/Removedc
X12, X9,
All requested variables entered. a.
All requested variables removed. b.
Dependent Variable: Y c.
Std. Error of the Estimate
Predictors: (Constant), X12, X9, X1, X8, X5, X10, X2, X3, X11, X6, X4, X7
a.
ANOVAc
6.552 12 .546 2.007 .030a
30.190 111 .272
36.742 123
.000 0 .000 . .b
36.742 123 .299
36.742 123
Squares df Mean Square F Sig.
Predictors: (Constant), X12, X9, X1, X8, X5, X10, X2, X3, X11, X6, X4, X7 a.
Predictor: (constant) b.
Dependent Variable: Y c.
Coefficientsa
2.041 .473 4.313 .000
.101 .154 .065 .657 .512
-.024 .140 -.027 -.171 .865
-.326 .151 -.367 -2.157 .033
.255 .147 .272 1.734 .086
-.064 .098 -.066 -.652 .516
-.027 .143 -.031 -.189 .851
.177 .143 .211 1.235 .219
.151 .138 .167 1.094 .276
.025 .083 .032 .307 .760
.041 .101 .046 .406 .686
.213 .115 .256 1.859 .066
-.099 .113 -.114 -.873 .385
3.242 .049 66.052 .000
(Constant)
B Std. Error Unstandardized
Excluded Variablesb
.181a 2.030 .045 .181 1.000
.158a 1.768 .080 .158 1.000
.118a 1.313 .192 .118 1.000
.249a 2.837 .005 .249 1.000
.099a 1.093 .276 .099 1.000
.253a 2.888 .005 .253 1.000
.270a 3.092 .002 .270 1.000
.293a 3.390 .001 .293 1.000
.145a 1.614 .109 .145 1.000
.146a 1.629 .106 .146 1.000
.238a 2.711 .008 .238 1.000
.152a 1.701 .091 .152 1.000
X1 X2 X3 X4 X5 X6 X7 X8 X9 X10 X11 X12 Model 2
Beta In t Sig.
Partial
Correlation Tolerance Collinearity
Statistics
Predictor: (constant) a.
Metode Backward
Variables Entered/Removed b
X12, X9,
All requested variables entered. a.
Model Summaryj
Std. Error of the Estimate
Predictors: (Constant), X12, X9, X1, X8, X5, X10, X2, X3, X11, X6, X4, X7
a.
Predictors: (Constant), X12, X9, X1, X8, X5, X10, X3, X11, X6, X4, X7
b.
Predictors: (Constant), X12, X1, X8, X5, X10, X3, X11, X6, X4, X7
c.
Predictors: (Constant), X12, X1, X8, X5, X10, X3, X11, X4, X7
d.
Predictors: (Constant), X12, X1, X8, X5, X3, X11, X4, X7 e.
Predictors: (Constant), X12, X1, X8, X3, X11, X4, X7 f.
Predictors: (Constant), X12, X8, X3, X11, X4, X7 g.
Predictors: (Constant), X8, X3, X11, X4, X7 h.
Predictors: (Constant), X3, X11, X4, X7 i.
ANOVAj
6.552 12 .546 2.007 .030a
30.190 111 .272
36.742 123
6.544 11 .595 2.206 .019b
30.198 112 .270
36.742 123
6.523 10 .652 2.439 .011c
30.219 113 .267
36.742 123
6.489 9 .721 2.717 .007d
30.253 114 .265
36.742 123
6.417 8 .802 3.042 .004e
30.325 115 .264
36.742 123
6.341 7 .906 3.456 .002f
30.401 116 .262
36.742 123
6.244 6 1.041 3.993 .001g
30.498 117 .261
36.742 123
6.024 5 1.205 4.628 .001h
30.718 118 .260
36.742 123
5.767 4 1.442 5.539 .000i
30.975 119 .260
36.742 123
Squares df Mean Square F Sig.
Predictors: (Constant), X12, X9, X1, X8, X5, X10, X2, X3, X11, X6, X4, X7 a.
Predictors: (Constant), X12, X9, X1, X8, X5, X10, X3, X11, X6, X4, X7 b.
Predictors: (Constant), X12, X1, X8, X5, X10, X3, X11, X6, X4, X7 c.
Predictors: (Constant), X12, X1, X8, X5, X10, X3, X11, X4, X7 d.
Predictors: (Constant), X12, X1, X8, X5, X3, X11, X4, X7 e.
Predictors: (Constant), X12, X1, X8, X3, X11, X4, X7 f.
Predictors: (Constant), X12, X8, X3, X11, X4, X7 g.
Predictors: (Constant), X8, X3, X11, X4, X7 h.
Predictors: (Constant), X3, X11, X4, X7 i.
Coefficients a
2.041 .473 4.313 .000
.101 .154 .065 .657 .512
-.024 .140 -.027 -.171 .865 -.326 .151 -.367 -2.157 .033
.255 .147 .272 1.734 .086
-.064 .098 -.066 -.652 .516 -.027 .143 -.031 -.189 .851
.177 .143 .211 1.235 .219
.151 .138 .167 1.094 .276
.025 .083 .032 .307 .760
.041 .101 .046 .406 .686
.213 .115 .256 1.859 .066
-.099 .113 -.114 -.873 .385
2.049 .469 4.368 .000
.099 .153 .063 .648 .518
-.336 .138 -.379 -2.443 .016
.253 .146 .270 1.734 .086
-.065 .098 -.067 -.664 .508 -.041 .114 -.048 -.363 .718
.183 .139 .218 1.313 .192
.154 .136 .170 1.133 .260
.022 .080 .027 .275 .784
.042 .100 .048 .423 .673
.214 .114 .258 1.877 .063
-.103 .111 -.119 -.928 .355
2.067 .463 4.468 .000
.100 .152 .064 .659 .511
-.337 .137 -.379 -2.456 .016
.252 .146 .269 1.734 .086
-.061 .096 -.062 -.631 .530 -.041 .114 -.047 -.360 .719
.186 .138 .222 1.345 .181
.156 .135 .172 1.148 .253
.050 .096 .056 .515 .607
.219 .112 .264 1.955 .053
-.108 .108 -.125 -1.000 .320
2.073 .461 4.500 .000
.099 .152 .063 .655 .514
-.329 .135 -.370 -2.439 .016
.246 .144 .262 1.709 .090
-.064 .095 -.066 -.674 .501
.167 .127 .199 1.311 .192
.149 .134 .164 1.113 .268
.050 .096 .056 .520 .604
.205 .105 .247 1.960 .052
-.105 .108 -.122 -.977 .330
2.124 .449 4.732 .000
.102 .151 .065 .678 .499
-.336 .134 -.378 -2.514 .013
.242 .143 .258 1.691 .094
-.048 .090 -.050 -.538 .591
.171 .126 .204 1.353 .179
.144 .133 .159 1.082 .281
.220 .100 .265 2.192 .030
-.093 .105 -.108 -.890 .375
2.050 .426 4.812 .000
.090 .149 .058 .606 .546
-.332 .133 -.374 -2.495 .014
.248 .142 .264 1.738 .085
.165 .126 .197 1.314 .191
.132 .131 .145 1.009 .315
.211 .099 .254 2.140 .034
-.089 .104 -.102 -.850 .397
2.247 .274 8.195 .000
-.330 .133 -.372 -2.489 .014
.260 .141 .277 1.846 .067
.172 .125 .205 1.380 .170
.126 .130 .139 .970 .334
.229 .094 .275 2.430 .017
-.095 .103 -.110 -.919 .360
2.210 .271 8.153 .000
-.335 .132 -.377 -2.530 .013
.246 .140 .263 1.763 .080
.155 .123 .185 1.261 .210
.129 .130 .142 .994 .322
.179 .077 .216 2.323 .022
2.268 .265 8.562 .000
-.356 .131 -.401 -2.721 .007
.311 .124 .331 2.509 .013
.223 .103 .266 2.170 .032
.175 .077 .210 2.267 .025
(Constant)
B Std. Error Unstandardized
Excluded Variablesi
Predictors in the Model: (Constant), X12, X9, X1, X8, X5, X10, X3, X11, X6, X4, X7 a.
Predictors in the Model: (Constant), X12, X1, X8, X5, X10, X3, X11, X6, X4, X7 b.
Predictors in the Model: (Constant), X12, X1, X8, X5, X10, X3, X11, X4, X7 c.
Predictors in the Model: (Constant), X12, X1, X8, X5, X3, X11, X4, X7 d.
Predictors in the Model: (Constant), X12, X1, X8, X3, X11, X4, X7 e.
Predictors in the Model: (Constant), X12, X8, X3, X11, X4, X7 f.
Predictors in the Model: (Constant), X8, X3, X11, X4, X7 g.
Predictors in the Model: (Constant), X3, X11, X4, X7 h.
Residuals Statisticsa
2.62 4.04 3.24 .217 124
-2.882 3.663 .000 1.000 124
.056 .233 .095 .039 124
2.57 4.04 3.24 .222 124
-1.10 1.07 .00 .502 124
-2.163 2.106 .000 .984 124
-2.208 2.188 -.001 1.003 124
-1.15 1.16 .00 .522 124
-2.245 2.224 .000 1.009 124
.471 24.558 3.968 4.139 124
.000 .076 .008 .013 124
.004 .200 .032 .034 124
Predicted Value Std. Predicted Value Standard Error of Predicted Value
Adjusted Predicted Value Residual
Std. Residual Stud. Residual Deleted Residual Stud. Deleted Residual Mahal. Distance Cook's Distance
Centered Leverage Value
Minimum Maximum Mean Std. Deviation N
Dependent Variable: Y a.
Charts
Normal P-P Plot of Regression Stand
Dependent Variable: Y
Observed Cum Prob
1.00 .75
.50 .25 0.00
Expected Cum Prob
1.00
Dependent Variable: Y
Regression Standardized Predicted Value
4
Regression Studentized Deleted (Press) Residual
Scatterplot
Dependent Variable: Y
Y
4.5 4.0
3.5 3.0
2.5 2.0
1.5
Regression Standardized Predicted Value
Metode Forward
Variables Entered/Removeda
X8 .
Dependent Variable: Y a.
Model Summaryc
.293a .086 .079 .525
Std. Error of the Estimate
Predictors: (Constant), X8 a.
Predictors: (Constant), X8, X11 b.
Dependent Variable: Y c.
ANOVAc
3.163 1 3.163 11.493 .001a
33.579 122 .275
36.742 123
4.297 2 2.148 8.012 .001b
32.445 121 .268
36.742 123
Squares df Mean Square F Sig.
Predictors: (Constant), X8 a.
Predictors: (Constant), X8, X11 b.
Coefficientsa
2.540 .212 11.965 .000
.266 .078 .293 3.390 .001
2.222 .261 8.528 .000
.228 .080 .252 2.870 .005
.150 .073 .180 2.056 .042
(Constant)
B Std. Error Unstandardized
Dependent Variable: Y a.
Excluded Variablesc
.123a 1.388 .168 .125 .953
Predictors in the Model: (Constant), X8 a.
Predictors in the Model: (Constant), X8, X11 b.
Residuals Statisticsa
2.60 3.74 3.24 .187 124
-3.432 2.644 .000 1.000 124
.055 .168 .076 .026 124
2.55 3.79 3.24 .190 124
-1.21 1.10 .00 .514 124
-2.332 2.123 .000 .992 124
-2.363 2.209 .000 1.005 124
-1.24 1.19 .00 .527 124
-2.409 2.245 .001 1.011 124
.402 11.980 1.984 2.313 124
.000 .134 .009 .016 124
.003 .097 .016 .019 124
Predicted Value Std. Predicted Value Standard Error of Predicted Value
Adjusted Predicted Value Residual
Std. Residual Stud. Residual Deleted Residual Stud. Deleted Residual Mahal. Distance Cook's Distance
Centered Leverage Value
Minimum Maximum Mean Std. Deviation N
Dependent Variable: Y a.
Charts
Normal P-P Plot of Regression Stand
Dependent Variable: Y
Observed Cum Prob
1.00 .75
.50 .25 0.00
Expected Cum Prob
1.00
Dependent Variable: Y
Regression Standardized Predicted Value
3
Regression Studentized Deleted (Press) Residual
Scatterplot
Dependent Variable: Y
Y
4.5 4.0
3.5 3.0
2.5 2.0
1.5
Regression Standardized Predicted Value
Regresi (Aloysius)
Metode Enter
Variables Entered/Removedb
X12, X1,
All requested variables entered. a.
Dependent Variable: Y b.
Model Summaryb
.850a .723 .578 .380
Std. Error of the Estimate
Predictors: (Constant), X12, X1, X4, X11, X2, X7, X8, X3, X5, X10, X6
a.
Dependent Variable: Y b.
ANOVAb
7.930 11 .721 4.980 .001a
3.040 21 .145
10.970 32
Squares df Mean Square F Sig.
Predictors: (Constant), X12, X1, X4, X11, X2, X7, X8, X3, X5, X10, X6 a.
Dependent Variable: Y b.
Coefficientsa
-.614 .666 -.923 .366
1.279 .408 .840 3.132 .005
.422 .260 .443 1.624 .119
.069 .270 .062 .255 .801
-.240 .228 -.214 -1.055 .304
-.049 .198 -.060 -.246 .808
-.316 .267 -.334 -1.185 .249
-.031 .313 -.025 -.100 .922
.170 .204 .189 .835 .413
-.049 .277 -.049 -.178 .860
-.028 .220 -.036 -.127 .900
.017 .204 .017 .081 .936
(Constant)
B Std. Error Unstandardized
Residuals Statisticsa
1.63 4.22 2.97 .498 33
-2.684 2.515 .000 1.000 33
.108 .328 .219 .071 33
1.61 4.64 3.03 .632 33
-.63 .88 .00 .308 33
-1.665 2.319 .000 .810 33
-2.146 2.419 -.050 1.020 33
-1.30 1.23 -.06 .538 33
-2.370 2.780 -.030 1.120 33
1.617 22.842 10.667 6.532 33
.000 .711 .079 .169 33
.051 .714 .333 .204 33
Predicted Value Std. Predicted Value Standard Error of Predicted Value
Adjusted Predicted Value Residual
Std. Residual Stud. Residual Deleted Residual Stud. Deleted Residual Mahal. Distance Cook's Distance
Centered Leverage Value
Minimum Maximum Mean Std. Deviation N