Available Online Version: http://jurnal.buddhidharma.ac.id/index.php/te
JURNAL TECH-E
| 2581-1916 (Online)| 2598-7585 (Cetak) |
Artikel
Data Mining Implementation on Choosing Potential
Customers Using K
-
Means Algorithm on PT. Koba
Metal Indonesia
Sandi Kristianto1, Yusuf Kurnia2
1Universitas Buddhi Dharma, Teknik Informatika, Banten, Indonesia 2Universitas Buddhi Dharma, Teknik Informatika, Banten, Indonesia
SUBMISSIONTRACK A B S T R A C T
Received : February 1, 2018 Final Revision: February 6, 2018 Available Online: February 27, 2018
PT. Koba metal Indonesia. is one of roll-reforming cooperations who produce light-steel stuffs which is growing rapidly nowadays. One of the important thing in customer management is how a cooperation be able to preserve their customers. the effort of preserving customers becomes important for PT. Koba metal Indonesia. considering of plenty companies who commits at the same sector. To prevent the displacement of customers, knowing the potential group of customers is important, so that the company could preserve those potential customers by giving excellent service, etc. the implication of data mining could assist the company to analize the received data from sales transaction to gain potential customers data. Therefore, a designed application which could implement the data mining for choosing potential customers by clustering and algorithm K-means method is arranged. Then, the information performes with groups who is categorized into potential customers. Besides, rapminder
application is also used to examine the data’s accuracy of this built application design. Hereinafter, this application design is expected to assist companies to choose their potential customers and preserve them to advance their business. KEYWORD
Potential Customers, Data Mining, Clustering, K-Means, Rapidminer. preserve their owned customers. In this case, PT. Koba metal Indonesia. as a roll-forming cooperate or the proses of building light-steel
Indonesia. is one of the companies that realize the importance of the connection between
loyal customers and the success of company’s
business.
I. METHODS
K-means is an algorithm that be used in partial classification that separate datas into different groups. This algorithm is able to minimalize the gap between data to its cluster. Basically, the application of this algorithm in the clustering process depends on the received datas and the conclusions that expected to be achieved in the end of the process. So in k-means algorithm application, there are precepts, such as:
a. How many clusters that needed to be inserted.
b. Only have numeric type attribute.
Basically k-means algorithm only takes a piece of those plenty components that is received to become the center of the beginning cluster. After that, the k-means algorithm will examine each of the component in that data population and mark that component into one of defined cluster center depend on the minimum gap between
cluster’s center to another center. After that, the cluster’s center’s position will be counted
until all of the data components is classified into each of clusters and at last, new cluster will be built.
Data mining is a data analyse to discover an obvious relation and conclude the unknown with the current method that useful and understood by the owner.
Clustering or classifying is a method that is used to divide data circuits into some groups based on their similarity which has determined before. Cluster is a group of similar data in the same, cluster, and
dissimilar to other cluster’s object. Object will
be classified into one or more clusters, so that objects in a cluster have substantial similarity between one and another.
II. RESULTS
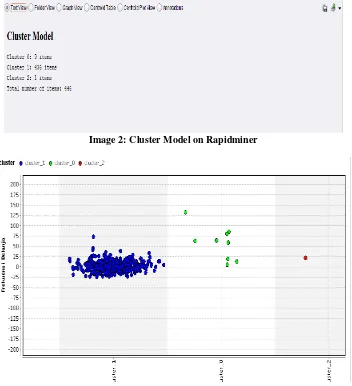
The image below is an applied k-means
algorithm method’s layout on rapidminer.
This process starts in Read excel step, which is an excel files in clustering data are processed with k-means algorithm, after that, these datas will be on apply model stage, to adjust these k-means algorithm clusterised data to enter performance stage. On performance stage, these datas will be processed to produce PerformaceVector, cluster model, and example set output.
Image 2: Cluster Model on Rapidminer
Gambar 3: K-Means Diagram on Rapidminer
Table 1. Comparison Value on 3 Algorithm Methods
These variables consist of 3 fuzzy compilations, such as low, medium, and high, which is showed on image 2 and 3. Each of
compilation’s affliation’s functions are formulated as follows: Based on table above, can be known that Naïve Bayes accuracy value is 90.06%, 84,30% for C4.5, and 93% for K-Means. These 3 methods above
examine PT. Kobe metal Indonesia.’s sales
data. For K-Means accuracy value is obtained
by manual calculation with the formula as follows:
From algorithm k-means process’ result’s data, could be indicated 9 on potential customer category, 1 for less potential customers, and 436 for not potential customers. Compared with the raw data (have not been processed with k-means algorithm) has been predicted 16 potential customers, 20 less potential customers, and 410 not potential customers. These type of data later gained the values that will be used to count the accuracy value, as the table follows:
Table 2. Accuracy Point
III. DISCUSSION
Decision making is started by cluster determination stage, which is done based on the aim of data mining process. On this case, data that is aimed to be generated is potential
customer’s data, with 3 categories, such as
potential, less potential, and not potential. Can be concluded that the built clusters are 3/c=3. the cluster central point could be decided independently or by find out the hight value (c1), average value(c2), and lowest value (c3). Here is data example with 40 datas taken.
Table 3. Sales Data Sample on PT. KMI
Cluster center point:
C1=highest value (shopping frequency, total expenditure)
C2=average value (shopping frequency, total expenditure)
C2=(3.15,20078664)
C3=lowest value (shopping frequency, total expenditure)
C3=(1,256250)
Calculate the gap between data to cluster central point.
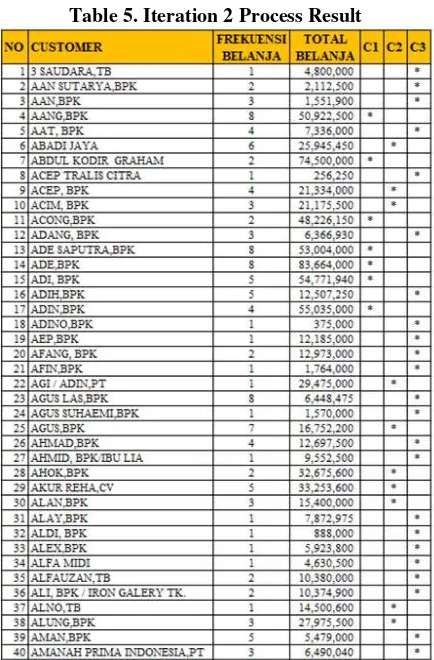
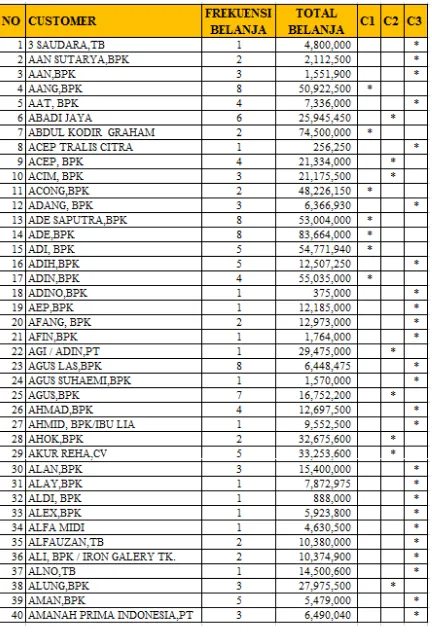
Table 4. Iteration 1 Process Result
Calculate the cluster center again with the
current cluster’s membership. The new
cluster center is the average of all datas/objects in certain group.
Finding the new C1
So the new C1 center is = 5.4,64194988
So the new C3 center is = 2.2,4318698.24 After getting the new cluster result, count the
gap between data and the new cluster center’s
point, and categorize again the cluster. Repeat those stage all over again until cluster’s position on the cluster grouping stage will not change anymore.
Table 7. Iteration 4 Process Result
Because on the 3rd and the 4th iteration has no change of the cluster postion, then the process is stopped. It is known that on the 4th iteration,
cluster 1 central point is on (5.3,60017656). So that could be cluster central point
concluded that cluster 1’s customers are potential customers, for cluster 2’s central
point is on (3.9,26073356) categorized as less
potential customers, and for the cluster 3’s
central point is on (2.3,6977445) categorized as not potential customers.
IV. CONCLUSION
Based on the research that has been done, it can be concluded as follows:
1. Agglomeration of the kmi co.’s sales data could be done by clustering model, with agglomerating those datas into categories
basen on data’s similarity in a category.
2. To get potential customers data by k-means algorithm is done by these stages as follows:
a. Decide the cluster’s amount. b. Decide the cluster’s center point. c. Calculate the gap between data to
cluster’s center point.
d. Agglomerate data into clusters depend on the shortest gap or the smallest.
e. Repeat step b-d, and compare the data position on every result. If the data position changes, repeat step b-d all over again. If the position co not change anymoe, the process is done.
f. The potential customer
determination is seen by the
biggest cluster’s center poin from
the built on the last stage when the data position on the cluster stays still.
REFERENCES
Aji Supriyanto, “Pengantar teknologi Informasi”, Jakarta: Salemba Infotek,2005.
Amstrong, Gary & Philip, Kotler. 2002. Dasar-dasar Pemasaran. Jilid 1, Alih Bahasa Alexander Sindoro dan Benyamin Molan. Jakarta: Penerbit Prenhalindo.
Andayani, Sri. (2007). Pembentukan cluster dalam Knowledge Discovery in Database dengan Algoritma K‐Means. Jurnal, semnasIF 2007. Yogyakarta: Fakultas Matematika dan Pendidikan Matematika Universitas Negeri Yogyakarta.
Binanto, Iwan (2010). Multimedia Digital - Dasar Teori dan Pengembangannya. Yogyakarta. Blattberg, Robert C., Getz, Gary, Thomas, Jacquelyn S. (2001). Customer Equity: Building and
Managing Relationships as Valuable Assets. Harvard Business Scholl Publishing.
Connolly, Thomas and Begg, Carolyn, 2010, Database Systems: A Practical Approach to Design, Implementation, and Management, Fifth Edition. Pearson Education, Boston.
Davis Kadir. (2003). Informasi Komputer. Andi Offset, Yogyakarta.
Gregory M. Scott, 1986, Prcinciples of Management Information Systems, McGraw-Hill, New York.
Han, Jiawei dan Kamber, Micheline. (2006), Data Mining : Concept and Techniques Second Edition, Morgan Kaufmann Publishers.
Harip Santoso. 2004. Membuat Aplikasi Menggunakan Visual Basic 6.0. PT Elex Media Komputindo. Jakarta.
Hoffer, Jeffrey A., Prescott Mary B., Mcfadden, Fred R. 2007. Modern Database Management. New Jersey : Pearson Prentice Hall.
Indonesian Registrant Domain and WebHosting. (2013, 22 Maret). Info Pengertian Dari PHP. Diperoleh pada 26 Maret 2014, dari http://www.idreg.net/pengertian-dari-php.
John Burch dan Gary Grudnitski, 1986, Information Systems Theory and Practice, John Wiley and Sons, New York.
Kristanto, A. (2008). Perancangan Sistem Informasi dan Aplikasinya. Yogyakarta: Gava Media. Kurgan, L., and Musilek, P. 2006. A survey of knowledge discovery and data mining process
models. Knowledge Engineering Review, 21(1):1–24.
Mariscal, Marba’n dan Ferna’ndes.2010. A Survey Of Data Mining And Knowledge Discovery
Models And Methodologies. The Knowledge Engineering Review, 25(2), 137-166.
http://dx.doi.org.
Pressman, Roger S. (2005). Software Engineering A Practitioner's Approach. Sixth Edition. New York: McGraw-Hill.
Plaisant, S. B. (2005). Designing the user interface 4th Edition : strategies for effective human-computer interaction. England: Pearson Addison Wesley Publishing Company Inc.
Robert J. Verzello dan John Reuter III, (1982), “Data Processing: Systems and Concepts”, Tokyo:
Mc Graw-Hill Kogakusha, Ltd.
Santoso, Insap (2010). Interaksi Manusia dan Komputer Edisi 2. Yogyakarta: Andi Publisher
S. Agustina, D. Yhudo, H. Santoso, N. Marnasusanto, A. Tirtana dan F. Khusnu, “Clustering
Kualitas Beras Berdasarkan Ciri Fisik Menggunakan Metode K-Means,” Universitas Brawijaya Malang, Malang, 2012.
Universitas Brawijaya. (2013, 26 Februari). Pengertian dari OOP, Class, Method, Behavior dan Constructor. Diperoleh pada 26 Maret 2014, dari http://blog.ub.ac.id/home/pengertian-dari-oop-class-method-behavior-dan-constructor/comment-page-1.
Widodo, Prabowo.P,Dkk, 2011, Pemodelan Sistem Berorientasi Obyek A. Dengan UML, Graha ilmu, Yogyakarta.
BIOGRAPHY
Sandi Kristianto - Bachelor of Computer Science (S1) Informatic Engineering (Database), 2017. working at PT. Koba Metal Indonesia.