THE ROLE OF FINANCIAL
MANAGEMENT
Dr. H. Mustika Lukman Arief, SE, MM.
THE ROLE OF FINANCIAL
MANAGEMENT
.
•
Apa itu manajemen keuangan….?
Manajemen Keuangan meliputi semua
aktivitas yang berhubungan dengan
usaha
mendapatkan
dana
yang
dibutuhkan
perusahaan
serta
mengggunakan
dan/mengalokasikan
Manajemen keuangan digunakan
untuk menjawab pertanyaan:
1. What long-term investments should
the frma engage in?
2. How can the frm raise the money
for the required investments?
The Role of The Financial Manager
Capital Budgeting decision
decision to in tangible or intangible assets also called the
investment decision
Financing decision
raising money that the firm needs for its
investments and operations
Capital structure
Untuk kebijakan fungsi tersebut, ada 3
keputusan yang perlu diambil
1. Keputusan investasi
2. Keputusan Pendanaan
3. Kebijkan Dividen
Tujuan Perusahaan
Dalam pengertian mikroekonomi disebut bahwa tujuan perusahaan
adalah memaksimalkan keuntungan. Namun ditinjau dari sudut
keuangan tujuan ini mengabaikan berbagai kerumitan yang ada
dalam praktek pengambilan keputusan sehari-hari
Kelemahan Maksimalisasi Keuntungan:
1. Tidak mengaitkan besarnya keuntungan yang dihasilkan denga
waktu perolehannya
2. Tidak memperhatikan masalah waktu dan ketidakpastian
3. Mengabikan lamanya waktu pengembalian
Tujuan Perusahaan
Tujuan perusahaan
adalah memaksimalkan kekayaan
pemegang saham dengan cara memaksimalkan nilai
perusahaan
‘Basic goal: Maximize stockholder value’
indikatornya
- Firm’s value yang maksimal
- Stock price yang maksimal
Nilai perusahaan dicerminkan oleh harga pasar saham
Mengapa harga pasar saham mencerminkan nilai
Tujuan manajemen
Keuangan
mempelajari dan memahami bagaimana
upaya perusahaan dalam memaksimalkan nilai
perusahaannya (Value of the frm) memalui 3
macam keputusan yaitu: keputusan investasi,
keputusan pendaaan, kebijakan dividen.
Vf = f (I, F, D)
Vf = value of the firm (nilai perusahaan)
I = Investment Decision F = Financial Decision
.
The Objektive FunctionMaximime the Value of the frm
The Objektive Function
Maximime the Value of the frm
Basic corporation fnancial decision
1. How do you allocate resources across competing uses?
2. How do you raise founds to fnance the projects?
3. How much do you reinvest back into the business and how much do you return to you stockholders?
Basic corporation fnancial decision
1. How do you allocate resources across competing uses?
2. How do you raise founds to fnance the projects?
3. How much do you reinvest back into the business and how much do you return to you stockholders?
Aksioma-aksioma yang diperlukan
untuk memahami Manajemen
Keuangan
Aksioma
1
Keseimbangan risiko dan
pengembalian (the risk-return
tradeoff
Jangan menambahkan risiko
kecuali mendapatkan kompensasi
tambahan pendapatan
Aksioma
2
Nilai waktu uang (time value of
moneyf-uang yang diterima
ssekarang lebih berharga dari uang
yang diterima kemudian
Aksioma
Lanjutan…
Aksioma 4
Tambahan Arus Kas (Increment Cash Flow) satu-satunya
pertambahan nilai yang dihitung
Aksioma 5
Kondisi persaingan pasar-alasan kenapa sangat sulit mendapatkan
laba yang luar biasa
Aksioma 6
Pasar modal yang efesien-pasar yang bergerak cepat dan harga
yang tepat
Aksioma 7
Masalah keagenan-manajer tidak akan bekerja bagi pemilik
perusahaan jika tidak selaras dengan kepentingan mereka
Aksioma 8
Perpajakan yang berdampak pada keputusan bisnis
Aksioma 9
Tidak semua risiko sama, ada sebagian risiko yangd dapat
didiversifikasi
What is a Corporation?
Types of Corporations
Public Companies
Private Corporations
Organizing a Business
Types of Business Organizations
Sole Proprietorships
Partnerships
Corporations
Question
1. Why should a company concetrate primarily on
wealth maximization instead of proft maximization?
2. What are the three types of fnancial management
decisions? For each type of decision, give an
example of the business transaction that would be
relevant.
3. Firms often involve themselves in projects that do
not result directly in profts: for example, IBM and
Mobil Oil frequently support public television
Case
In early 2001, Doc and Lyn McGee formed the McGee Company. The company produced a full line of cakes, and its specialties included chess cake, le,on pound cake, and double-iced, double-chocolate cake. The couple formed the company as an outside interest, and both continued to marketing and distribution. With good product qualty and sound marketing plan, the company grew rapidly. In early 2006, the company was featured in a widely distributed entrepreneurial magazine. Later that year, the company was featured in Gourmet Desserts, sales exploded, and the company began receiving orders from all over the world.
Doc and Lyn have operated as a sole
proprietorship. They have approached you to
help manage direct the company’s growth.
Specifcally, they have asked you to answer the
following questions:
1. What are the advantages and disadvantages of
changing the company organization from a sole
proprietorship to an Limited Liabilities Company
(LLC)?
2. What are the advantages and disdvantages of
changing the company organization from a sole
proprietorship to a corporation?
Financial Statement
Analysis
Financial analysis can be defned as the
process of assessing the fnancial
condition of a frm
Basic Fianancial Statements
Balanced Sheet
The Balance Sheet
Defnition
fnancial statements that show the
value of the frms’s assets and
The Income Statement
Defnition
Financial statement that shows
the revenues, expenses, and net
income of a frm over a period of
time
(from
an
accounting
Why Evaluate Financial Statements?
•
Internal uses
- Performance evaluation-compensation and
comparison between divisions
- Planning for the future-guide in estimating
future cash fows
•
External uses
- Creditors
- Suppliers
- Custolers
Financial Ratio
•
The principal analytical tool of the
fnancial analyst is the fnancial ratio
•
Financial ratios help us identify some
of the fnancial strengths and
weaknesses of a company
•
The ratios give us a way of making
Categori of Financial Ratios
•
Short-term solvency or liquidity ratios
•
Long-term solvency or fnancial
leverage ratios
•
Asset management or turnever ratios
•
Proftability ratios
Liquidity Ratios
Quick ratio = current assets -
inventorie s
Current liabilitie s
Current ratio = current
assets
current liabilities
Cash ratio = cash + marketable
securities
Long-term solvency or fnancial
Debt/equity ratio = Total debt
equity
Asset management or turnover
ratios
Receivable turnover ratio = Sales
Receivable
Day’s sales in receivable = 365
Receivables turnover
Inventory turnover ratio = cost of goods sold
Inventory
Day’s sales in inventory = inventory
Asset management or turnover
ratios
Fixed asset turnover ratio = Sales
Net fxed assets
Total asset turn over= Sales
Total assets
NWC Turnover = Sales/NCW
Proftability ratios
Net proft margin = net income
Sales
Return on asset (ROA) = net Income
Total
Market value ratios
•
PE Ratio = Price per share/Earnings
per share
•
Market-to-book ratio = market value
Sample Income Statement
Numbers in millions, except EPS & DPS
Liquidity Ratios
1. Current Ratio = CA/CL
- 2256/1995= 1.13 times
2. Quick Ratio = (CA-Inventory)/CL
- (2256-604)/1995 = 83 times
3. Cash Ratio = Cash/CL
-696/1995 = 35 times
1. Current Ratio = CA/CL
- 2256/1995= 1.13 times
2. Quick Ratio = (CA-Inventory)/CL
- (2256-604)/1995 = 83 times
3. Cash Ratio = Cash/CL
Long-term Solvency ratios
•
Total Debt Ratio = (TA – TE)/ TA
- (5394 – 2556)/5394=52.61%
•
Debt/Equity = TD/TE
- (5394-2556)/2556= 1.11 times
•
Equity Multiplier = TA/TE = 1+D/E
- 1=1.11= 2.11
•
Long-term debt ratio = LTD/(LTD=TE)
- 843/(843=2556)= 24.80%
Asset management or turnover
ratios
Computing Receivables ratios
•
Receivables Turnover=
Sales/Accounts= Receivable
- 5000/956= 5. 23 times
•
Days’ Sales in receivables = 365/
Asset management or turnover
ratios
Computing Inventory ratios
•
Inventory Turnover = Cost of Goods
Sold/Inventory
- 2006/301= 6.66 times
•
Days’ Sales in Inventory =
Asset management or turnover
ratios
Computing Inventory ratios
•
Total Asset Turnover= sales/Total Assets
- 5000/5394= 93
- it is not unusual for TAT <1, especially if
a frm has a large amount of fxed assets
•
NWC Turnover = Sales/NWC
- 5000/(2256-1995)= 19.16 times
•
Fixed Asset Turnover= Sales/NFA
Proftability Measures
•
Proft Margin= Net Income/Sales
- 689/5000= 13.78%
•
Return on Assets (ROA) = Net
Income/Total Assets
- 689/5394 = 12.77%
•
Return on Equity (REO) = Net
Computing Market Value
Measures
•
Market Price = $ 87.65 per share
•
Shares outstanding = 190.9 million
•
PER ratio = Price per share/Earnings
per share
- 87.65/3.61 = 24.28 times
•
Market-to-book ratio = market value
per share/book value per share
Harley-Davidson, Inc. Ratio Analysis
1. Liquidity ratios 2002 2003 Average industries
Using the DuPont Identity
ROE = PM * TAT * EM
ROE = Net Income/sales x sales/assets x
assets/Equity
-
Proft margin is a measure of the frm’s operating
efciensy
- how well does it control costs
- total asset turnover is a measure of the frm’s asset use
efciency-how well does it manage its assets
Expanded Dupont
Analysis-Aeropostale data
•
Balance Sheet Data • income Statement Data
- cash= 138,356 - Sales= 734,868
- inventory= 61,807 - COGS+ 505,152
- other CA = 12,284 - SG&A = 141,520
- fxed assets = 94, 601 - interest = (760)
- equity = 185, 640 - taxes = 34, 702
.
ROE = net income x sales x assets
sales assets equty
= 54,254 x 734, 868 x 307, 048
734,868 307,048 185, 640
= 07383 x 2.3933 x 1.6540
•
As we study the fgure, we quickly see that
improvement in the ROE can common in one or more
of four ways:
1. Increase sales without a disproportionate increase in cost
and expenses
2. Reduce COSGS or operating expences
3. Increase the sales relative to the asset base, either by
increasing sales or by reducing the amounts invesred in
company assets. From our earlier exammination of
Harley-Davidson, we learned that the frm had excessive account
receivables and fxed assets. Thus management need to
reduce these assets to the lowest in the return on which
would in turn result in an increase in the return on assets
and then the return on equity
Limitations of ratio analysis
1. It is sometimes dincult to identify the industry category
to which a frm belongs when the frm enganges in
multiple line of business
2. Published industry averages are only approximations
and provide the user with general guidelines rather than
scientifcally determoned averages of the ratios of all or
even a representative sample of the frms within an
industry
3. Accounting practice diner widely among frms and can
lead to dinerences in computed ratio
4. An industry average may not provide a desirable target
ratio or norm
Case
Chris was recently hired by S&S Air, Inc., to assist the
company with its fnancial planning and to evaluate the
company’s performance. Chris graduated from college fve
years ago with a fnance degree. He has been employed in
the fnance departement of a fortune 500 company since
then.
.
Although the company manufactures aircraft, its
operations are dinerent from commercial aircraft
companies S&S Air builds aircraft to oredr. By using
prefabricated parts, the company can complete the
manufacture of an airplane in only fve weeks. The
company also receives a deposit on each order, as well
as another partial payment before the order is
complete. In contras, a commersial air plane may take
one and one-half to two years to manufacture once the
order is placed
Light Airplane Industri ratios
Lower Median Upper
1 Current ratio 0.50 1.43 1.89
2 Quick ratio 0.21 0.38 0.62
3 Cash ratio 0.08 0.21 0.39
4 Total Assets turnover 0.68 0.85 1.38
5 Inventory turnover 4.89 6.85 10.89
6 Receivables turnover 6.27 9.82 14.11
7 Total debt 0.44 0.52 0.61
8 Debt-Equity ratio 0.79 1.08 1.56
9 Equity multiplier 1.79 2.08 2.56
10 Time interest earned 5.18 8.06 9.83
11 Proft margin 4.05% 6.98% 9.87%
12 Return on assets 6.05% 10.53% 13.21%
Question
1. Using the fnancial statements provided for S&S
Air, calculate each of the ratios listed in the table
for the light aircraft industry.
2. Compare the performance of S&S Air to the
TIME VALUE OF MONEY
•
Future Value-Taking an amout and
fnding its value at sometime in the
future
•
Present Value-Taking an anmout from
Future Values
Future Value – Amount to which an
invenstement will grow after earning interest
Compound Interest – Interest earned on
interest.
Future Values
Example – Simple Interest
Interest earned at a rate of 6% for fve years on a
principal balance of $100
Today Future Years
1 2 3 4
5
Interest earned
Value 100 6 6 6 6 6
106 112 118 124 130
Future Values
Example – Compound Interest
Interest earned at a rate of 6% for fve years on the
previous year’s balance
Today Future Years
1 2 3 4 5
Interest earned
Value 100 6 6.36 6.74 7.15 7.57
106 112.36 119.10 126.25 133.82Future Values
Example-FV
1. What is the future value of$100 if interest is
compounded annually at a rate 6% for fve years?
FV = $100 x (1+.06)
5= $133.82
2. What is the future value of $100 invested for fve
years at a nominal interest rate 12%,
compounded continuosly?
FV =
Compounding Periods
Compounding an investment
m
times a years for
T
years provides for future value of wealth:
FV = C
ofor example, if you
$50 for years at 12%
compounded semi-annually, your investment will
grow to
FV
=
6Enective Interest Rates
ren= (1+r/m)
m- 1Ren= (1+0,12/2)2- 1 = 12,36%
Continuous Compounding :
ren = e
m- 1Dampak dari periode pemajemukan yang berbeda atas nilai masa
depan $1.000, diinvestasikan dengan tingkat bunga nominal 8%
Jumlah Periode
Pemajemukan pada akhir 1 thFuture value tahunan efektifTingkat bunga
$1.000 Tahunan $1.080,00 8,00%
$1.000 Semi tahunan $1.081,60 8,16%
$1.000 4 bulanan $1.082,43 8,24%
$1.000 Bulanan $1.083,00 8,30%
$1.000 Harian $1.083,28 8,32%
How Long is the wait?
If we deposit $5,000 today in an account paying 10% how long
does it take to grow to $10,000?
FV = C
ox
(1+
r
)
T$10,000=$5,000x(1.10)
T(1.10)
T =$10,000 = 2
$5,000
ln(
1.10)
T =ln 2
What Rate Is Enough?
Assume the total cost of a college education will be
$50,000 when your child enters college in 12 years. You
have $50,000 to invest today. What rate of interest must
you earn on your investment to cover the cost of your
child’s education ? About 21.15%
FV = C
ox
(1+
r
)
T$50,000=$5,000 x (1.
r
)
12(1.
r
)
12=$50,000=10 (1+
r
)10
1/12$5,000
.
What is the future value three years hence of $1.000
invested in an account with a stated annual interest rate of
8%
a.
Compounded annually
b.
Compounded semiannually
c.
Compounded monthly
Present Values
Present Value
Value today of a
future cash
fow.
Discount factor
Present value of
a $1 future
payment.
Discount Rate
Interest rate used
to compute prent
TIMES VALUE OF MONEY
(APPLICATIONS)
The PV formula has many application, you can
solve for the remaining variable.
What is the present value of $ 100 to be received in 3 years if the
appropriate interest rate 1s 10%, 15%, and 20%
PV = $100 x 1/(1,1)
3= $75,13
PV = $100 x 1/(1,15)
3= $65,75
PV of Multiple cash Flows
Example
your auto dealer gives you the choice to pay $15,500 cash now, or make three
payments: $8,000 now and $4,000 at the end of the flowwing two years. If your cost of money is 8% wich do you prefer?
Immediate payment 8,000.00
PV
1= 4,000 = 3,703.70
(1+.08)
1PV
2=4,000 = 3,429.36
(1+.8)
2.
Example
you are selling your house. The Smith have offered you $115.000.
they will pay you immediately. The Joneses have offered you
$150.000, but the cannot pay you until theree years from today.
The interest rate is 10 percent. Which offer should you choose?
you have the opportunity to make invesment that cost $900.000. if
you make the investment now, you will receive $120.000 and
You are given three invesment alternatives to
anlyze. The cach fows from these three invesments
are follows:
END OF YEAR
A B C
1 $5,000 $1,000 $10,000
2 $5,000 $3,000 $10,000
3 $5,000 $5,000 $10,000
4 -$15,000 $10,000 $10,000
5 $15,000 $10,000 -$40,000
Perpetuities & Annuities
Annuity = Equally spaced level stream
of cash fows for a limited
period of time.
Annuities
FV of Annuity Formula
C = cash payment
r = interest rate
t = Number of years cash payment is received
FVAN = C X (1 +
r)
t- 1
Annuities
Example – future Value of annual payments
You plan to save $4,000 every year for 20
years and then retire. Given a 10% rate of
interest, what will be the FV of your
retirement account?
FVAN = 4.000 x (1 + 0,10)
20- 1
0,10
Annuities
PV of Annuity Formula
C = cash payment
r = interest rate
t = Number of years cash payment is
received
PVAN = C x (1 –
1/(1+r)
tAnnuities
Example – Annuities
you are purchasing a car. Your are scheduled to make
3 annual instllments of $4,000 per year. Given a rate
of interest of 10%, what is the price you are paying
for the car (i.e. what is the PV)
PVAN = 4.00 x 1- 1/
(1+0,1)
30,1
Annuity: Example
Your insurance agent oners to sell you an
annuity. It will pay you $400 per for fve
years. Your requred rate of return is 7%. How
much will you be willing to pay?
0 1 2 3 4 5 6
….. ……… …..…. ...……. ……… ...…
400 400 400 400 400
Annuity: Example
Your insurance agent offers to sell you an annuity. It will pay you $400
per for five years beginning of each years. Your requred rate of return is
7%. How much will you be willing to pay?
0 1 2 3 4 5 6
…... ……….. ….……. ….……. ...…….. ……
400 400 400 400 400
PAVN = C x (1 – 1/(1+r)
tx
(1 + r)
r
Your company is considering leasing $120.000
Perpetuities
PV of Perpetuity Formula
c = cash payment
r = interest rate
PV =
c
Perpetuities & Annuities
Example – Annuities
in order to create an endowment, which pays $100,000
per year, forever, how much money must be set aside
today in the rate of interest is 10% ?
PV = 100,000= $1,000,000
10
Perpetuities & Annuities
Example –continued
if the first perpetuity payment will not be
received until three years from today, how
much money needs to be set aside today?
Inflation
Inflation – Rate at which prices as a whole are
increasing.
Nominal Interest Rate – Rate at which money
inveted grows.
Real Interest Rate – Rate at which the
Inflation
1 + real interest rate = 1+nominal interest rate
1+inflation rate
Approximation formula
Questions and Problem
1. Ellen, a sophmore mechanical engineering student, receives a call from an
insurance agent, who believes that Ellen is an older woman ready to retire from teaching. He talks to her about several annuities that she could buy that would guarantee her an annual fixed income. The annuities are as fllows:
If Ellen could earn 12 percent on her money by placing it in savings account, should she place it instead in any of the annuities? Which ones, if any? Why ?
Annuity Initial payment into
annuity (At t=0) Amount of money received year Duration of Annuity(Years)
A $50,000 $8,500 12
B $60,000 $7,000 25
Questions and Problem
2. You are triying to plan for retirement in 10 years and currently you have
$150,000 in savings account and $250,000 in stock. In addition, you plan
to add to your savings by depositing $8,000 per year in your saving
account at the end of each of the next five years and then $10,000 per year
at the end of each year for the final five years until retirement.
a. Assumsing your savings account returns 8 percent compounded
annually and your investment in stocks will return 12 percent
compounded annually, how much will you have at the end of 10
years? (ignore taxes)
b. if you expect to live 20 years after you retire, and at a retirement you
deposit all of your savings in a bank account paying 11 percent, how
much can you withdraw each year after retirement (20 equal
.
What Is Capital Budgeting
Capital budgeting involves the decision making
process with respect to investment in fixed assets;
specifically, it involves measuring the incremental
cash flows associated with investment proposals and
evaluating the attractiveness of these cash flows
relative to the project’s costs
Capital budgeting is decision process that managers
First, a firm’s capital budgeting decisions
define its strategic direction, because moves
into new products, services, or markets must
be preceded by capital expenditures.
Second, the results of capital budgeting
decisions continue for many years
Thied, poor capital budgeting can have serious
Projects Classifcations
1. Replacement – Worn out equipment
2. Replacement – Reduce costs
3. Expansian of existing produkcts or markets
4. Expansion into new products or markets
JENIS-JENIS PROYEK
Independent Projects
: if the cash flows of one
are unaffected by the acceptance of the other.
Acceptance or rejection of project depends upon
merits of project compared to decision criteria.
Mutualli Exclusive Prjocts
: if the cash flows of
one can be adversely impacted by the acceptance
of the other.
An Example of Mutally Exclusive
Projects
BRIDGE vs BOAT
Some Alternative Invesment
Rules
•
Payback Period
•
Discounted Payback
•
Net Present Value (NPV)
•
Proftability Index
•
Internal Rate of Return
•
Modifed internal rate of Return
Payback Period
•
How long does it take to get the initial cost
back in a nominal sense?
•
Computation
Estimate the cash flows
Subtract the future cash flows from the initial cost
until the initial investment has been recovered
•
Decision Rule -
Accept if the
Net Cash Flows for Projects
S and L
Project S : 0 1 2 3 4
-1,000500 400 300 100
Project L : 0 1 2 3 4
-1,000100 300 400 600
Advantages and Disadvantages of
Payback
Advantages
Disadvantages
Easy ro undersand
ignore the time value of
money
adjusts for uncertainly of
later
cash fows
requres an arbitrary cuton
point
Biased towards liquidity
Ignores cash fows beyond
the cuton
date
Biased againt long-term
projects,
such as recearch and
development,
Discounted Payback Period
•
Compute the present value of each cash flow
and then determinane how long it takes to
Payback on a discounted basis
•
Compare to a specified required period
•
Decision Rule –
Accept the project if it pays
Projects S and L: Discounted Payback
Period
Project S : 0 1 2 3 4
-1,000 500 400 300 100
Disc. NCF (at 10%)
-1,000 455 331 225 68
Project L : 0 1 2 3 4
-1,000 100 300 400 600
Disc. NCF (at 10%)
-1,000 91248 301 410
Net Present Value
NPV= -
C
o+ C + C +….+ C = -C
o+ C
(1+
r
) (1+
r
)
2(1+
r
)
N(1+r)T
Net Present Value – Present value
of cash
fows minus initial invesments
Opportunity Cost of Capital –
Expected rate
The Net Present Value
Method :
Minimum Acceptance Criteria: Accept if NPV > O
Ranking Criteria: Choose the highest NPV
Net Present Value (NPV)
NPV = -1,000 + 500 400 300 100
(1+0,10)1 (1+0,10)2 (1+0,10)3 (1+0,10)4 =78.82
Cash Flows
0
1 2 3 4
-1000 500 400 300 100
454.55 330.58 225.39 68.30
NPV – Decision Rule
•
A positive NPV means that the
project is expected to add value to
the frm and will therefore increase
the wealth of the owners.
•
Since our goal is to increase owner
Goo Attributes of the NPV
Rule
1. Uses csh fows
2. Uses ALL cash fows of the project
3. Discounts ALL cash fows properly
Proftability Index (PI)
PI = Total PV of Future Cash Flows
Initial Investment
Pls = $1,078.82/$1,000=1.079
Minimum Acceptance Criteria:
Accept if PI > 1
Ranking Criteria:
Proftability Index (PI)
•
Disadvantages
problem with mutually exclusive
invesments
•
Advantages:
maybe usesful when available
invesment funds are limited
Easy to undersantand and communicate
Correct decision when evaluating
Internal Rate of Return (IRR)
•
Defnition : IRR is the return that
makes the NPV= 0
•
Decision Rule: Accept the project if
CF
o+ C
F
1+
CF
2+……+
CF
n=
0
(1+IRR)
(1+
0,10)
2(1+IRR
)
n-
1,000 + 500
+ 400 + 300 + 100 + = 0
(1+r)
(1+r)2 (1+r)3 (1+r)4CF
o+ C
F
1+
CF
2+……+
CF
n=
0
(1+IRR)
(1+
0,10)
2(1+IRR
)
n-
1,000 + 100 + 300 + 400 + 600 +
= 0
(1+r)
(1+r)2 (1+r)3 (1+r)4NPV Vs. IRR
•
NPV and IRR will generally give us the
same decision
•
Exceptions
non-conventional cash fows – cash
fow signs change more than once
Mutually exclusive projects
•
initial invesments are substantially dinerent
Example - Non – conventional Cash
fows
•
Suppoese an investment will cost
$90,000 initially and will generate
the following cash fows:
Year 1: 132,000
Year 2: 100,000
Year 3:-150,000
•
The required return is 15%
•
Should we accept or reject the
IRR and Mutually Exclusive
Projects
•
Mutually exclusive projects
If you choose one, you can’t choose the
other
Example: you can choose to attend
graduate scholl at either Havard or
Standard, but not both
•
Intuitively you would use the
following decision rules:
NPV – choose the project with the higher
NPV
IRR - choose the project with the higher
Example With Mutually Exclusive
Projects
The required return
for both projects is 10%
Which project should
you accept and why?
Period Project A Project B
0 -500 -400
1 325 325
2 325 200
IRR 19.43% 22.17%
Conficts Between NPV and
IRR
•
NPV directly measures the increase
in value to the frm
•
Whenever there is a confict
between NPV and another decision
rule, you should
always
use
NPV
IRR
is unrealiable in the following
situations
non-conventaional cash fows
Managers like rates—prefer IRR to
NPV comparisons. Can we give them
•
Yes, MIRR is the discount rate that
causes the PV of a projec’ts terminal
value (TV) to equal the PV of cost. TV is
found by compounding infows at WACC
•
Thus, MIRR assumes cash infow are
reinvested at WACC.
Modifed Internal Rate of
Return
Your division is considering two
invesment projects:
a. Compute the payback, discounted payback, NPV, PI, IRR, and MIRR for the following two projects. Assume the required return is 10%
b. If two project mutually exclusive and COC 5%, which project should the frm undertake?
c. If two project mually eclusive and COC 15%, which project should the frm undertake?
d. What is the crossover rate?
Year Project A Project B
0 -$25 -$25
1 5 20
2 10 10
3 15 8
Case
• Your frst assigment in your new position as assistant fnancial
analyst at Caledonia Products is to evaluate two new
capital-budgeting proposals. Because this is your frst assigment, you have been asked not only to provide a recommendation, but also to
respond to a number budgeting process. This is a standard procedure for all new fnancial analysts at Caledonia and will serve to determine whether you are moved directly into the capital-budgeting analysis departement or are provided with remedial training. The
memorandum you received outlining your assgment follows: to : The New Financial Analyst
from : Mr. V. Morrison, CEO, Caledonia Products RE : capital-budgeting analysis
provide an evaluation of two proposed projects, both with fve-year expected lives and identical initial outlays of $110,000. Both of these projects involeve addition to Caledonia’s highly successful Avalon
product line, and as a result, the required rate of return on both
In evaluating these projects, please respond to the following quetsions: a. Why is the capital-budgeting process so important?
b. Dtermine the payback, discounted payback, NPV, PI, IRR and MIRR, should they be accepted?
c. What would happen to the NPV and PI, if the required rate of return increased? If the required rate of return decreased?
d. How does a change in the required rate of return anect the project’s IRR?
Project A Project B
Initial Outlay -$110,000 -$110,000
Year 1 20,000 40,000
Year 2 30,000 40,000
Year 3 40,000 40,000
Year 4 50,000 40,000
The Dilemma at Day-Pro
• the Day-Pro Chemical Corporation, established I 1995, has managed to earn a consistently high rate of return on its
investments. The scret of its success has been strategic and timely development, manufacturing, and marketing of
innovative chemical product that have been used in various industries. Currently, the management of the company is considering the manufacture of a thermosetting resin as
packaging material for electronical products. The company’s recearch an development teams have come up produce initially but would have greater economies of scale. At the initial
.
•
In order to resolve this dilemma, Tim Palmer, the
Assistant Treasurer, and a recent MBA from a prestigious
mid-western university, has been assigned the task of
analyzing the costs and benefts of the two proposals
and presenting his fndings to the board of directors. Tim
knows that this will be an uphill task, since comes to
fnancial concepts. The Boar has historically had a
strong preference for using rates of return as its decision
criteria. On occasion it has also used the payback period
approach to decide between competing projects.
.
•
After obtaining the cash fow projections for each
project (see Tables 1 & 2), and crunching out the
numbers, Tim realizes that the hill is going to be
steeper than he thought. The various capital
budgeting techniques, when applied to the two
series of cash fows, provide inconsistent results.
The project with the higher NPV has a longer
payback period, as a lower Accounting rate of
.
• The day-Pro Chemical Corporation, established I 1995, has managed
to earn a consistently high rate of return on its invesments. The scret of its success has been strategic aand timely development,
manufacturing, and marketing of innovative chemical products that have been used in various industries. Currently, the management of the company is considering the manufacture of a thermosetting resin as packaging material for electronic products. The company’s
Recearch and Development teams have come up presentations and provided sufcient documentation in support of their proposals.
However, since the products are mutually exclusive, the frm can only fund one proposal.
.
The Board has historically had a strong preference for using rates of return as its decision creteria. On occasion it has also used the payback period approach to decide between competing projects. Howerer, Tim is convinced that the net present value (NPV)
method is least fawed and when used correctly will always add the most value to a company’s wealth.
after obtaining the cash fow projections for each project (see
Table 1&2) and crunching out the numbers, Tim realizezs that the hill is going to be steeper to the two series of cash fows, provide inconsistent results. The project with the higher NPV has a longer payback period, as well as a lower Accounting Rate of Return
.
Syntetic
Resin Year 0 Year 1 Year 2 Year 3 Year 4 Year 5
Net Income 150,0
00 200,000 300,000 450,000 500,000 Depreciatio
n 200,000 200,000 200,000 200,000 200,000
Net cash
fow (1000,000) 350,000 400,000 500,000 650,000 700,000
Epoxy Resin
Year 0 Year 1 Year 2 Year 3 Year 4 Year 5
Net Income 440,0
00 240,000 140,000 40,000 40,000 Depreciatio
Questions
1. Calculate the payback period of each project. Expalin
what argument Tim should make to shaow the payback
period is not appropriate is this case.
2. Calculate the Discounted Payback Period (DPP)using 10%
as the discount rate. Should the tim ask the board to use
DPP as the deciding factor? Explain.
3. Calculate the two project’ IRR. How should Tim convince
the Board that the NPV method is the way to go?
4. Explain how Tim can show that the Modifed Internal Rate
of Return (MIRR) is the more realistic measure to use in
the case of mutually exclusive projects
.
PROSES PENGANGGARAN
MODAL
1. Tentukan biaya proyek
2. Perkirakan aliranb kas yang diharapkan dari proyek,
termasuk nilai akhir aktiva
3. Risiko dari lairan kas proyek harus dietimasi. (memakai
distribusi probabilitas aliran kas)
4. Dengan mengetahui risiko dari proyek, manajemen harus
menentukan biaya modal (cost of capital) yang tepat
untuk mendiskon aliran kas proyek
5. Tentukan nilai sekarang aliran kas masuk yang
diharapkan digunakan untuk memperkirakan nilai aktiva.
6. Terakhir, nilai sekarang dari lairan kas yang diharapkan
HAL PENTING DALAM ESTIMASI ALIRAN
KAS
1. Keputusan dalam capital budgeting harus
didasarkan pada aliran kas setelah pajak.
2. Hanya memeperhatikan
incremental cash fow
yang
relevan.
3. Memperhatikan aliran kas yang timbul karena
keptusan investasi, aliran kas dari keputusan
pendanaan tidak perlu diperhatikan (ex: bunga,
cicilan, deviden)
4. Tidak memasukan sunk cost (biaya yang telah
terjadi)
Project Cash Flows
•
Initial outlay. This include the cost of the fxed
assets associated with the project plus any initial
invesment in net operating working capital, such
as raw materials
•
Opertaing cash fow. The operating cash fow is the
net operating proft after taxes plus depreciation
Project Cash Flows
When deciding whether or not to make an invesment, we
must frst estimate the cash fows that the invesment will
provide
Generally, these cash fows can be categorized as follows:
the initial outlay (IO)
operating cash Flows
The terminal cash fows (TCF)
Operating Cash fow
Initial terminal Outlaycash fow
Sebagai manejer keuangan yang baru ditunjuk di Blooper Industries, Anda akan menganalisis sebuah proposal penambangan dan penjualan biji magnisium kelas satu yang langka. Proyek ini memerlukan investasi $10 juta. Setelah 5 tahun kandungan biji magnesium habis, metode
penyusutan adalah garis lurus, dengan nilai buku pada kahir tahun
menjadi nol. Pada tahun ke enam peralatan mungkin dapat dijual senilai $2 juta. Untuk itu perusahaan dikenal tagihan pajak pada tahun ke
enam senilai 35%+ x $2= $0.70. sehingga arus kas bersih dari
penjualan aktiva tahun ke enam adalah $2- $0.7= $1.3 juta. Ramalan modal kerja dari Blooper Industries adalah sbb:
Perusahaan memperkirakan mampu menjual 750.000 pon magnesium per tahun dengan harga $20, harga akan meningkat sesuai dengan tingklat infasi, beban operasi diperkirakan sebesar 2/3 dari
pendapatan. Tingkat infasi 5%, dari tarif pajak 35%. Tentukan Cash
Flows
1.575 1.654 1.736 1.823 0 0
M. kerja 1.50
0 1 2 3 4 5 A. Aktiva Tetap
Investasi aset tetap -100.000
Penjualan asset tetap 21,758
Opportunity cost -150,000 150,000
Arus kas, investasi aset tetap -250,000 171,758
B. Modal Kerja
Modal kerja 10,000 10,000 16,320 24,969 21,224 0
Perubahan modal kerja 10,000 0 6,320 8,649 -3745 -21,224
Arus kas investasi modalkerja -10,000 0 -6,320 -8,649 3,745 21,224
C. Operasi
Pendapatan 100,000 163,200 249,696 212,242 129,892
Beban operasi 50,000 88,000 145,200 133,100 87,846
Depresiasi 20,000 32,000 19,200 11,520 11,520
Laba sebelum pajak 30,000 43,200 85,296 67,622 30,526
pajak 10,200 14,688 29,000 22,991 10,526
Laba setelah pajak 19,800 28,512 56,296 44,631 20,147
Arus kas dari operasi 39,800 60,512 75,496 56,151 31,667
D. Penilaian
Total arus kas proyek -260,000 39,800 54,192 66,847 59,896 224,649
Analisis Arus kas Proyek Penggantian
PT Tekstil membeli mesin pintal 10 tahun yang lalu dengan $75.000. mesin tersebut memiliki usia ekonomis selama 15 tahun dan
sisusutkan dengan metode garis lurus, tanpa nilai sisa. Jadi nilai
buku mesin saar ini adalah $25.000. perusahaan merencangkan akan mengganti mesin lama dengan mesin baru. Mesin baru yang sejenis dapat dibeli dengan harga $120.000, dengan usia ekonomis 5 tahun, disusutkan dengan MACRS. Nilai sisa jika dijual rugi $15.000. pajak perusahaan 40%. Apabila penggantian itu dilakukan dapat
Tabel: Estimasi Arus Kerja
37.600 43.360 37.216 33.530 40.442
Soal
Scoty Corporation pembuat komponen elektronik. Scoty
mempertimbangkan untuk mengganti satu mesin perakit yang dioperasikan dengan tangan dengan mesin baru nyang otomatis. Mesin perakit tersebut dibeli 5 thaun yang lalu dengan harga
$50,000, umur ekonomis 10 tahun. Harga mesin baru $60,000, usia ekonomis 5 tahun, tanpa nilai sisa
Buatlah estimasi cash fows, apakah proyek layak dijlankan bila biaya dana 16%
Situasi sekarang (mesin perakit manual)
Situasi yang diajukan (mesin perakit otomatis)
Gaji operator $25,000 Gaji operator 0
Tabel: Estimasi Arus Kas
Keterangan Tahun
0 1 2 3 4 5
Initial cash Flow
1. Harga mesin baru
ditambha pemasangan &
13. Operating cash fow (12=8)
25.000
14. Nilai jual mesin baru 15. Pajak: 34%(20,000-0)
Proyeksi cash fow -54,200 20,608 20,608 20,608 20,608 33,808
Problem
•
PT. A sedang mempertimbangkan pembelian
panggangan baru yang hemat energi.
Panggangan ini berharga $40,000 dan akan
disusutkan menurut skedul MACRS 3 tahun.
Panggangan ini akan ndijual sebagai besi tua
setelah 3 tahun senilai $10,000. panggangan
ini tidak berdampak pada penerimaan tapi
akan menghemat biaya energi sebesar
$20,000. tingkat pajak 35%, dan biaya modal
12%.
The Unequal Lives Problem
•
There are two ways to correctly deal with the
unequal lives problem
The replacement chain approach
The equivalent annual annuity approach
•
Misalkan Anda harus memilih di antara 2 mesin,
yang umurnya berbeda, tapi memiliki kapasitas
iidentik dan melakukan pekerjaan yang persis
sama.
Mesin mana yang sebaiknya dipilih ?
Biaya (ribuan dolar) PV
Memilih di antara 2 proyek yang
mutually exclusive
Jika discount rate = 10% NPV proyek A = $928,11 NPV proyek B = $612,32
EAA untuk proyek A = $213,11 EAA untuk proyek B = $246,21
0 1 2 3 4 5 6
Metode Penyusutan
•
Metode garis lurus: metode penyusutan
yang mengalokasikan biaya secara merata
selama usia penyusutan aktiva
•
Sum of year’s digit method: metode
penyusutan dengan penjumlahan angka
tahunan
•
Double decline balance method: dengan
formulasi 2(1/n) NBV
•
MACRS : dengan menggunakan tabel tarif
Tahun Kelas Properti Pemulih
an 3 tahun 5 tahun 7 tahun 10 tahun
1 33,33% 20,00% 14,29% 10,00%
2 44,45% 32,00% 24,49 18,00%
3 14,81% 19,20 17,49% 14,40%
4 7,41% 11,52% 12,49% 11,52%
5 11,52% 8,93% 9,22%
Capital Rationing
(limit set on the amount of funds available for investment)
•
Firms should implement all positive
NPV projects
this will maximize shareholder wealth
•
Firms often limi the projects that are
considerations
•
Capital Rationing: process of limiting
Capital Rationing
Anggaplah biaya modal 10%, dan perusahaan memiliki sumber daya total $20 juta, saat ini perusahaan dihadapkan pada beberapa proposal proyek sbb:
Karena dana terbatas $20 juta, maka Proyek yang dipilih: L,J,M, dan N Jika dana terbatas 10 juta, proyek mana yang dipilih?
Capital Rationing
Hat company is considering seven capital investment propoasl, for
which the funds available are limited to a maximum of $12 million. The projects are independent and have the following cost and proftability index associated with them:
Under strict capital rationing, which projects should be selected ?
Study Problems
Jack tar, CFO sheetbend Inc, membuka amplo rahasia perusahaan. Isinya adalah draft tawaran untuk kontrak memasok kanvas ransel pada angkatan Laut AS. Surat memo dari CFO sheetbend meminta mengkaji tawaran itu sebelum diajukan.
Tawaran dan dokumen pendukungnya disiapkan oleh staf penjualan
sheetbend. Sheetbend diminta memasok 100.000 yard kanvas ransel selama 5 tahun, dengan harga jual adalah tetap sebesar $30 per yard
Tn. Tar tidak biasanya terlibat dalam penjualan. Tapi tawaran ini tidak akan berkomitmen pada Sheetbend dengan kontrak jangka panjang dan harga tetap. Kedua memproduksi kanvas ransel membutuhkan $1.5 Tar mulai bekerja pada akhir minggu mengumpulkan fakta dan asumsi sbb:
- Pabrik di Oleasantoro dibangun tahun 1900 an dan sekarang menganggur. Pabrik ini diusutkan penuh di permukaan Sheetbend, kecuali biaya
pembelian tanah (19470 senilai $10,000
- Sekarang tanah itu adalah properti pinggir pantai yang bernilai. Tar berfikir tanah dan pabrik yang menganggur itu bisa dijual dalam waktu dekat
- Merenovasi pabrik akan berbiaya $500,000. invetasi ini
akan diusutka secara garis lurus selama 10 tahun
- Mesin baru akan berbiaya $1 juta. Investasi ini bisa
diusutkan secara garis lurus selama 5 tahun
- Pabrik yang direnovasi dan mesin baru akan berusia
bertahun-tahun. Akan tetapi, pasar yang tersisa untuk
kanvas ransel itu kecil, dan tidak jelas apakah order
tambahan bisa diperoleh begitu kontrak AL berakhir. Mesin
ini khusus dan hanya nbisa digunkan untuk kanvas ransel .
Nilai jual bekasnya diakhir tahun ke lima mungkin nol.
- Modal kerja pada awal tahun adalah $300.000, dan modal
kerja ini diperkirakan 10% dari total pendapatan.
- Ramalan laba staf penjualan dari kontrak AL, dapat dilihat
pada tabel 1
- Saat ini ada tawaran dari penjualan dari perusahaan
Tabel 1
Dalam Ribuan
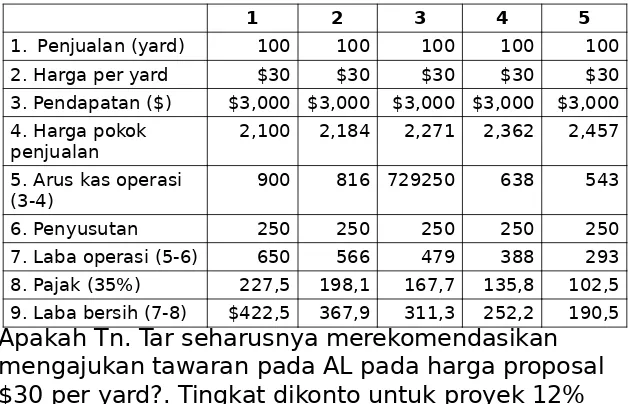
Apakah Tn. Tar seharusnya merekomendasikan
mengajukan tawaran pada AL pada harga proposal
$30 per yard?. Tingkat dikonto untuk proyek 12%
1 2 3 4 5
1. Penjualan (yard) 100 100 100 100 100
2. Harga per yard $30 $30 $30 $30 $30
3. Pendapatan ($) $3,000 $3,000 $3,000 $3,000 $3,000 4. Harga pokok
penjualan
2,100 2,184 2,271 2,362 2,457
5. Arus kas operasi
(3-4) 900 816 729250 638 543
6. Penyusutan 250 250 250 250 250
7. Laba operasi (5-6) 650 566 479 388 293
8. Pajak (35%) 227,5 198,1 167,7 135,8 102,5
.
2. PT. “Dallas” sedang mengevaluasi proyek
pembelian mesin baru. Harga mesin Rp 175 juta,
dengan tambahan biaya pemasangan Rp 25 juta.
Usia mesin adalah 5 tahun. Nilai buku mesin pada
akhir tahun ke 5 adalah 0, tapi mesin masih dapat
dijual sebagi besi tua dengan harga 5 juta. Mesin
memerlukan tambahan modal kerja bersih Rp 10
juta, dan dengan penggunaan mesin tersebut
What measure of risk is relevant in
capital budgeting
•
In capital budgeting, a project can be
looked at on three levels:
Stand Alone Risk
Mengukur stand-alone risk berarti mengukur
ketidakpastian keuntungan atau kepastian arus kas
E(CF) = 5.000 E(V)= 5.000
Ơ A=1.095 ƠB=894
Usulan Investasi A Usulan Investasi B Probabilitas Arus kas Probabilitas Arus kas
.
Apabila E(V) dari kedua investasi tidak
sama, maka penggunaan
Ơ
sebagai
indikator risiko menjadi sulit dilakukan,
untuk itu digunakan coefcient of
variation (CV) CV = Ơ/E(V)
C DE(V) 1.000 1.500
Ơ 400 500
Problem
• Misalkan saudara diminta untuk memilih salah satu diantara kedua proyek berikut ini:
Pertanyaan:
a. Dengan menggunakan NPV maksimum yang diharpkan, proyek mana yang saudara pilih?
b. Dengan menggunakan coenfdient of variation, proyek mana yang saudara pilih?
A B
NPV Prob NPV Prob
$100 0,30 $300 0,30
$400 0,40 $500 0,40
Risiko Proyek
Beberapa metode yang bisa digunakan
antara lain:
a. Analisis Sensitivitas
b. Analisis Scenario
Mean-standard deviation Analysis
•
Dilakukan dengan memasukan arus kas dari
setiap kondisi perekonomian, yang akan
membentuk probabilitas untuk NPV kemudian
menghitung probabilitas untuk NPV tertentu.
•
Pendekatan ini mengasumsikan bahwa arus kas
bersifat independen dari waktu ke waktu.
Rata-rata (mean) distribusi probabilitas NPV adalah:
krf= suku bunga bebas risiko
Mean-standard deviation Analysis
krf =10%
Kondisiperokonomian Arus kas masuk bersih
Prob Thn 1 Thn 2 Thn 3 Thn 4
Resesi 0,25 $4.300 $4.570 $4.400 $19.71
6
Rata-rata 0,50 $7.302 $7.747 $7.333 $23.71
6
Baik 0,25 $9.812 $10.400 $10.45
0 $30.880
CFT $7.179 $7.616 $7.397 $24.50
7
Ơ $1.952 $2.065 $2.139 $4.025
NPV =$9.103
Problem
perusahaan Anda memperoleh informas arus kas
proyek sbb:
a. Tentukan expected NPV, dan standard deviasi NPV
b. Berapa probabilitas proyek akan menghasilkan NPV=0
Thn 1 Thn 2 Thn 3
Prob Arus kas Prob Arus kas Prob Arus kas
0,1 $1.000 0,2 $1.000 0,2 $1.000
0,2 $2.000 0,3 $2.000 0,3 $2.000
0,3 $3.000 0,4 $3.000 0,4 $3.000
0,4 $4.000 0,1 $4.000 0,1 $4.000
CFT $1.967,5