http://dx.doi.org/10.17503/Agrivita-2014-36-1-p081-090
STABILITY ANALYSIS OF NINE PROMISING CLONES OF TEA
(
Camellia sinensis
)
Rudi Hari Murti, Ani Puspitasari and Suyadi Mitrowihardjo
Department of Agronomy, Faculty of Agriculture, Gadjah Mada University Jl. Flora No 1 Bulaksumur Yogyakarta 55281 Indonesia
Corresponding author Phone: +62-274- 563062 E-mail: [email protected]
Received: March 10, 2014 /Accepted: May 29, 2014
ABSTRACT
There are many clones grown in Indonesia tea plantations. The latest clones were released around 1990. The new promising clones have been bred through crossing among selected clones in Pagilaran tea plantation. The experiment aimed to select high yield and stable clone. Nine clones were grown in Kayulandak (1300 m asl) and Andongsili (1100 m asl) in Randomized Completely Block Design with three replications. The data of fresh weight per plot in 2007, 2008, 2009, 2011, 2012 were recorded. Eberhart & Russell (1966) and GGE Biplot analysis method was applied for data analyzing. The result showed that all of clones were stable over years in each location except for PGL1 and PGL3 in Andongsili and PGL15 in Kayulandak based on Eberhart and Russell analysis. Significant regression coefficient (1.18) of PGL3 implied that PGL3 was high in yield and responsive. GGE biplot analysis indicated no ideal genotype for each location. PGL10, PGL3, PGL4 and PGL 12 were recommended for Kayulandak, while PGL3 and PGL12 clones were suitable for Andongsili. Both analysis of Eberhart & Russell and GGE biplot showed PGL3 and PGL12 as ideal clone, while PGL10, PGL4, and PGL 15 clone were desireable clones.
Keywords : Eberhart and Russell, GGE Biplot, tea clones, yield stability
INTRODUCTION
Indonesia has potential in tea production and in recent years was in eighth greatest producers in the world. Decreasing export volume, market, and price were the main problem of tea in Indonesia and finally affect the leveling of tea area development (Suhendra, 2008). Most of the tea plantations (50%) were grown from
seedling almost more than 100 years ago (Anonym, 2011). The weakness of the seedling as planting material was variability and unselected plants in the population. Clonal population with high yield and stability is inevitable in term of an increase in tea production.
Tea breeding program in Pagilaran estate has been carried out and produced nine promising clones. Identification for morphological character-ristics of tea clones had been done but the stability of fresh leaves weight (yield) was not tested yet. According to Astika (1978), the breeder has to select an outstanding clone that was suitable for general or specific location. Yield in a geogra-phical area of production cannot be used to estimate the yield in other tea growing areas (Owuor et al., 2009). So it needs clone trials to obtain information of genotype-environment inter-action. Genotype-genotype-environment interactions (GEI) are of major importance to tea breeders in evaluation of promising clone. Clone that could be used for planting material has to fulfil the requirement of high yield and stability. Yield includes a quantitative character that is greatly affected by environments.
Eberhart and Russell (1966) had developed stability parameters that could be used to determine stability of clone. While Yan and Tinker (2006) developed Genotype and Genotype x Environment interaction (GGE) Biplot analysis was based on principal component analysis (PCA) to fully explore multi-environment trials. GGE analysis partitions G + GE into principal components through singular value decom-position of environmentally centered yield data (Yan, 2001). This method has been broadly used to identify high yielding and adapted cultivar candidate such as tamaria (Brar et al., 2010), chickpea (Farshadfar et al., 2011), and wheat (Koutis et al., 2012; Hagos and Abay, 2013).
Result of stability studies in tea showed different yield in various locations according to
Owour et al. (2009). Yield in a production area could not be used to predict its expected yield in another production area (Owour et al., 2009). Omolaja and Esan (2005) found a clone that had high stability for yield and vigor but unfortunately the means yield was lower than grand mean. Magnitude of yield was significantly correlated with bi and SEi
2
(Wachira et al., 2002). Increasing yield in tea would change yield stability and lead to the development of genotype that is specifically adapted to environment with optimal growing condition (Wachira et al., 2002).
In this experiment, Eberhart and Russell (1966) and GGE bilpot (Yan and Tinker, 2006) analysis method was applied to analyse stability of nine promising clones of tea. The aim of experiment was to identify the high yield and stability of tea clones over the years in each area and for both areas.
MATERIALS AND METHODS
Nine selected clones of tea were progenies of crossing by hand pollination as followed PGL1 TRI2025). The clones were planted in 2006 in two locations whereas Andongsili and Kayulandak were located at 1,100 m asl and 1,300 m asl, respectively. Both of them were located in Pagilaran tea estate with rain distributed throughout the year except for one or two dry months in July and August. Nine clones were arranged and grown in Randomized Complete Block Design with three replications in both site. Each experimental unit consisted of twenty plants. The seedlings were planted at a 60 cm x 120 cm in rectangular spacing. NPK fertilizer (percentage 60:30:20) was applied three times a year with dosage 45 g/plant. Leaves fertilizer (Superjoss® or Ng®) was applied in concentration of 2 mL/L or 500 mL/ha two days after harvested.
In 2010 the plants were cut to maintain the height of plant. The pest (Empoasca) usually
attacking tea plant in dry season was controlled with Confidor®1g/L two days after harvested, and the disease caused by Exobasidium vexans Massee ussually attacked in rainy season and was controlled with Cobox®2 g/L and 250 L solution/ha that was applied two days after harvested.
The fresh leaf weight per plot was observed every 14 days from 2007-2012. Data in each year was accumulated, and multi years data was obtained. Analysis of variance and Duncan’s Multiple Range Test were subjected for data
analysis with α=5%. Regression analysis of Eberhart Russel method and GGE (Genotype main effect and Genotype by Environment Interaction) Biplot metode was used for evaluating stability of clones.
RESULTS AND DISCUSSION
Yield included in quantitative trait (Allard, 1969) was affected by environment factors such as climate (temperature, humidity, rain volume and its distribution in the years) and soil (chemical, physical, and fertility condition). The average of weight of fresh leaves, regression coefficient and deviation of regression (S2d) are presented in Table 1. The average of fresh weight of leaves ranged from 7,870-14,348 g/plot/year (≈ 7.174 kg/ha/year, population 10,000 plant/ha). This result was lower than average yield in Pagilaran field (7.8-9.1 ton/ha/year). It was because the plant was very young (aged 2-6 years) compared to other plants in production unit (aged > 20 years).
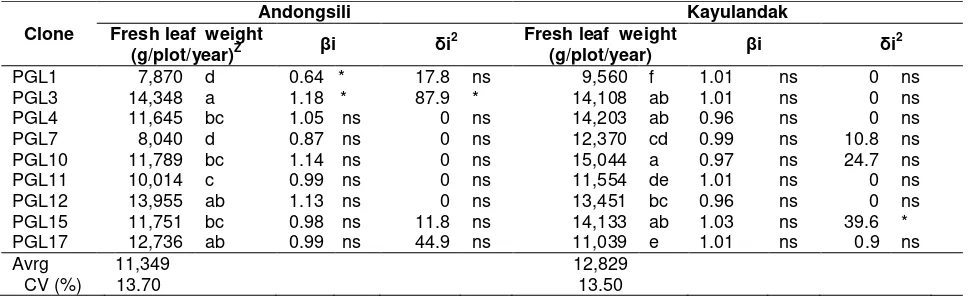
Tabel 1. Parameters of Eberhart-Russell model fresh leaf weight of tea (g/plot/year) in Andongsili and
Remarks: znumber in the column followed by same letters are not significantly different at α =5%; ns = not significant,
* = βior δi2 was significantly different from 1 or 0
Clone that has regression coefficients approximating 1.0 coupled with S2d of zero in Eberhart and Russell model indicates average stability (Eberhart and Russell, 1966). Regression values above 1.0 describe genotypes with higher sensitivity to environmental change and greater specificity of adaptability to high yielding environ-ments. Regression coefficients decreasing below 1.0 provide a measure of greater resistance to environmental change, and therefore increase specificity of adaptability to low yielding environ-ments.
The result of coefficient regression ranged from 0.64-1.18 in Andongsili and 0.96-1.01 in Kayulandak. This variation indicates that the responses of clones to environment change were different. The range of regression coefficient was comparable to a previous study on tea (Wachira et al., 2002). Two of nine genotypes in Andongsili had regression coefficient significantly different from 1.0, while just one of nine clones in Kayulandak had regression coefficient signi-ficantly different from 1.0. The deviation of means square from regression (S2d) was not significantly different from 0 except PGL3 in Andongsili and PGL15 in Kayulandak.
According to Eberhart-Russell (1966), stability parameters were indicated by regression coefficient of 1.0 couple with S2dof 0. Eberhart-Russell model analysis showed that all of tea clones were judged stable over five years in Andongsili except PGL1 and PGL3, while PGL15 was unstable in Kayulandak (Table1). The stable clone with high yield was ideal clone but it was not be recommended to extend tea production.
Regression coefficient of PGL3 in Andongsili was significantly higher than 1 (Table 1).This finding indicates that PGL3 had higher sensitivity to environmental change and greater specificity of adaptability to high yielding environments. PGL3 clone was relatively responsive to environmental change, so environment modification leading to better environment was suggested. This clone was different from the stability of KIARA8 as one of the parental (Mangoendidjojo, 1991). This finding is in line with that of Wachira et al. (2002), whereas selection in increasing yield of tea would change yield stability by increasing bi and consequently the clone would be adapted in favourable growing condition. Similar result found in quality parameter by Owour et al. (2010), genotype selected in one location for high quality may not retain the quality over other genotype in another location.
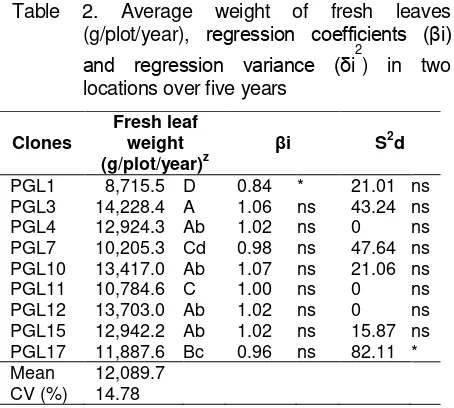
Table 2. Average weight of fresh leaves (g/plot/year), regression coefficients (βi)
and regression variance (δi2) in two
significantly different from 1 or 0
When the breeder sought the stable clone in two locations over five years, analysis of variance and regression of Eberhart Russell had to be applied to combine data of both locations and the period of five years (ten environments). The Means of fresh weight of leaves, regression coefficient and variance of nine clones in ten environments (both locations and period of over five years) are shown in Table 2. PGL3, PGL12, PGL10, PGL15 and PGL4 clones had high yield and stability in ten environments. PGL1 and PGL17 clone were unstable. Regression coefficient of PGL1 clone was lower than 1 in parallel with regression coefficient in Andongsili, indicating that PGL1 clone adapted in marginal/poor areas. PGL17 was unstable, which was indicated by variance of regression significantly different from 0, although the regression coefficient was not significantly different from 1. PGL3, PGL12 and PGL 10 were the clones that had means higher than grand means and were stable over ten environments.
The analysis of stability statistics could not provide an accurate picture of the complete response pattern (Hohls, 1995), whereas the
genotype’s response to varying environments was multivariate (Lin et al., 1986). Through multivariate analysis, the data can be
summarized and analysed more easily (Crossa, 1990).
Recently, GGE Biplot is the most preferable method for genotype interaction and environment analysis. GGE focuses on the combined effect of G + GE components relevant to cultivar evaluation, and it could remove the effect of the environment (E) (Yan, 2001). The robust feature of GGE biplot is its ability to show
the “which-won-where” pattern of a genotype by environment dataset (Yan and Tinker, 2006).
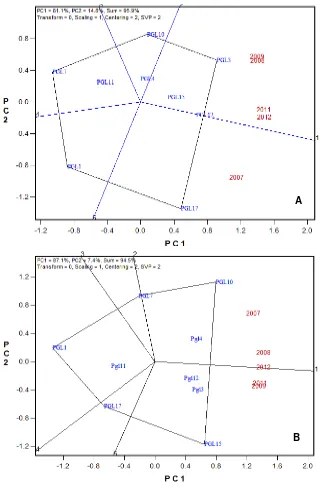
Interaction patterns between genotypes and environments and to effective interpretation of a biplot could be visualized with the polygon five sectors. Ray 1 was perpendicular to the line connecting genotype PGL3 and PGL17, while ray 2 was perpendicular to the line connecting PGL3 and PGL10 clones, and so forth. Genotype in vertices of polygon showed the best or the poorest performance in one or other environments. In Andongsili, production years of 2008, 2009, 2011 and 2012 were grouped and made up the first mega environment, with clone PGL3 as the winner. The second mega environment was 2007 with PGL17 as the winner. Other clones on the vertices did not respond in five-year evaluation. Different response was detected in Kayulandak. In Kayulandak, PGL10 clone was the best clone in mega environment 2007, 2008 and 2012, while PGL15 clone was the best clone in mega environment 2009 and 2011. It indicated different response of clones to years. Each clone needed different environment for producing maximum leaf fresh weight.
Figure 1. Polygon views of the GGE biplot on symmetrical scaling for the which-won-where pattern of genotypes and environments (A) Andongsili (B) Kayulandak
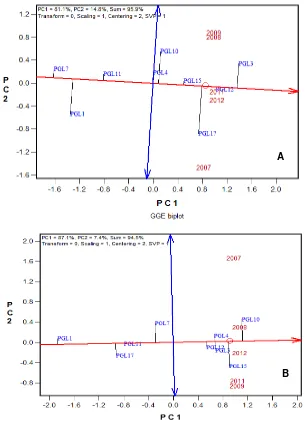
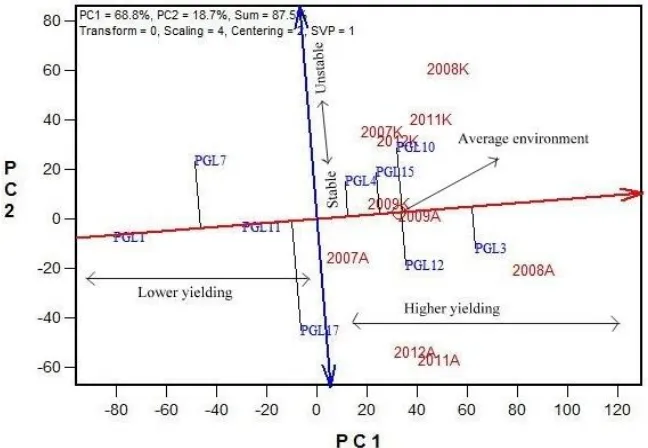
The double-arrow line is the AEC ordinate and it points to greater variability (poor stability) in either direction. The instability index calculated as per Eberhart and Russel (1966) model (table 1) has the same magnitude as depicted by GGE biplot (Fig. 2). PGL4 and PGL12 were most stable in both locations, while PGL 17 and PGL
15 were most unstable in Andongsili and Kayulandak respectively. PGL17 clone was unstable, as it performed better than the average in 2007, 2011 and 2012 and poor in 2008 and 2009, while PGL15 was unstable in 2009, 2011, and 2012. The opposite condition was PGL10 in different years in both locations.
A
Figure 2. Average environment coordination (AEC) views of the GGE biplot based on environment focused scaling for the means performance and stability of genotypes (A) Andongsili (B) Kayulandak
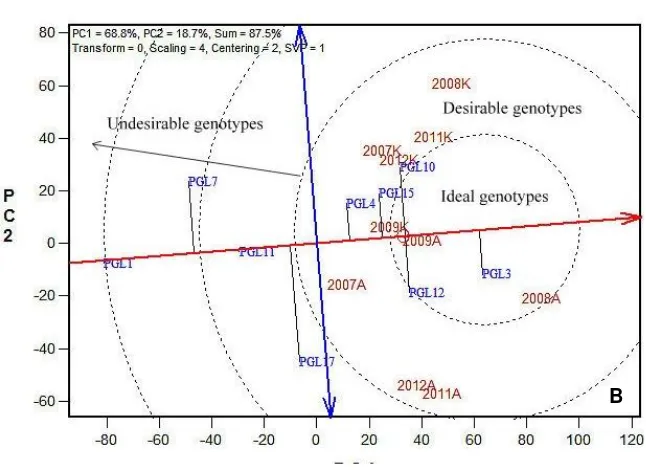
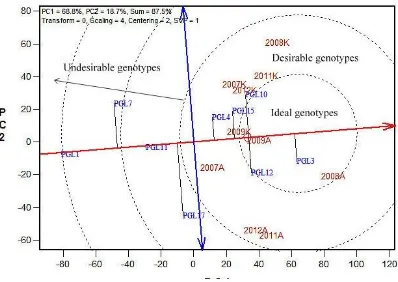
An ideal clone should have both high mean yield and high stability. The clones were ranked across years with respect to an ideal genotype on AEA in the positive direction. The highest mean of leaf fresh weight of clones had a vector length equal to the longest vector of the genotypes on the positive side of AEA. Therefore, genotypes
which are closer to “ideal genotype” are more
desirable than others (Yan and Tinker, 2006). PGL3 and PGL12 were desirable clones for Andongsili, while PGL10, PGL15, PGL4, PGL3 and PGL12 were desirable across the years in Kayulandak (Figure 3). There was no ideal clone in each location.
A
Figure 3. GGE biplot based on genotype-focused scaling for comparison the genotypes with the ideal genotype (A) Andongsili (B) Kayulandak
Figure 4 shows that GGE biplot with PC1 and PC2 could cover 87.5% of data variation of ten environments. The environment (locations-years) was divided in two mega environments (sector 1 as mega environment, 1 as most production years in Kayulandak and sector 5 as mega environment 2 most production years in
Andongsili). PGL3 clone was the winner clone in mega environment 2 followed by PGL12 clone, while PGL10 clone was the winner clone in mega environment 1 followed by PGL4 and PGL15 clones. The result was similar to analyzed data of over years in each location.
A
PGL3 was the best clone over all environments, and it was followed by GPL10 and PGL12 (Figure 5). The variance of PGL3 was lower than PGL10 and PGL12. Based on means
and variance, PGL3 and PGL12 were the ideal clones, while the desirable genotypes were PGL10, PGL4 and PGL15 clones (Figure 6).
Figure 4. Poligon GGE biplot with patern which-won-where in two locations over five years
Figure 6. GGE biplot based on genotype-focused scaling to compare genotype with ideal genotype
CONCLUSIONS
PGL3 produced high leaf fresh weight and was responsive to favourable environment indicated by regression coefficient 1.18 (significant). PGL3 and PGL12 were the best clones based on means and stability based on Eberhart & Russell analysis and GGE biplot analysis in both locations and a period of over five years. Based on Eberhart & Russell analysis and GGE biplot for single location, recommended clones for Andongsili were PGL3 and PGL12 clones, while PGL10, PGL3, PGL4 and PGL12 clones were recommended for Kayulandak.
ACKNOWLEDGEMENTS
We wish to thank to Pagilaran Co. Ltd. for serving the secondary data and The Indonesian Directorate General of Higher Education (DIKTI)
for the funding through Excellent Research Program for Universities 2013.
REFERENCES
Anonim. 2011. Tea exporting performance is potential to increase (in Indonesian). <http://www.businessnews.co.id>.accesse d on November 5, 2012.
Astika, W. and D. Muchtar. 1978. Recommendation in tea ingredients in 1978 (in Indonesian). Warta BPTK.4 : 297-306.
Brar, K.S., P. Singh, V.P. Mittal, P. Singh, M.L. Jakhar, Y. Yadav, M.M. Sharma, U .S. Shekhawat and C. Kumar. 2010. GGE biplot analysis for visualization of mean performance and stability for seed yield in taramira at diverse locations in India. J. of Oilseed Brassica 1(2): 66-74
Eberhart, S.A. and W.A. Russell. 1966. Stability parameter for comparing varieties. Crop Sci. 6: 36-40.
Farshadfar, E., H. Zali and R. Mohammadi. 2011. Evaluation of phenotypic stability in chickpea genotypes using GGE-Biplot. Annals of Biological Research, 2(6):282-292
Hagos, H.G. and F. Abay. 2013. AMMI and GGE biplot analysis of bread wheat genotypes in the northern part of Ethiopia. J. Plant Breed. Genet. 1: 12-18
Hohls, T. 1995. Analysis of genotype-environment interactions. S. Afr. J. Sci. 91: 121-124. Koutis, K., A.G. Mavromatis, D. Baxevanos and
M. Koutsika-Sotiriou. 2012. Multi environ-mental evaluation of wheat landraces by GGE biplot analysis for organic breeding. Agricultural Sciences. 3(1): 66-74
Lin, C.S., M.R. Binns and Lefkovitch, L. P. 1986. Stability analysis: Where do we stand? Crop Sci. 26: 894-900.
Mangoendidjojo, W. 1991. Analysis on stability of tips production in several tea clones in the garden of PT. Pagilaran (in Indonesian). Agricultural Science. 4 : 281-288.
Omolaja, S.S. and E.B. Esan. 2005. Yield evaluation of high altitude tea (Camellia sinensis (L) O. Kuntze) in lowland ecologies of Nigeria. Nigeria Journal of Horticultural Science 10: 87-93
Owour, P.O., D.M. Kamau and E.O. Jondiko. 2009. Responses of clonal tea to location of production and plucking intervals. Food chemistry 115:290-296.
Suhendra. 2008. Tea industry of Republic of Indonesia. Classical Problems. <http:// finance.detik.com> (in Indonesian). Accessed on November 5, 2012.
Wachira, F., W. Ng’etich, J. Omolo and G. Mamati. 2002. Genotype x environment interactions for tea yields. Euphytica 127:289-296.
Yan, W. and N. Tinker. 2006. Biplot analysis of multi-location trail data: principles and applications. Can. J. Plant Sci. 86:623-645 Yan, W. 2001.GGE biplot-a Windows application for graphical analysis of multi-environment trial data and other types of two-way data. Agron. J., 93(5):1111-1118.