Non-Axial Stress State in a Model Silo Generated by Eccentric
Filling and Internal Inserts
Marek Molenda*, Michael D. Montross**, Józef Horabik*
(Received: 20 December 2006; in revised form: 15 June 2007; accepted: 18 June 2007)DOI:10.1002/ppsc.200601113
1 Introduction
According to Rotter [2], a silo wall is a shell that pre-sents some of the most complicated mechanics for a structural engineer. Rotter listed numerous new re-search areas and the need for general discussion of ap-propriate analysis methods that operate within stan-dards, i.e., Eurocode 1. Unsymmetrical normal pressures on the wall under symmetrical conditions of discharge, eccentric discharge pressure regimes and nonuniform stress states were some of the major areas that need to be addressed. Sundaresan [3] focused attention on gaps
in the understanding of the mechanics of particulate sys-tems, its translation into mathematical models and the solution of such models. In the area of storage and dis-charge of granular materials, Sundaresan pointed out several problems that still remain a challenge. One ma-jor problem is the inability to characterize how second-ary variables (such as small changes in humidity level) affect the deformation characteristics of the grain bulk. Standard procedures for the estimation of loads on silo walls are based on the rigid-perfectly plastic material model [4]. Beginning with Coulomb as far back as 1771, part of this model, the yield condition, was used to de-termine limiting stresses in soils. Load determination methods in silos based on the Mohr–Coulomb yield con-dition are still widely used in practice, and in general, provide a good estimation of loads. However in some cases such as the dynamic load shift at the beginning of discharge, the loads on objects immersed in grain or de-velopment of stagnant zones on flat inserts cannot be predicted [5]. Haydl [6] suggested that even currently * Assoc. Prof. M. Molenda (corresponding author), Prof. J.
Horabik, Institute of Agrophysics, Polish Academy of Sciences, Doswiadczalna 4, 20-290 Lublin (Poland).
E-mail: [email protected]
** Assoc. Prof. M. D. Montross, 128 Barnhart Building, Biosys-tems and Agricultural Engineering, University of Kentucky, Lexington KY (USA).
Abstract
Dangerous nonuniformity of grain loads within a silo may be caused by eccentric discharge, eccentric loading, eccentric structural members fastened to the wall, geo-metrical imperfections or nonuniformity of the frictional conditions. Some of these effects have been quantified based on testing corrugated-walled, flat floor model si-los filled with wheat. In this type of silo, filling above a height to diameter ratio ofH/D= 2.0 resulted in mixed flow (following the terminology of Eurocode 1) where grain slides along the wall during discharge above the ef-fective transition and remains stagnant below the effec-tive transition – located atH/D= ca. 0.7 (more details in [1]).
The degree of load asymmetry due to eccentric filling is demonstrated and compared to the worst case observed, i.e., eccentric discharge through an orifice located at a distance of 0.7 of the floor radius from the silo center-line. The presence of a nonsymmetric flow obstruction on the silo wall is found to cause dangerous local loads similar to eccentric discharge. Considerable nonunifor-mity in the load is observed during testing of a cylindri-cal obstruction immersed in grain supported on the silo floor with its axis parallel to the silo centerline. The me-chanisms of these phenomena are still poorly under-stood, and a satisfactory theoretical description cannot be given.
observed progress in design would not bring about sig-nificantly better designs since the inaccuracy of the ana-lysis was due to the uncertainty in the magnitude or dis-tribution of the loading. To account for the inherent variability of granular material properties, recently for-mulated codes (e.g., Eurocode 1 [7]) that recommended using upper and lower estimates of parameters were ap-plicable for obtaining maximum loads.
The results presented in this paper were selected from several different research projects that demonstrate asymmetric pressure distribution in flat floor, corru-gated-walled, metal silos created by additional sources within the grain mass.
2 Equipment and Procedure
The majority of tests reported in this article were con-ducted in a flat floor, corrugated-walled model silo which was 1.83 m in diameter and 5.75 m in height (filled to a maximumH/Dof 3.0). These bins exhibited mixed flow [7] during discharge with the grain sliding along the wall above the effective transition and grain remaining stagnant below the effective transition (lo-cated at a height to diameter ratio, H/D of ca. 0.7, see [1]). The wall and floor of the silo were each supported independently on three load cells, Figure 1. The silo was constructed to isolate the vertical wall loads from the floor loads. The load cells supporting the silo wall and silo floor are evenly spaced around the circumference of the silo at an angular distance of 120°.
This type of experimental configuration allows for the determination of vertical wall and vertical floor loads, as
well as the calculation of overturning moments on the walls and floor of the silo. With the exception of the tests involving eccentric filling, the silo was centrally filled from a spout at a flow rate of ca. 2600 N/min, up to an initialH/Dvalue of 2.75 (if not stated otherwise). After filling, the grain was allowed to equilibrate follow-ing detention for a period of 0.5 h. The silo was then dis-charged through a centric orifice that produced a sliding velocity along the bin wall with a mass flow of 3.1 m/h. The wall and floor loads were measured during loading, detention and discharge at 30 s intervals, until discharge was completed. In general, the loads were measured with an accuracy of±20 N and±50 N in the larger silo. Three studies are summarized below:
1. Tests with eccentric filling and eccentric discharge were conducted in a 2.44 m diameter silo that was filled to anH/D of 2.0 for each test. The model silo was filled using a movable filling chute located along the radial line, coinciding with one of the major axis of the silo at an eccentricity ratio (ER– distance from the bin centerline divided by the silo radius) of 0, 0.5 and 0.75. Grain was discharged from one of five dis-charge orifices located at anERof 0,±0.5 and±0.75 (further details in Molenda et al. [8]).
2. Tests regarding load asymmetry due to obstructions attached to the silo wall were conducted using plane, i.e., two-dimensional or three-dimensional obstruc-tions. The plane obstruction was an annular segment spanning 60° along the wall circumference and had a surface area of 0.189 m2or 7.2% of the bin cross-sec-tional area. The three-dimensional obstruction (block) used the base of the two-dimensional obstruc-tion was 0.5 m high and constructed using smooth, galvanized steel. Obstructions were attached to the wall with their upper base atH/Dratios of 0.38, 0.81 and 1.26. These locations placed the obstructions within the stagnant zone, within the transition zone between stagnant grain and funnel flow, and in the mass flow zone. The lateral pressure was measured using earth pressure cells. Two Geokon 3500 pressure cells (Lebanon,New Hampshire) with a 100 kPa range and an accuracy of 0.25% of full scale (± 250 Pa), were used for measuring the grain pressure.
3. The loads were determined on a cylindrical obstruc-tion with a three-legged support structure that rested on three load cells fixed to the silo floor. The obstruc-tion had a diameter of 0.445 m and a height of 0.675 m, and its base positioned at an H/D of 0.38. Two radial positions were tested: centerline (eccentri-city ratio ER= 0) and at a distance of 0.5 times the silo radius from the centerline (ER= 0.5).
All tests were conducted with soft red winter wheat with a moisture content of ca. 13% (wet basis) and an un-compacted bulk density of ca. 760 kg/m3.
3 Results
3.1 Eccentric Loading and Discharge
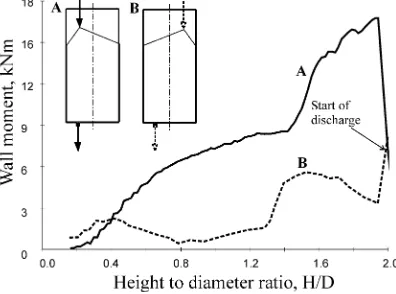
Figure 2 shows the resultant wall moments for eccentric discharge located at values ofERof +0.7 and –0.7, and discharge through the orifice located at anERvalue of +0.75. For test condition A, the filling chute and dis-charge orifice were on the same side of the Y-axis (marked as “+”), and the wall moment after initiation of discharge increased from 6.95 to 17.50 kNm. As unload-ing continued, the wall moment decreased rapidly from a maximum moment of 17.7 kNm atH/D= 2.0, down to a moment of ca. 8.0 kNm, atH/D= 1.5. During the re-mainder of the unloading, the moments decreased at a much slower rate. For the test condition B, in which the location of the filling chute and discharge orifice are on opposite sides of theY-axis, the wall moment decreased from 8.30 to 3.20 kNm, after discharge was initiated. After the initial ramp down, the wall moment increased slightly during discharge but never reached the static va-lue measured during filling. Eccentric discharge fol-lowed by eccentric filling either magnified or reduced the nonuniformity of the stress distribution within the silo, depending on the location of the filling and dis-charge gates.
3.2 Obstructions Attached to the Wall
3.2.1 Asymmetry of Wall Load
The components and resultant wall moment during loading and discharge for a two-dimensional obstruction mounted on the wall atH/D= 0.38 in the (+x,+y) quad-rant, are shown in Figure 3a. This condition produced a resultant wall moment reaching a maximum of 2.1 kNm at the end of filling. This was approximately double the
wall moment that was observed in the bin with no ob-struction. After discharge initiation, the resultant wall moment rapidly decreased to 1.6 kNm and remained re-latively constant until anH/Dratio of 1.8, when the mo-ment ramped down to 1.0 kNm. During further dis-charge, the moment remained constant until an H/D
ratio of 1.0, when the moment decreased consistently to zero. The resultant moment,M, and its componentsMx andMyacting on the silo wall with a 3D obstruction at-tached at an H/D of 0.38 in the (+x, +y) quadrant, is shown in Figure 3b. Under these conditions,Mreached a maximum of 2.7 kNm at the end of filling and deten-tion, i.e., ca. 300% of the value of the wall moment ob-served in the bin with no obstruction. The initiation of discharge resulted in an immediate decrease of M to 2.4 kNm, followed by a continuous decrease with some fluctuations during mass flow. A ramp down from 1.9 kNm to 1.4 kNm was observed at anH/Dof ca. 1.8, coincident with the change in the flow pattern from mass flow to funnel flow.
3.2.2 Wall Pressure Above and Below Obstruction
The distribution of horizontal pressure within the bin was significantly influenced by obstructions, Figure 4. In the case without an obstruction, Figure 4a, both pressure cells measured a value of ca. 5 kPa at the end of filling. The onset of discharge resulted in a sharp increase in the horizontal pressure measured atH/Dvalues of 0.66 to 13 kPa. The pressure decreased with fluctuations until anH/Dof 1.8 when the flow pattern changed from mass to funnel flow. The horizontal pressure at anH/Dof 1.1 initially ramped up to 7.5 kPa, but decreased to less than 4 kPa during further unloading. With the plane obstruc-tion mounted at anH/Dof 0.81, Figure 4b, the horizon-tal pressure was ca. 5 kPa after filling. The initiation of discharge resulted in the horizontal pressure increasing Fig. 2: Wall moments produced during eccentric filling and
eccentric unloading of the bin, through discharge orifices located at anERof 0.7, on common (A) and opposite (B) sides of the bin axis.
by 440% to 24 kPa above the obstruction, and it re-mained above 10 kPa with considerable fluctuations un-til anH/Dvalue of 1.8, when the pressure decreased ra-pidly to zero. Below the obstruction, the horizontal pressure remained less than 6.5 kPa during unloading. Large disturbances in the pressure distribution result in bending moments acting on the wall shell both in the cir-cumferential and meridional direction, which may lead to damages such as those reported by Blight [9]. A four to five fold change in local horizontal pressures re-corded by the pressure cells at discharge initiation were associated with a dynamic increase in the vertical wall load of 110%. Figure 4 also shows Janssen’s estimation of horizontal pressure (with values of m= 0.4 and K =
0.42) at a height of attachment of the lower pressure cell of 1.2 m, i.e. anH/Dof 0.66. The readings of the pres-sure cell show strong fluctuations and lie below the the-oretical curve, particularly in the case where the ob-struction was located above the cell, Figure 4b.
3.3 Loads on Cylindrical Insert Supported on the Bin Floor
In Figure 5, the loads recorded by the three individual load cells OC1, OC2 and OC3 (which supported a cy-lindrical shaped insert located at an H/D of 0.38) are shown during filling, detention and centric discharge. Figure 5a shows the loads acting on the obstruction lo-cated centrically, i.e., ER = 0. The forces increased smoothly during filling and reached final values of 2.2, 1.6 and 1.0 kN for load cells OC1, OC2, and OC3, re-spectively. The twofold difference in vertical forces be-tween OC1 and OC3 was attributed to imperfect centric filling of the bin. During discharge, large irregular fluc-tuations in load were observed in each load cell,
particu-larly during mass flow discharge. These fluctuations were attributed to the sliding of grain against the cylin-der wall during discharge. Strong load asymmetry was observed with the cylinder located at ER= 0.5, Figure 5b. The loads on OC2 and OC3 reached a maximum of ca. 2.3 kN at the end of filling, while the load on OC1 (the closest to the silo axis) did not increase markedly during filling and reached a maximum static value of ca. 0.3 kN. Upon initiation of discharge, the loads on OC2 and OC3 suddenly decreased to 1.0 and 1.4 kN, respec-tively, while the load on OC1 ramped up to a value of 1.7 kN. The decreased loads on OC2 and OC3 were a re-sult of decreased vertical loads that were characteristic of a dynamic stress state. The increased load on OC1 can be attributed to the switch to an axial-symmetric stress state due to centric discharge. During further dis-charge, the loads continually decreased without large fluctuations.
4 Summary and Conclusions
Due to the ability of granular materials to transfer shear stress, the distribution of pressure in a silo may be un-even and discontinuous. Frictional forces act between dividual grains at their points of contact and create in-ternal friction. The magnitude and direction of these forces are not defined until sliding occurs. Tests in model silos filled with dry wheat have shown a considerable de-gree of load asymmetry generated by eccentric loading and eccentric structural members attached to the wall, as well as on an obstruction immersed in grain.
Eccentric filling of the silo atER= 0.7 up to anH/Dof 2.0 resulted in wall bending moments of up to 7.9 kNm. Eccentric discharge, i.e., ER = 0.7, after centric filling created a maximum dynamic wall moment of 11.3 kNm. Eccentric filling followed by eccentric discharge either magnified or reduced the nonuniformity of the stress Fig. 4: Wall pressure measured at heights 1.2 m (H/D= 0.66) and
2.0 m (H/D= 1.1): (a) without an insert attached, and (b) with plane insert attached at height of 1.5 m (H/D= 0.81).
distribution in the silo, depending on the location of the filling and discharge gates. In the case with both gates on the same side of the silo, the wall moments increased from 6.9 to 17.5 kNm. In the case where the filling chute and discharge orifice were located on opposite sides of the silo, the wall moments decreased from 8.3 to 3.2 kNm, following discharge initiation.
The attachment of a 2D or 3D obstruction to the wall re-sulted in considerable asymmetry of the wall load distri-bution. The plane obstruction had the form of an annu-lus segment of 60° in circumferential extension and a width of 0.154 m (i.e., surface area of 7.2 % of the silo floor area). A three-dimensional obstruction was shaped as a block with two identical bases as the plane obstruc-tion and a height of 0.5 m. The plane obstrucobstruc-tion and upper base of the block obstruction were attached to the wall atH/Dratios of 1.26, 0.81 and 0.38. Wall overturn-ing moments of ca. 1 kNm were observed duroverturn-ing centric loading with no obstruction, even in conditions of near symmetry. The attachment of an obstruction resulted in an increased moment. The highest wall moment of 2.7 kNm was found at the end of filling the bin with the block attached at an H/D of 0.38. The moment with a plane obstruction in the same condition was measured as 2.1 kNm. The maximum moment measured in this bin for eccentric unloading with no obstruction was 3.5 kNm. For higher locations of the obstruction on the wall, the wall moments were approximately 50 % of the value at anH/Dof 0.38.
Meridional distribution of horizontal pressure for filling was found at lower values than Janssen’s estimation, particularly below the obstruction. A sudden increase in horizontal pressure was observed at the onset of dis-charge. A maximum pressure increase of 2.5 times the static pressure was observed in the case without an ob-struction attached to the wall. The dynamic pressure in-creases above the obstruction reached a maximum of four times the static pressure. Conversely, the dynamic pressure increases below the obstruction were lower than those observed without the obstruction attached. The data indicated that there are considerable addi-tional loads placed on a bin due to obstructions that may form during storage, which are not considered in the design codes.
The vertical loads on the cylinder at the initiation of dis-charge increased, with large fluctuations in vertical
load-ing observed durload-ing unloadload-ing of the bin. For an eccen-trically loaded cylinder, the vertical pressure was lower at the eccentric positions than when located centrically along the centerline of the bin. No clear tendencies were observed with respect to the bending moments acting on the cylinder.
While Janssen’s equation can provide a simple estima-tion of the loads that might act on obstrucestima-tion buried in granular materials, this technique fails to satisfactorily predict a number of effects that alter the vertical loading on these obstructions. Some of these effects include the stress history of the bulk, peak loads at the beginning of discharge, variations in the stress state in the stagnant zone of the materials, load asymmetry and fluctuations and the nonhomogeneity of the material properties ori-ginating from variability of the packing structure of the bulk.
5 References
[1] M. Molenda, J. Horabik, I. J. Ross, Comparison of Loads on Smooth- and Corrugated-Wall Model Grain Bins. In-tern. Agrophys.2001,15, 95–100.
[2] J. M. Rotter, Shell Structures: The New European Stan-dard and Current Research Needs. Thin-Walled Struct.
1998,31, 3–23.
[3] S. Sundaresan, Some Outstanding Questions in Handling of Cohesionless Particles. Powder Technol. 2001, 115, 2–7.
[4] A. Drescher,Analytical Methods in Bin-Load Analysis. Elsevier, Amsterdam-Oxford-New York-Tokyo, 1991, p. 37.
[5] J. Strutsch, J. Schwedes, The Use of Slice Element Meth-ods for Calculating Insert Loads.Bulk Solids Handling
1994,14, 505–512.
[6] H. M. Haydl, Some Practical Aspects of Concrete Silo Design.Bulk Solids Handling1992,12, 41–43.
[7] Eurocode 1,Actions on Structures. Part 4. Actions on Si-los and Tanks. EN 1991-4:2003, European Committee for Standardization, Brussels,2003.
[8] M. Molenda J. Horabik, S. A. Thompson, I. J. Ross, Bin Loads Induced by Eccentric Filling and Discharge of Grain.Trans. ASAE2002,45, 781–785.