UNDERSTANDING AND TARGETING
INDONESIAN YOUNG ADULT INTERNET USERS
Andreas Chang
Jurusan Manajemen, Fakultas Ekonomi dan Bisnis, Universitas Bina Nusantara Jln. K.H. Syahdan No. 9, Palmerah, Jakarta Barat 11480
ABSTRACT
As the number of global internet users increases, companies’ online advertisement expenditure also grows rapidly. Companies face challenges in targeting the right customers. Understanding which websites are often visited by target users and what they do on the internet will help companies direct their online advertisement to the right target. Using questionnaires, this study examines which sites are most often visited by Indonesian young adult internet users and what they do on the internet. It aims to understand the patterns of behavior of these users. The findings of this study provide some understanding to the marketers. Of consequence, such understanding would help them to select where and what to do with their advertisements when they are targeting the young adult internet users in Indonesia.
Keywords: internet advertisement, online advertisement, targeting, young adult internet users
ABSTRAK
Seiring dengan pertumbuhan jumlah pengguna internet global, pengeluaran perusahaan-perusahaan untuk iklan di internet juga meningkat secara cepat. Perusahaan menghadapi tantangan untuk menyasar konsumennya secara tepat dalam memasang iklan. Memahami website mana yang paling sering dikunjungi oleh pengguna dan apa yang dilakukan oleh pengguna internet akan memudahkan perusahaan mengarahkan iklan online-nya kepada konsumen yang tepat. Dengan menggunakan questionnaire, studi ini mendalami situs mana saja yang paling sering dikunjungi oleh pengguna internet dewasa muda dan apa yang mereka lakukan di internet. Studi ini bermaksud menguak pola-pola perilaku ini pengguna internet usia muda. Temuan dari penelitian ini akan memberikan pemahaman bagi para pemasar. Sehingga, pemahaman ini akan membantu mereka memilih dimana dan apa yang harus dilakukan dengan iklan-iklan yang akan mereka pasang pada waktu mereka memilih pengguna internet usia muda di Indonesia.
INTRODUCTION
The number of Internet Users in Indonesia has increased to 30 million people in 2010 (Anonim1, 2010). This makes Indonesia rank 16 of the top 20 countries with the highest number of Internet Users in the World and rank 5 in Asia. However, the number of users represents only 12.3% of the estimated total population of 242,968,342. From the year 2000 to 2008, the growth rate has reached 900% and it is estimated to grow to 1400% in 2010. Boston Consulting Group (Harrison & Lee, 2010) forecasted that the number of people with Internet access in Brazil, Russia, China, India and Indonesia will double by 2015.
The number of young adult users remains the heaviest (Madden, 2010). Nielsen cited in Digital Media Across Asia (Nielsen, 2010) reported in 2008 that almost one third (31.82%) of the Indonesian internet users are aged between 15-19 years old. Projected to 2010, the size of this group of users is 29,885,106 people.
Table 1 (Anonymous1, 2010)
Year Users Population % Pen. GDP p.c.* Usage Source
2000 2,000,000 206,264,595 1.0 % US$ 570 ITU
2007 20,000,000 224,481,720 8.9 % US$ 1,916 ITU
2008 25,000,000 237,512,355 10.5 % US$ 2,238 APJII
2009 30,000,000 240,271,522 12.5 % US$ 2,329 ITU
2010 30,000,000 242,968,342 12.3 % US$ 2,858 ITU
Note: Per Capita GDP in US dollars, source: United Nations Department of Economic and Social Affairs.
Meanwhile, the percentage of Internet users who still ranked newspapers as important or very important sources of information for them decreased from 60 percent in 2008 to 56% in 2009 and print newspaper is below the Internet (78 percent), and television (68 percent). Eighteen percent of Internet users said they stopped a subscription to a newspaper or magazine because they now get the same or related content online – down slightly from 22 percent in 2008, but nevertheless a strong indication that print newspapers can be sacrificed by a significant percentage of Internet users (USC, 2010). This shift seems to cause the internet advertising revenue to hit a record of $5.9 Billion in Q1 of 2010, which is year-over-year increase of 7.5% (IAB, 2010). Online ad spending is expected to rise to $96.8 billion in 2014, with an 11.9 percent compounded annual rate of increase (Bloomberg Businessweek, 2010). Bloomberg (Schweizer, 2010) predicts that Asia-Pacific region will overtake North America as the largest advertising market of $173.2 billion in 2014.
Looking at such a magnitude of market and its trends of increasing in size, one of the challenges for marketers is to understand markets and groups of potential customers on the Internet. Misunderstanding consumer preferences can cause a successful strategy in one country to fail elsewhere (Lynch & Beck, 2001).
Ranganathan and Campbell identified the following challenges as (1) Reaching the right people with the right ads. The first challenge is to deliver the right ads to the right people. We have at one end advertisers with ads for their products and services. At the other end are consumers with their needs. The advertising system needs to match the two to create the greatest possible impact on the customers; (2) Delivering ads at the right time. Even after we narrow down the target audience for a particular ad, we need to ensure that the ad is delivered to the user at a suitable time. It should definitely not be delivered to him when he is in a meeting or is driving; (3) Delivering ads in the best way. Besides the traditional means of delivering ads like print, radio, TV, telemarketing, billboards, email and internet ads, pervasive environments allow newer delivery mechanisms; (4) Serendipitous advertising. Serendipitous advertising is advertising which may not seem to meet a person’s specific needs at that point of time, but which may interest him or her enough to buy the product or at least get more information about it; (5) Providing a means for users to follow up on the ads. Online ads allowed people to click their way to the company’s website directly. Pervasive computing environments can do more. They can allow a user to experience more of the good or service is possible; (6) How should advertising revenue be collected in a pervasive environment?. Pervasive environments pose certain challenges in collecting revenue from advertisers. Should revenue be collected every time an ad is shown or delivered to a person?. Or should it be collected only if the person responds in some ways to the ads?. Or should it depend on how many people were around when the ads was shown?; (7) Privacy and Security. Privacy is a big concern in a pervasive environment. Users’ preferences with regard to advertisements they would like to receive is personal data and should not be exposed to un-trusted parties. The exact mechanism used to deliver advertisements to users is also private information since it could indicate the location of the user or his activity. Any architecture for supporting advertisements should respect the privacy of the consumers in the environment.
Targeting remains another challenge (Anand & Shachar, 2001) because as of June 2010, there are 1,966 millions websites and almost half of them are labeled active by Internet World Stats (IWS, 2010). According to APJII (Indonesian Association of Internet Providers) there are 38,461 domain names registered under .id as of June 2007. (APJII, 2008). Secondly, as pointed out by (Leppaniemi & Karjaluoto, 2005), advertisers need to set up research / measurement / tracking systems to know the target audience.
Understanding consumer behavior on the web has been difficult because the main entities involved, consumers and businesses, have been transformed (Koufaris,2002). First, every consumer is now also a computer user. The online consumer performs all the functions of a traditional consumer on a computer while interacting with a system, i.e., a commercial Web site. S/he, therefore, also exhibits all the characteristics of a computer user. Second, the physical store has been transformed into a virtual store through information technology (IT).
Top 10 Global Web Parent Companies, Home & Work (August 2010)
Rank Parent Unique Audience (000) Active Reach %
1 Google 205,814,883 87.79%
2 Microsoft 180,098,857 76.82%
3 Facebook 118,840,955 50.69%
4 Yahoo! 100,511,198 42.87%
5 eBay 95,426,342 40.70%
6 Wikimedia Foundation 87,394,392 37.28%
7 Amazon 54,444,795 23.22%
8 Apple Computer 49,831,728 21.26%
9 Telefonica/Terra 45,830,250 19.55%
10 InterActiveCorp 43,291,706 18.47%
Source: Nielsen NetView (Nielsen)
According to Nielsen survey in 2008, Indonesian do the following things on the internet:
RESULTS AND DISCUSSION
Table 1 On Average, How Many Hours Do You Use the Internet
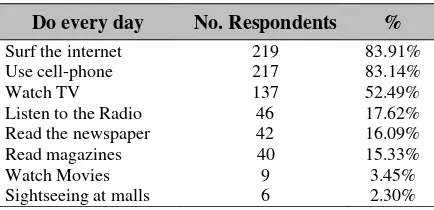
83.91% of the respondents always use their cell phone and 83.14% of them always surf the internet every day. Only 16.09% of the respondents read the news paper. However, more than half of them 52.49 watch TV every day (Table 2).
Table 2 What Do You Always Do Every Day? (you can give more than 1 answer)
Do every day No. Respondents %
Second, what they do when they surf the internet. Most of the subjects (86.97%) use internet for of them use social networking sites (SNS) and of these, 86.97% use Facebook and 41.76% twitters. Other favorite use of the internet is for searching for news, information or new data (83.52%), reading news/information or data (68.58%), and file sharing (42.53%) (Table 3).
Table 3 When You Use the Internet, You: (you can give more than 1 answer)
Do when use the internet No. Resp. %
Use social networking sites like Face Book /My Space 227 86.97%
download music, songs, photos or movies 218 83.52%
Read news/information or data 179 68.58%
Use twitters 119 45.59%
share art work, photo, stories or videos 111 42.53%
play games 104 39.85%
Read or write email 85 32.57%
Buy books, clothing, accessories, music or other products 48 18.39%
Write in blogs 8 3.07%
Others 4 1.53%
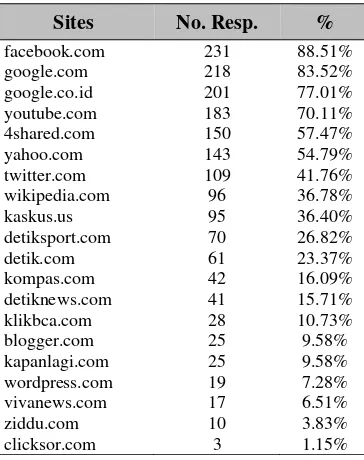
Table 4 Most of Them Visited Sites (you can give more than 1 answer)
Sites No. Resp. %
Fourth, how do they learn about new products or services.Internet (81.61%) appears to be the main source of information about new product or services, followed by television (77.01%), magazines (45.98%) and billboards (38.70%) and newspaper (34.87%) (Table 5).
Table 5 In General, Where Do You Get Information about New Products Or Services?
(you can give more than 1 answer)
Sources of Information No. Resp. %
Direct Mail/brochures/flyers 75 28.74%
Radio 70 26.82%
Exhibition in malls etc 69 26.44%
Advertisement in Movies 56 21.46%
CONCLUSION
To target this group of internet users, marketers need to place their advertisements on search engines, Social Networking Sites (SNS) and news portals. Other interesting sites are Youtube and 4shared.com where they can up/download files.
REFERENCES
Anand, N.B., and Shachar, R. (December, 2001). Advertising, the matchmaker, Tel-Aviv University, Israel: Mimeo.
Anonymous. (2010). IAB PwC. Retrieved from
http://www.iab.org.nz/images/uploads/IAB%20PwC%20Insight%20Report%20Q2%202010 %20Final.pdf.
Anonymous. (2010). Indonesia internet usage and telecommunications reports. Miniwatts Marketing Group, Internet Usage and World Population Statistics Copyright © 2000 – 2010, New York: Internet World Stat.
Anonymous. (April, 2010). PwC IAB internet advertising revenue report. Retrieved from http://www.iab.net/media/file/PwC-2009-Full-Year-Presentation.pdf.
Bloomberg Businessweek. (2010). Global online ad spending to rise 12 pct in 2010. New York: Associated Press.
Harrison, C., and Lee, M. (2010). BRICs, Indonesia to double internet use, report says. Boston Consulting Group. Retrieved on September 10, 2010, from
http://www.businessweek.com/news/2010-09-01/brics-indonesia-to-double-internet-use-report-says.html.
IAB. (2010). Internet advertising revenues hit $5.9 Billion in Q1'10, Highest First-Quater Revenue
Level on Record. New York: Interactive Advertising Bureau.
Koufaris, M. (2002). Applying the technology acceptance model and flow theory to online consumer behavior. Information Systems Research, 2002 INFORMS, 13(2), June 2002, 205–223.
Leppaniemi, M., and Karjaluoto, H. (2005). Factors influencing consumers' willingness to accept mobile advertising: A conceptual model. Int. J. Mobile Communications, 3(3), 197.
Lynch, P. D., and Beck, J. C. (2001). Profiles of internet buyers in 20 centuries: Evidence for Region-Specific Strategies. Journal of International Business Studies, 32(4), (4th Qtr), 725-748.
Madden, M. (August 27, 2010). Older adult and social media, Washington, DC: PewInternet and American Life Report.
Ngai, E. (2002). Selection of websites for online adverstising using AHP. Information and
Management.
Nielsen. (2010). Indonesia: Internet penetration, Seattle, WA: Digital Media Accross Asia.
Ranganathan, A., and Campbell, H.R. (2002). Advertising in a pervasive computing environment. The
2nd International Workshop On Mobile Commerce (pp.10-14), Atlanta, Georgia, USA:
International Workshop on Mobile Commerce.
Rowley, J. (2004). Just another channel? marketing communications e-business? marketing
intelligence and planning.
Schiffman, L.G., and Kanuk, L.L. (2007). Consumer behavior, 9th ed., Saddle River, New Jersey, USA: Pearson Prentice Hall.
Schweizer, K. (2010). Asia-pacific to pass north america as biggest ad market in 2014. New York: Bloomberg.