Discrimination of Mangrove... (Arfan)
Discrimination of Mangrove Ecosystem Objects on the Visible Spectrum Using
Spectroradiometer HR-1024
Amal Arfan
Jurusan Geografi, FMIPA Universitas Negeri Makassar
Corresponding E-mail:[email protected]
Abstract
The study was conducted to determine whether the vegetation in the mangrove ecosystem, can be contrasted with another objectt, using Spectroradiometer HR-1024. The data used is data visible spectrum(400-700 nm) which resulted in 204 bands. The analysis used is the integrated analysis with three levels. First, using ANOVA to determine significant differences in spectral reflectance between vegetation with water, wet soil and dry soil. Second, using Step wise Canonical Discriminant Analysis to identify the most sensitive band for discrimination reflection spectrum. This analysis which resulted in six bands are considered practical to distinguish vegetation with another object namely 401.5 nm, 416.9 nm, 508.2 nm, 599.3 nm, 660.3nm and 689.2 nm. Third using the Jeffries-Matusita separability index which resulted in the separation index of mangrove vegetation, water, wet soil and dry soil is 1.414.
Keywords:Mangrove ecosystem, Object, Spectroradiometer HR-1024, Stepwise Canonical Discriminant Analysis, Jeffries-Matusita
Abstrak
Penelitian dilakukan untuk mengetahui apakah vegetasi di ekosistem mangrove dapat dibedakan dengan obyek yang lain
dengan menggunakan Spectroradiometer HR-1024. Data yang digunakan adalah data spektrum tampak (400 – 700 nm)
yang menghasilkan 204 band. Analisis yang digunakan adalah analisis terpadu dengan tiga tingkatan. Pertama, menggunakan ANOVA untuk mengetahui perbedaan signifikan pantulan spektrum antara vegetasi dengan air, tanah basah dan tanah kering. Kedua, menggunakan Canonical Stepwise Discriminant Analysis untuk mengidentifikasi band paling sensitif untuk diskriminasi pantulan spektrum. Analisis ini menghasilkan enam band yang dianggap praktis untuk membedakan vegetasi dengan obyek yang lain yaitu 401.5 nm, 416.9 nm, 508.2 nm, 599.3 nm, 660.3 nm and 689.2 nm. Ketiga, menggunakan indeks keterpisahan Jeffries-Matusita yang menghasilkan indeks keterpisahan vegetasi mangrove dengan air, tanah basah dan tanah kering yaitu 1,414.
Kata kunci: Ekosistem mangrove, Obyek, Spektroradiometer HR-1024, Canonical Stepwise Diskriminan Analisis, Jeffries-Matusita
Introduction
Generally, mangroves are typical species found in the intertidal and sub-tropics in the whole world. Mangroves form a habitat for many species of flora and fauna ,with high density (Murray et al. 2003;. Sheridan & Hays, 2003;. Liu et al., 2008;. Nagelkerkenetal, 2008). Mangroves have also an important role for humans for various reasons, including fisheries, agriculture, forestry, building material resources, protection against coastal erosion and storm, the absorption of pollutants, and supporting coastal fisheries (Hogarth 1999; Manson et al., 2005; Waltersetal, 2008; Howari et al., 2009).
In recent decades, mangroves loss have significantly influential in the world although in some parts of the world their areas are still very large (Spalding 1998;
application with the advantages in cost and effectiveness, but they are mainly confined to the district scale because of the relatively coarse space and spectral resolution (Aschbacher et al, 1995 ; Ramsey and Jensen, 1996; GAO, 1999, Green et al., 2000 ; Sulong et al., 2002; Vaiphasa et al., 2005).
Classification of the various environment features using remote sensing particularly for the object in the mangrove ecosystem requires an understanding of the nature of spectral features and response in different parts of the electromagnetic spectrum region. Knowledge of the spectral response of objects and materials leads to the guidance to determine the characteristics of objects and materials. Research on spectral provides options select a specific bandwidth or bandspektral to distinguish various environmental features (Ajithkumar et al., 2008; Chun et al., 2011).
Spectral response measurements in the field can be done by hand spectroradiometer, which can be operated easily. Measurement of Reflectance directly in the field can be used to get more detailed information about the spectral behavior of object (Danoedoro, 2012). Kamaruzaman and Kazawani (2007) have conducted a research in Tok Bali, Kelantan and Setiu, Terengganu, Malaysia, to determine the spectral properties (reflectance in the
visible and NIR wave) using spectroradiometer, but this only identifies significant wave length in distinguishing five mangrove species. Meanwhile, this study was conducted to determine the reflectance response of mangrove ecosystems, including mangrove species, water, wetlands and dry land using HR-1024 Spectroradiometer.
Research Method
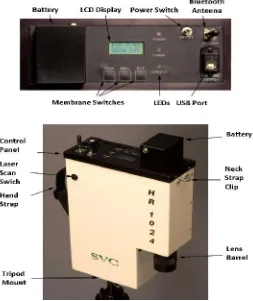
This study emphasizes the object of the mangrove ecosystem consisting of vegetation in the mangrove ecosystems (Avicennia marina, Rhizophora apiculata, Rhizophora mucronata and Sonneratia alba), water, wet soil and dry soil. The tools used are Spectroradiometer HR-1024 (Figure 1). At data retrieval, distance between objects with Spectroradiometer HR1024 is ± 0.5 m. For high vegetation, healthy leafy branches are selected and cut, then immediately measured to maintain the quality of the leaves. Reflectance data are measured in the outdoor areas in a good weather condition and on a sunny day.
Spectral analysis method is based on three integrated levels. In the first level, ANOVA is used to test a significant difference between the average
reflectance of vegetation (V) and the three other bodies of water (W), wet soil (WS), dry soil (DS). The hypothesis of this study is that the reflectance between the vegetation pairs and each objects (W, WS and DS) is significantly different at each wave length which is measured 400-700 nm. Zero hypothesis, Ho: µ1 = µ2, µ1 = µ3, µ1 = µ4 versus the alternative hypothesis, Ha: µ1 = µ2, µ1 = µ3, µ1 = µ4 where: µ1, are the values of the average reflectance of vegetation and µ2, µ3, µ4 are the reflectance values of water, wet soil and dry soil. Furthermore, ANOVA is tested with a 95% confidence level (p <0:05).
Canonical Step wise Discriminant Analysis is conducted on the reflectance range 400-700 nm. This analysis identifies the variables which maximizes the difference among the species groups, but at the same time minimizes the difference within the groups. On this analysis, independen spektral variabels are put into the model if those four variables fulfill a significant level together (F-test).
Distance analysis is needed to identify the best band or combination of bands which can be used for spectral separation of vegetation with water, wet soil and dry soil. The separateness index which is used is the analysis of JEM distance (Jeffries Matusita) (Schmidt and Skidmore 2003;. Ismail et al., 2007; Vaiphasa, et al, 2007;. Adam and Mutanga, 2009). The band used in the JEM analysis is the band resulted from a process using Stepwise Discriminant Canonical Analysis. JEM has upper and lower limits that vary between 0 and v2 (= 1.44). Higher values indicate a total separation of the couple classes in the band which is used (Richards, 1993; Erdas Field Guide, 2005). JEM distance calculations in this study are based on the equation (1).
In the equation, i and j are the spectral responses of the two objects which are compared; C is the covariance matrix of the spectral response; m is an average vector of spectral response; 1n is the natural logarithm function; T is a transposition functions; and | C | is the determinant of C.
Results and Discussion
Discrimination object using spetroradiometer in mangrove ecosystems at visible wavelengths (400 -700 nm) is still rarely performed. However, the use of field spectroradiometer to discriminate species has done for many times for field and laboratory measurements (Schmidt and Skidmore, 2003 Bellucoetal, 2006; Brown, 2004; Rossoetal, 2005;
Pengraetal, 2007; Kamaruzaman and Kasawani 2007; and Mutanga Adam, 2009; Vaiphasa et al., 2005; Enrica et al., 2006). In this research, the elimination of redundant data and the identification of relevant data uses discriminant analysis in a condition that the dimensional reduction does not cause loss of information related to the object of the research (Adam and Mutanga, 2009)
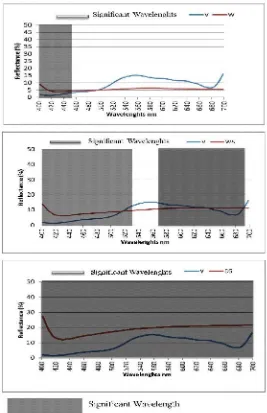
ANOVA test result at the 95% confidence level (p <0:05) indicates that there are significant differences in spectral reflectance between all pairs of classes (V vs W, V vs. WS, and V vs DS) at n = 412 wavelengths. Highlighted significant wavelength uses a histogram for each individual class pairs. ANOVA test result for each pair of classes (V vs W, V vs. WS, and V vs DS) is shown in Figure 2 (a, b, and c). The shaded areas show the wavelength where the spectral reflectance of vegetation were statistically different from the three other objects, with a 95% confidence level (p-value <0:05).
ANOVA test result presented in Figure 2 shows that there is a significant difference between the average reflectance of vegetation and each of the three objects studied (W, WS and DS). In the next test that is Tukey Test, the significant difference is only at a wavelength of 400 - 450.8 nm. For vegetation and wet soil, the reflectance is significantly different at a wavelength of 507 nm 533.5 nm and 568 nm -697.4 nm or for blue spectrum area. Furthermore, for vegetation and dry soil, the reflectance is significantly different at a wavelength of 400-700 nm or blue, green and red spectrum areas. Spectral reflectance curve for healthy green vegetation almost describes the peaks and valleys. Valley as a part of
Figure 2. The significances between average reflectance: (a) Vegetation(V) with water (W), (b) Vegetation (V) with wet soil (WS), (c) Vegetation (V) with dry soil (DS)
the spectrum is determined by the pigment in the leaves of plants. Chlorophyl, for example, strongly absorbs energy in a wavelength band centered around 0.450 and 650 nm. Meanwhile, some of the factors that influence the soil reflectance are the water content, the soil texture (proportions of sand, silt, and clay), the surface roughness, the presence of iron oxide, and the content of organic metter (Lillesand and Kiefer, 1970).
Canonical Stepwise Discriminant Analysis may help to identify the most sensitive wavelengths in distinguishing objects in mangrove ecosystems (Zhao and Maclean, 2000; Thenkabail et al., 2004; Van Aardt and Wyne, 2007; Kamaruzaman and Kasawani, 2007; Al et al., 2010 ; Pu et al., 2011). In this research, Canonical Stepwise Discriminant Analysis is also applied to each class of object pairs
(V vs W, V vs. WS, and V vs DS) so that the misclassification error rate is very low (Zhao and Maclean, 2000; Thenkabail et al, 2004; Van Aardt and Wyne, 2007; Kamaruzaman and Kasawani, 2007; Al et al., 2010; Pu et al,. 2011). Discriminant analysis will help to analyze the differences between groups and/or provide a means to determine (classify) any cases (Klecka, 1980).
JEM is applied to reveal the spectral separation between each pair of objects in the mangrove ecosystem. Based on Table 1, it can be seen that the separation between high object is that all values reach 1,414. JEM distance method provides value between 0-v2 (= 1,414), so the square distance provides a number between 0 and 2 (Thomas et al., 2003). In conclusion, the object of discrimination in the mangrove ecosystem is quiet good.
Conclusion
Field spectrometer measurements at the level of the canopy can be used to distinguish vegetation from water, wet soil, and dry soil. It means that the average spectral reflectance of vegetation is different from other objects related to it in the same ecosystem
(mangrove). The application of Stepwise Discriminant Analysis Canonical has revealed that the greatest discrimination power of the vegetation is the wavelength of 401,5nm, 416.9 nm, 508.2 nm, 599.3 nm, 660.3 nm and 689.2 nm. It is found from the analysis that the separation of objects in the mangrove ecosystem (V vs W, V vs WS, dan V vs DS) is quite high. Thus, the object of discrimination in the mangrove ecosystem can be adequately conducted using this technique.
Acknowledgement
Special thanks to the University of Kebangsaan Malaysia (UKM), which has lent Spectroradiometer instrument HR-1024 and also to the Governor of South Sulawesi who has been providing financial assistance.
References
Adam, E., & Muntanga, O. 2009. Spectral discrimination of papyrus vegetation (Cyperuspapyrus L.) in swamp wetlands using field spectrometry. ISPRS Journal Photogrammetry and Remote Sensing ,64 (2009), 612-620.
Ajithkumar, T.T., Thangaradjou, T., & Kannan, L. 2008.Spectral reflectance properties of mangrove species of the Muthupettai mangrove environment, Tamil Nadu.Journal of Environmental Biology, 29(5), 785-788. Al, C,. Liao NF., Tian LX., Shi YX., & Li, B.J. 2010. Identification of cucumber disease using hyperspectral
imaging and discriminate analysis. Guang Pu Xue Yu Guang Pu Fen X, 30(5), 1357-61.
Alongi, D.M. 2002. Present state and future of the world’s mangrove forests. Environ. Conserv, 29, 331-349. Aschbacher, J., Tiangco, P., Giri, C.P., Ofren, R.S., Paudyal, D.R., & Ang, Y.K. 1995. Comparison of different sensors and analysis techniques for tropical mangrove forest mapping.In: Proceedings of the International Conference IGARSS, 2109-2111.
Belluco, E., Camuffo, M., Ferrari, S., Modenese, L., Silvestri, S., Marani, A., & Marani, M. 2006. Mapping salt-marsh vegetation by multispectral and hyperspectral remote sensing. Remote Sensing of Environment, 105 (1), 54-67.
Berlanga-Robles, C.A., & Ruiz-Luna, A. 2002. Land use mapping and change detection in the coastal zone of northwest Mexico using remote sensing techniques. Journal of Coastal Research, 18, 514-522.
Brown, K. 2004. Increasing classification accuracy of coastal habitats using integrated airborne remote sensing. EAR SeL Proceedings, 3 (1), 34-42.
Chun, B. B., Jafri, M.Z.M., & San, L.H. 2011. Reflectance Characteristic of Certain MangroveSpecies at Matang Mangrove Forest Reserve,Malaysia. Proceeding of the 2011 IEEE International Conference on Space Science and Communication (IconSpace) 12-13 July 2011, Penang, Malaysia.
Danoedoro, P. 2012. Pengantar Penginderaan Jauh Digital.Yogyakarta.
Enrica, B., Monica, C., Sergio, F., Lorenza, M., Sonia, S., Alessandro, M., & Marco, M. 2006. Mapping salt-marsh vegetation by multispectral and hyperspectral remote sensing. Remote Sensing of Environment, 105 (1), 54-67.
ERDAS Field Guide.2005. Leica Ecosystems Geospatial Imaging.LLC.
Gao, J. 1999. A comparative study on spatial and spectral resolutions of satellite data in mapping mangrove forests.International Journal of Remote Sensing , 2823-2833.
Howari, F. M., Jordan, B. R., Bouhounce, N., & Wyllie-Echeverria, S. 2009. Field and remote-sensing assessment of mangrove forests and seagrass beds in the Northwestern Part of the United Arab Emirates.Journal of Coastal Research, 25(1), 48-56.
Ismail, R., Mutanga, O., & Ahmed, F. 2007. Discriminating Sirex noctilio attack in pine forest plantations in South Africa using high spectral resolution data. In: Kalacska, M., Sanchez Azofeifa, A. (Eds.), Hyperspectral Remote Sensing of Tropical and Sub-Tropical Forests. Taylor and Francis, CRC Press, Routledge, USA, 350.
Kamaruzaman, J., & Kasawani, I. 2007. Imaging spectrometry on mangrove species identification and mapping in Malaysia. Wseas Transctions on Biology and Biomedicine, 8 (4) , 118-126.
Klecka, W. R. 1980. Discriminant analysis. Beverly Hills, CA: Sage.
Lillesand, T.M., & Kiefer, R.W. 1970. Remote Sensing and Image Interpretation.Wiley, Chichester.
Liu, K., & Li, X. 2008. Monitoring mangrove forest changes using remote sensing and GIS data with decision-tree learning wetlands. The Society of Wetland Scientists, 28(2), 336–346.
Manson, F.J., Loneragan, N.R., & Phinn, S.R. 2005. Spatial and temporal variation in distribution of mangroves in Moreton Bay, subtropical Australia: a comparison of pattern metrics and change detection analysesbased on aerial photographs. Estuarine, Coastal and Shelf Science, 57, 653-666.
Murray, M. R., Zisman, S. A., Furley, P. A., Munro, D. M., Gibson, J., & Ratter, J.2003.The mangroves of Belize Part 1.Distribution, composition and classification.Forest Ecology and Management, 174(1-3), 265–279. Nagelkerken, I., Blaber, S. J. M., Bouillon, S., Green, P., Haywood, M., & Kirton, L. G. 2008. The habitat
function of mangroves for terrestrial and marine fauna: A review. Aquatic Botany,89, 155–185.
Pengra, B.W., Johnston, C.A., & Loveland, T.R. 2007. Mapping an invasive plant, Phragmites australis, in coastal wetlands using the EO-1 Hyperion hyperspectral sensor. Remote Sensing of Environment,108 (1), 74-81.
Ramsey, E.W., & Jensen, J.R. 1996. Remote sensing of mangrove wetlands: relating canopy spectra to site-specific data. Photogrammetric Engineering and Remote Sensing,62, 939-948.
Richards, J.A. 1993. Remote Sensing Digital Image Analysis: An Introduction. Springer-Verlag, Berlin. Rosso, P.H., Ustin, S.L., & Hastings, A. 2005.Mapping marshland vegetation of San Francisco Bay, California,
using hyperspectral data.International Journal of Remote Sensing, 26 (23), 5169-5191.
Schmidt, K.S., & Skidmore, A.K. 2003. Spectral discrimination of vegetation types in a coastal wetland. Remote Sensing of Environment , 85 (1), 92-108.
Sheridan, P., & Hays, C. 2003. Are mangroves nursery habitat for transient fishes and decapods Wetlands, 23(2), 449–458.
Spalding, M.D. 1998. Patterns of biodiversity in coral reefs and mangroves: global and local scales.Ph.D.Thesis. University of Cambridge, U.K.
Sulong, I., Mohd-Lokman, H., Mohd-Tarmizi, K., & Ismail, A. 2002. Mangrove mapping using Landsat imagery and aerial photographs: Kemaman District, Terengganu. Malaysia Environment, Development and Sustainability, 4, 135-152.
Thenkabail, P.S., Eden A., Enclona, E.A., Mark, S., Ashton, M.S., & Van Der Meer, B. 2004. Accuracy assessments of hyperspectral waveband performance for vegetation analysis applications.Remote Sensing of Environment,91, 345 – 376.
Vaiphasa, C., Ongsomwang, S., Vaiphasa, T., Skidmore, A.K. 2005. Tropical mangrove species discrimination using hyperspectral data: A laboratory study. Estuarine, Coastal, and Shelf Science, 65 (1-2), 371-379. Van Aardt, J.A.N., & R.H. Wynne. 2007. Examining pine separability using hyperspectral data from an
airborne sensor: An extension of field-based results. International Journal of Remote Sensing, 28, 431-436.
Walters, B.B., Ronnback, P., Kovacs, J.M., Crona, B., Hussain, S.A., Badola, R., Primavera, J.H., Barbier, E., & Dahdouh-Guebas, F. 2008. Ethnobiology, socio-economics and management of mangrove forests: A review. Aquat. Bot, 89, 220-236.