© The Author 2013. Published by Oxford University Press on behalf of the American Association for Public Opinion Research. All rights reserved. For permissions, please e-mail: [email protected]
CODING VOTER TURNOUT RESPONSES IN THE
CURRENT POPULATION SURVEY
ARAM HUR
CHRISTOPHER H. ACHEN*
Abstract The Voting and Registration Supplement to the Current Population Survey (CPS) employs a large sample size and has a very high response rate, and thus is often regarded as the gold standard among turnout surveys. In 2008, however, the CPS inaccurately estimated that presidential turnout had undergone a small decrease from 2004. We show that growing nonresponse plus a long-standing but idiosyncratic Census coding decision was responsible. We suggest that to cope with nonresponse and overreporting, users of the Voting Supplement sample should weight it to reflect actual state vote counts.
The Current Population Survey of American Voter
Turnout
In the United States, the Census Bureau’s widely respected Voting and
Registration Supplement to the Current Population Survey (CPS)1 has long
been based primarily on in-person interviews to ensure data quality (U.S.
Aram Hur is a PhD candidate in the Politics Department at Princeton University, Princeton, NJ, USA. Christopher H. Achen is a professor in the Politics Department at Princeton University, Princeton, NJ, USA. An earlier version of this research note was presented at the McGill-Princeton Workshop on the Overreporting of Voter Turnout, November 4–5, 2010, at McGill University, Montreal, Quebec, Canada, and May 6, 2011, at Princeton University. The authors are grateful for financial assistance from McGill’s Centre for the Study of Democratic Citizenship, under the direction of Elisabeth Gidengil, and from Princeton’s Canadian Studies Program. Princeton’s Center for the Study of Democratic Politics also provided financial assistance and administra-tive support. The authors thank all the participants for many helpful comments and suggestions, especially Kurt Bauman, André Blais, Tiffany Julian, and Michael McDonald. Larry Bartels, Simon Jackman, Lynn Vavreck, and anonymous reviewers also made important suggestions and helped dramatically improve the graphical presentations. Remaining errors are the authors’ own. *Address correspondence to Christopher H. Achen, Politics Department, Princeton University,
312 Robertson Hall, Princeton, NJ 08544, USA; e-mail: [email protected].
1. CPS is the official source for government labor statistics and is jointly sponsored by the U.S. Census Bureau and Bureau of Labor Statistics. The monthly, face-to-face survey currently
doi:10.1093/poq/nft042 Advance Access publication November 25, 2013
at Jordan University of Science and Technology on July 26, 2016
http://poq.oxfordjournals.org/
Census Bureau 2010b, 16-2). Sample sizes currently exceed 75,000 voting-age citizens, stratified by state, making the CPS many times larger than even
the biggest academic surveys. Response rates2 generally approach 90 percent;
in 2008, for instance, the RR6 rate was 88 percent (U.S. Census Bureau 2010b, 16-4). The Census Bureau releases a biennial report on voter turnout based on
the Voting Supplement.3
Estimated turnout rates from the CPS typically have been just a few percentage points higher than actual turnout as estimated from vote counts. In both 2004 and 2008, for example, the CPS overreport relative to the turnout of the vote-eligible population (VEP) was less than three percentage points (see U.S. Census Bureau 2010c; McDonald 2013). This is a far better result than the customary 10 to 15 percentage points of overreport in even the highest quality academic surveys (see Traugott and Katosh 1979; Cassel 2004).4 For all these reasons, the CPS is often regarded as the “gold standard” in voter turnout surveys (Cohn 2013).
In 2008, however, an oddity occurred that raised some eyebrows (McDonald 2010). Nine million more Americans voted in 2008 than in 2004. Yet when the official CPS 2008 turnout estimate was released, it turned out to be just 63.6
percent (U.S. Census Bureau 2010c, 2).5 The corresponding 2004 estimate had
actually been a bit higher, at 63.8 percent (U.S. Census Bureau 2006, 2). Thus, by the CPS estimates, the historic 2008 contest won by Barack Obama had a turnout rate that was “not statistically different” from or perhaps was even slightly lower than its placid 2004 predecessor (U.S. Census Bureau 2010c, 1).
State vote counts told a different story. The turnout among eligible citizens for the 2004 General Election was 60.1 percent, while the corresponding 2008
figure was 61.6 percent—a very plausible increase of 1.5 percentage points
(McDonald 2013). The corresponding CPS estimate of turnout change missed this benchmark by a surprising 1.7 percentage points. With the sample size
includes about 56,000 households, selected through a multistage probability sampling process based on the decennial census to represent the civilian noninstitutionalized population of the United States. The sample is composed of eight panels initiated in successive months. In each panel, respondents are interviewed monthly for four months, then are omitted for eight months, and then are interviewed again for four months. For more details on the CPS sampling procedure
and the Voting and Registration Supplement, see the Census Bureau website (http://www.census.
gov/hhes/www/socdemo/voting/) and Bauman and Julian (2010).
2. For AAPOR’s standard definition of response rate, see AAPOR (2011).
3. For voter turnout, the CPS question wording is “In any election, some people are not able to vote because they are sick or busy or have some other reason, and others do not want to vote. Did (you/name) vote in the election held on (date)?”
4. In this context, “overreport” includes both misreporting by survey respondents and the ten-dency of voters to respond to turnout surveys more than nonvoters.
5. These two published turnout rates correspond exactly to the weighted estimates we computed from the CPS public use data files for 2004 and 2008. All 2004 and 2008 CPS turnout rates and other statistics reported in this paper are weighted with the CPS-recommended “final weight”
variable PWSSWGT (U.S. Census Bureau 2010b, 3-2). For earlier years, we use the equivalent
final weight.
at Jordan University of Science and Technology on July 26, 2016
http://poq.oxfordjournals.org/
and response rate of the CPS, a pure sampling error of nearly two percentage
points should almost never occur.6
Coding the Turnout Variable in the CPS
Every postelection turnout survey encounters respondents who cannot remember whether they voted, or who do not wish to divulge their electoral behavior to a
stranger. These Don’t Know and Refused responses are conventionally coded as
“missing.” Similarly, preelection respondents who were not interviewed in the postelection survey are counted as missing data. This is the procedure followed by the American National Election Study (ANES; see ANES 2009, 83–85). Wolfinger and Rosenstone (1980, 6) coded the CPS the same way, as did Nagler (1991, 1397), Leighley and Nagler (1992, 723), Hanmer (2009, 199), and others.
In its official reports, however, the CPS does not follow the conventional
academic coding rules for turnout responses. Instead, it treats Don’t Know,
Refused, and No Response as indicating that the respondent did not vote. This Census Bureau coding rule dates to the earliest years of the CPS survey. The Census Bureau has traditionally taken the view that its procedures reduce the estimated turnout rate and therefore come closer to the truth: “Nonrespondents and people who reported that they did not know if they voted were included in the ‘did not vote’ class because of the general overreporting by [other] respondents in the sample” (U.S. Census Bureau [2010a], at “Voter, Reported Participation”). The implicit argument seems to be that only those people who disobeyed the social norm of voting would be reluctant to answer a turnout question; hence, they are probably nonvoters. This judgment may be accurate
in most cases of Don’t Know and Refused. However, these two categories have
always been small. In 2008, for example, they made up just 1.2 and 1.4 percent of the sample, respectively.
The great majority of the missing turnout data stems from the third category
of No Response. This code refers to respondents who were interviewed in the
first part of the CPS but never started the Voting and Registration Supplement. That is, they never participated in the turnout survey at all. Before the first question of the supplement is asked, the interviewer is given the choice to close out the interview. The interview may have gone poorly, or the respondent
6. The CPS reports 90-percent confidence intervals of ±0.3 percentage points for its national
turnout rates (U.S. Census Bureau 2006, 2; 2010c, 2). This matches our calculations precisely:
Conservative linearized standard errors using the CPS data files and the svy procedure in STATA
11.1 produce an interval of ±0.298 percentage points in both 2004 and 2008. By standard cal-culations, the latter figures give a 99-percent interval for the difference between two independ-ent surveys of quadrennial turnout rates of ±0.66 percindepend-entage points. Thus, the CPS error of 1.7 percentage points is very far outside this 99-percent interval. The small CPS omissions from the target population are not nearly enough to make up the difference.
at Jordan University of Science and Technology on July 26, 2016
http://poq.oxfordjournals.org/
may need to do something else.7 When this happens, the respondent is reported as No Response, and then is coded as not having voted.
The Census Bureau’s decision to count the No Response individuals as
nonvoters is consequential. No Response alone makes up 11.2 percent of the
2008 sample. Coding all of them, plus Don’t Know and Refused, as nonvoters
reduces the estimated turnout rate by nearly 10 percentage points, cancelling most of the 12-point overreport in the original data. In contrast, when CPS studies are coded in the conventional fashion paralleling the ANES, the over-report rate is comparable to that of other high-quality academic studies (Gera et al. 2010).
The same pattern holds in prior years. Figure 1 reports the unadjusted turn-out rate from the CPS for 1980–2012, along with the official CPS turnturn-out with nonrespondents counted as nonvoters. McDonald’s (2013) estimate of the true turnout rate among the VEP, calculated from official state returns, is included for comparison. Just as intended, the resulting official CPS turnout estimates look quite close to the VEP, much closer than the unadjusted rate in the origi-nal data (U.S. Census Bureau 2010c, 1).
Yet the CPS coding rule is not without costs. It turns out that the coding of missing data is the source of the CPS error in estimating overall turnout change
Figure 1. Three Estimates of American Voter Turnout.
7. E-mail communication with Tiffany Julian, U.S. Census Bureau, October 22, 2010. We thank her and Kurt Bauman for their unfailing helpfulness and professionalism in responding to our many inquiries.
at Jordan University of Science and Technology on July 26, 2016
http://poq.oxfordjournals.org/
from 2004 to 2008. In the unadjusted data, with nonrespondents counted as
missing, estimated turnout in the CPS 2008 survey actually increased by 2.2
percentage points from 2004, close to the 1.5-percentage-point increase that
McDonald calculated from official voting returns.8 The official CPS coding
procedure gives the opposite and inaccurate result because in 2004, the No
Response category represented just 8.0 percent of all respondents, while it
jumped to 11.2 percent in 2008. Thus, an additional 3.2 percent of the sample were never offered the turnout supplement in 2008. All of them were coded as nonvoters. That decision overwhelmed the turnout gain in the rest of the sample and caused the estimated slight decline in turnout from 2004 to 2008 in the official CPS turnout estimates. In sum, the decrease in turnout estimated by CPS in 2008 stemmed entirely from their survey coding procedures.
The Growing Importance of Missing Turnout Data
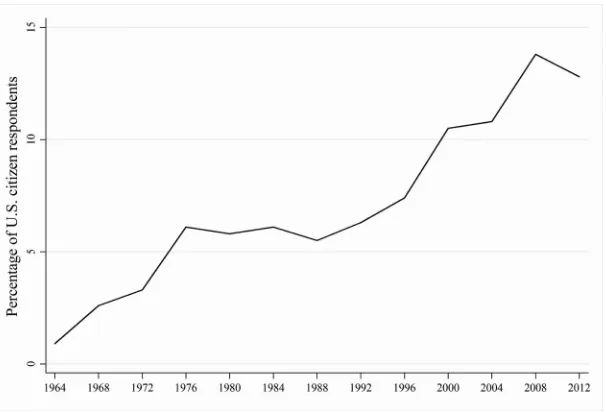
In the initial years of the CPS survey, nonresponse to the Voting Supplement was small, and therefore how it was coded mattered little. In 1972, only 3.0 percent of
respondents failed to answer the turnout question in the Voting Supplement.9 But,
as figure 2 shows, the CPS missing rate has trended generally upward over time. The CPS coding rules have the consequence that when missing rates change, so does the official CPS turnout estimate, regardless of what is happening in the electorate. As we have already said, this effect accounts for the CPS report that turnout was flat or down in 2008. But the problem is not confined to 2008. We can look at turnout change since the prior presidential election in earlier years. First, define the error of the official CPS estimate of turnout change relative to the VEP (McDonald 2013):
Official CPS error = Official CPS estimate of turnout cha| nnge VEP turnout change
– | .
The error in the conventional (unadjusted) coding of the CPS is defined analogously.
8. The difference between 2.2 and 1.5 percentage points is at the boundary of the 99-percent confidence interval. However, the 2008 sample had a lower response rate than the 2004 sample, presumably leading to a somewhat more politically engaged 2008 sample with a higher turnout. Consequently, the turnout gain of 2.2 percentage points in the CPS sample is biased upward, and sampling variation can easily account for the remaining difference from McDonald’s correspond-ing estimate of turnout change in 2008.
9. To maintain consistency with later years, we have used the question from 1972 asking whether the respondent voted, ignoring the follow-up about whether the respondent voted specifically in the presidential race that year. In addition, for years in which the CPS did not report the number of noncitizens (1964–1976), we estimated the number based on the decennial census data on per-centage of foreign-born noncitizens and removed them from all turnout calculations.
at Jordan University of Science and Technology on July 26, 2016
http://poq.oxfordjournals.org/
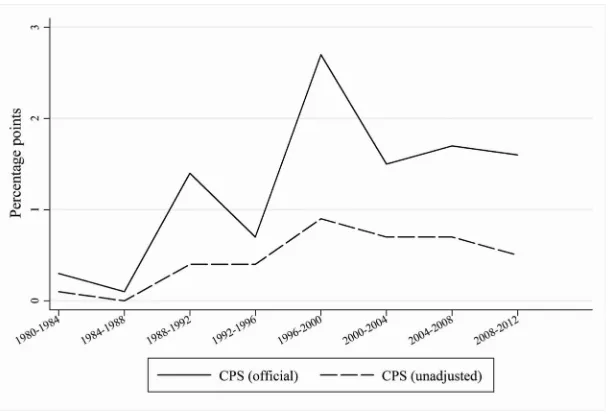
Figure 3 compares the absolute errors of the CPS coding and the conven-tional coding from 1984 to 2012. Through the 1980s, the two codings of CPS turnout produce similar results and similar absolute errors in estimating turn-out change. But since then, the two codings have generally diverged, with the official CPS coding always producing larger errors, sometimes dramatically
so.10 Thus, the official CPS reports have struggled to produce reliable
esti-mates of turnout change as nonresponse has grown.
Summary and Recommendations
The CPS produces turnout estimates every two years in its official election reports. An idiosyncratic coding rule is used: Missing respondents are counted as nonvoters to compensate for overreport of turnout. That is, a deliberate downward error is generated among nonrespondents to compensate for an upward error by actual respondents. We have shown that this procedure has become less trustworthy in recent years as nonresponse has increased.
For estimating voter turnout or changes in turnout, actual vote counts will always be superior to surveys. The CPS should not be used for that purpose.
Figure 2. Missing Turnout Responses in the CPS.
10. To further validate this result, we disaggregated to the state level for 2000–2004 and 2004– 2008, with similar conclusions. We also explored whether imputing the turnout of the nonre-spondents would improve the turnout estimates, but it did not. These results are omitted for lack of space but are available from the authors on request.
at Jordan University of Science and Technology on July 26, 2016
http://poq.oxfordjournals.org/
However, researchers often want to know what proportion of young people or African Americans voted in a given election, or some other purely descriptive statistic, and for that purpose surveys are essential. The official CPS reports include results of that kind, but they are based on the idiosyncratic coding we have discussed, an increasingly risky procedure as CPS response rates fall. On the other hand, the conventional (unadjusted) coding of turnout ignores the overreport. What should the CPS and other researchers do instead?
We recommend dropping all categories of missing turnout response, and then poststratifying the remaining CPS sample so that the survey turnout rate in each state matches the corresponding state VEP turnout (see Lohr 2010, 342–44). That is, the CPS survey weights should be adjusted for overre-port. For example, the 2008 CPS conventionally coded turnout estimate for Iowa, appropriately weighted by the variable PWSSWGT, is 77.08 percent. McDonald’s (2013) estimate of 2008 Iowa highest-office turnout is 69.7 per-cent. Then, a new weight could be computed for those Iowans who report voting: [FINALWGT = (69.7 / 77.08)PWSSWGT = .904 PWSSWGT]. The weight for those who report not voting would be [FINALWGT = (30.3 / 22.92) PWSSWGT = 1.322 PWSSWGT]. This procedure simply weights the sample of self-reported voters down to the McDonald fraction of actual voters, and it weights the sample of self-reported nonvoters up to the McDonald fraction of actual nonvoters. The reweighting would be repeated in each state, thereby adjusting for the different rates of nonresponse and overreport across them.
Figure 3. Errors in Estimates of Presidential Turnout Change (absolute difference from VEP estimated change).
at Jordan University of Science and Technology on July 26, 2016
http://poq.oxfordjournals.org/
By construction, such a reweighted survey would reproduce each state turnout rate without error.
Roughly speaking, this procedure will be statistically successful if, after weighting, the self-reported voters in a particular state who responded to the Voting Supplement are, in expectation, representative of all actual voters in that state. A parallel requirement holds for self-reported nonvoters. Those assumptions are unlikely to be perfectly accurate. But until the Census Bureau itself produces more sophisticated weights to take into account the growing problem of missing data in the CPS, this procedure may be the best simple adjustment method.
An even more helpful step the Census Bureau could take in the future would be to validate turnout in the CPS Voting Supplement, at least for a substantial subsample of respondents. Since the states are now federally mandated to have statewide machine-readable files, vote validation is easier than it once was, when painstaking visits to individual county offices were required, though
challenges remain (Traugott 1989; McDonald 2007; Berent, Krosnick, and
Lupia 2011; Ansolabehere and Hersh 2012). With validation, the CPS data and the Census Bureau’s subsequent official turnout reports would then indisput-ably be the most valuable information available on the electoral behavior of the American population.
References
American Association for Public Opinion Research (AAPOR). 2011. “Standard Definitions:
Final Dispositions of Case Codes and Outcome Rates for Surveys.” http://www.aapor.
org/AM/Template.cfm?Section=Standard_Definitions2&Template=/CM/ContentDisplay. cfm&ContentID=3156.
American National Election Study (ANES). 2009. ANES 2008 Time Series Study. Post-Election
Codebook. Ann Arbor: University of Michigan.
Ansolabehere, Stephen, and Eitan Hersh. 2012. “Validation: What Big Data Reveal About Survey
Misreporting and the Real Electorate.” Political Analysis 20:437–59.
Bauman, Kurt, and Tiffany Julian. 2010. “A Summary of Data Collection Procedures and Reports of Voter Turnout from the Current Population Survey.” Paper presented at the McGill-Princeton
Workshop on Overreporting of Voter Turnout, McGill University, Montreal, Canada. http://
www.census.gov/hhes/www/socdemo/voting/publications/other/CPS_Turnout_11-2010.pdf. Berent, Matthew K., Jon A. Krosnick, and Arthur Lupia. 2011. “The Quality of Government
Records and ‘Over‐Estimation’ of Registration and Turnout in Surveys: Lessons from the
2008 ANES Panel Study’s Registration and Turnout Validation Exercises.” Working Paper No.
nes012554. Ann Arbor, MI, and Palo Alto, CA: American National Election Studies. http://
www.electionstudies.org/resources/papers/nes012554.pdf.
Cassel, Carol A. 2004. “Voting Records and Validated Voting Studies.” Public Opinion Quarterly
68:102–8.
Cohn, Nate. 2013. “The New Census Data That Should Terrify Republicans.” New Republic (May 8).
http://www.newrepublic.com/article/113160/november-2012-census-data-obamas-coalition- will-hold-together.
Gera, Katie, David Yeager, Jon A. Krosnick, Matthew DeBell, and Michael McDonald. 2010. “Overestimation of Voter Turnout in National Surveys.” Paper presented at the Annual Meeting of the American Political Science Association, Washington, DC.
at Jordan University of Science and Technology on July 26, 2016
http://poq.oxfordjournals.org/
Hanmer, Michael J. 2009. Discount Voting: Voter Registration Reforms and Their Effects. New York: Cambridge University Press.
Leighley, Jan E., and Jonathan Nagler. 1992. “Individual and Systemic Influences on Turnout:
Who Votes?” Journal of Politics 54:718–40.
Lohr, Sharon L. 2010. Sampling: Design and Analysis. 2nd ed. Boston, MA: Brooks/Cole.
McDonald, Michael P. 2007. “The True Electorate: A Cross-Validation of Voter Registration Files
and Election Survey Demographics.” Public Opinion Quarterly 71:599–602.
———. 2010. “2008 Current Population Survey Voting and Registration Supplement.” http://
elections.gmu.edu/CPS_2008.html.
———. 2013. “Voter Turnout.” http://elections.gmu.edu/voter_turnout.htm.
Nagler, Jonathan. 1991. “The Effect of Registration Laws and Education on U.S. Voter Turnout.”
American Political Science Review 85:1393–405.
Traugott, Michael W., and John P. Katosh. 1979. “Response Validity in Surveys of Voting
Behavior.” Public Opinion Quarterly 43:359–77.
Traugott, Santa. 1989. “Validating Self-Reported Vote: 1964–1988.” Institute for Social Research, University of Michigan. Paper presented at the Annual Meeting of the American Statistical Association, Washington, DC.
U.S. Census Bureau. 2006. Voting and Registration in the Election of November 2004. U.S.
Government Printing Office, Washington, DC.
———. 2010a. “CPS Definitions and Explanations.” In Current Population Reports. Washington,
DC. http://www.census.gov/population/www/cps/cpsdef.html.
———. 2010b. CPS 2008 Voting and Registration Supplement File Technical Documentation.
Washington, DC.
———. 2010c. Voting and Registration in the Election of November 2008. U.S. Government
Printing Office, Washington, DC.
Wolfinger, Raymond E., and Steven J. Rosenstone. 1980. Who Votes? New Haven, CT: Yale
University Press.
at Jordan University of Science and Technology on July 26, 2016
http://poq.oxfordjournals.org/