Y-STR studies of genetic genealogy, population and forensic genetics of Indian and Zulu groups in the Durban, KwaZulu-
Natal area of South Africa.
by
SURINA SINGH
Submitted in fulfilment of the academic requirements for the degree of Master of Science Biological Sciences (Forensic Genetics)
in the School of Life Sciences,
College of Agriculture, Engineering and Science, University of KwaZulu-Natal (Westville Campus),
Durban, South Africa
June 2018
Supervisor: PROF. JENNY LAMB
As the candidate’s supervisor I have approved this thesis/dissertation for submission.
Signed: _____________ Name: Jennifer M Lamb Date: 02/07/2018
ABSTRACT
The combination of molecular genetics and surname analysis of short tandem repeat (STR) data has the potential to shed light on population structure and history, falling within the field of forensic deoxyribonucleic acid (DNA) analysis. Since the Y-chromosome DNA along with surnames are paternally inherited, non-related males sharing a surname should be more closely related in comparison to the general population. Currently, no surname studies based on the Indian population in South Africa exist. This study aimed to explore the genetic genealogy, population and forensic genetics of Indian (different geographic origin, religion and language) and Zulu males with different common surnames from Durban, KwaZulu-Natal. This was achieved by: (1) Collecting samples from 224 non-paternal lineage related North Indians males and generating DNA profiles, using the Yfiler®
Plus kit to amplify 27 Y-chromosome STR (Y-STR) loci; (2) Comparing the genetics of the North Indian group to that of other groups with South Indian and Zulu African surnames found in the forensic lab database. Hypotheses were formulated to analyse differences in relationships at ethnic, region, religion, language and surname-based levels (Figure 1). Population and forensic genetic analyses revealed that the Yfiler® Plus gave a higher number of unique haplotypes and discrimination capacity and a lower haplotype match probability, validating its use in this study. Genetic structure was found amongst examined sub-groupings. AMOVA was significant for all levels tested, with exception to between South Indian surnames. There are no known barriers to intermarriage among people bearing these South Indian surnames. Structure and PCoA analysis showed the presence of two significant sub-populations, which were ethnic based. Population structure and diversity were not surname based, but rather at an ethic level. This could be attributed to polyphyletic origin (many surname origin) of the analysed surnames. Surname transmission was polyphyletic for all surname groups, showing overlapping haplotypes and clades, implying multiple founders/ lineages for each specific surname investigated. The data generated in this study will contribute to the Indian DNA profiling database and could potentially serve as a baseline for further research. Further research could include sequencing autosomal STRs and hypervariable regions of mtDNA.
EXTENDED ABSTRACT
Genetic genealogy is a field of growing interest, involving genealogical testing to determine genetic relationships between individuals. The combination of molecular genetics and surname analysis of Y-STR data has the potential to shed light on population structure and history and is within the field of HID (human Identification) forensic DNA analysis. Since DNA along with surnames are passed down from our ancestors, people with the same surname should have a greater chance of sharing common ancestry when compared with the general population. There are currently no surname studies based on the Indian or Zulu populations of SA. The primary focus of this study was on genetic genealogy, i.e. co-inheritance of surnames and Y-STRs. In addition, population and forensic genetics of a sample group of mainly Indian and Zulu people from the greater Durban area of KwaZulu-Natal (KZN), SA, was investigated to search for genetic structure in comparisons of groups based on (1) Ethnicity (Indian vs Zulu), (2) Region of origin in India (North vs South), (3) Religion (Hindu vs Muslim), (4) Language (Hindi vs Muslim (Urdu) vs Tamil Indians) and, (5) Surname-based groups originating from North India (surnames Khan, Maharaj and Singh), South India (surnames Govender, Naidoo and Pillay), and Africa (surnames Buthelezi, Cele, Dlamini, Mkhize and Zulu). Further, an attempt was made to establish baseline aspects of the social history of the North Indian groups in Durban, which relate to genetic genealogy. The age profile and number of generations since the first family member arrived in the Durban area from India were investigated, along with information on whether a North Indian individual shares his surname, city, religion and language with his child and paternal and maternal forefathers.
DNA samples were collected from 224 non-parentally related North Indian males with the surnames Khan, Maharaj and Singh and the Yfiler® Plus Polymerase chain reaction (PCR) amplification kit was used to amplify 27 Y-STR loci, from which DNA profiles were generated. In order to extend the basis for comparison to other Durban area ethnic groups, Y-STR profiles, from the lab database, of South Indians (n = 90, surnames Govender, Naidoo and Pillay) and Zulus (n = 100, surnames Buthelezi, Cele, Dlamini, Mkhize and Zulu) were included in the sample set. Null Alleles were observed at 77.8 % (21 out of 27) of the different loci analysed, with most contained in loci DYS391, DYS389II and DYS448.
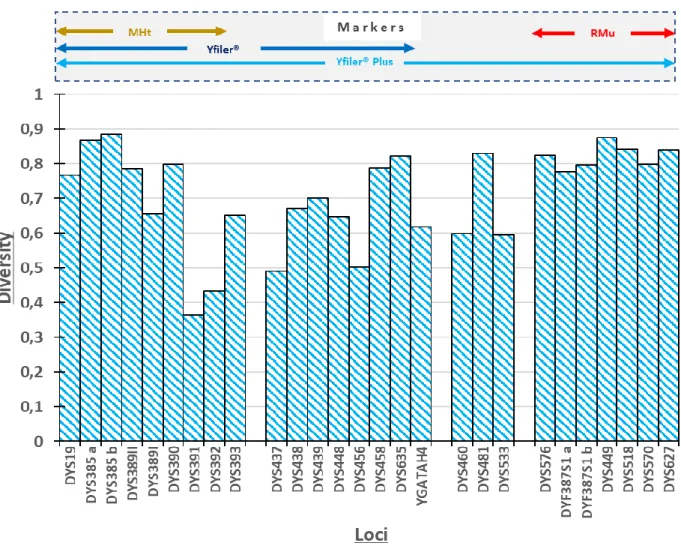
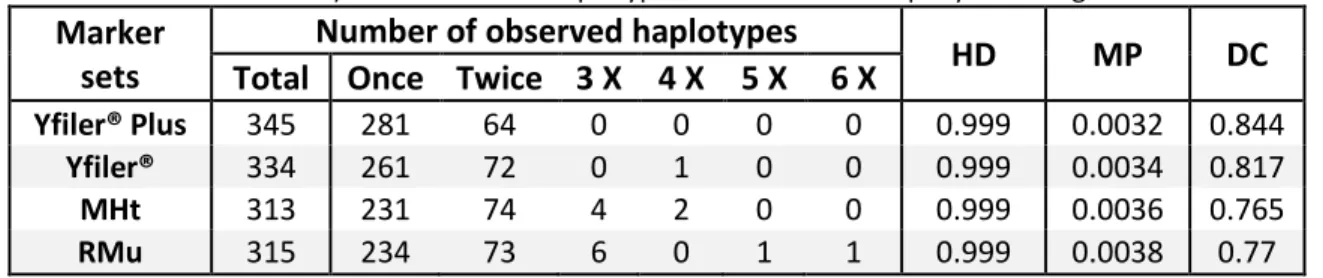
Population and forensic genetic analyses were used to compare four Y-STR marker sets (1) Minimal Haplotype (MHt), (2) Yfiler®, (3) Yfiler® Plus markers, and (4) Rapidly Mutating (RMu) and assess their suitability for forensic investigation in the overall sampled population. The Haplotype diversity (HD) for all marker sets was 0.999. The smaller RMu marker set (7 loci) had the highest mean genetic diversity (GD) per locus (0.82), however, the use of an increased number of marker loci (which include these 7 loci), as exemplified by the Yfiler® Plus kit (27 loci), resulted in a higher number of unique haplotypes, a higher discrimination capacity (DC) and a lower haplotype match probability (MP), validating the decision to use the Yfiler® Plus kit in this study.
One of the aims of this study is to search for the existence of genetically structured sub-groups within different sample groups, based on the following analyses: (1) Analysis of Molecular Variance (AMOVA) was used to estimate the extent of population differentiation and its significance; (2) Bayesian Analysis of Population Structure (BAPS) was carried out to estimate the number of genetic clusters in a sample group and the percentage membership of each sample member in each identified cluster; (3) Principal Co-ordinates Analysis (PCoA) was carried out to visualise genetic distance and relatedness among sample groups; and Haplotype networks were created to show mutational relationships among haplotypes within a sample set.
A relatively moderate level of genetic separation between Indian and Zulu groups was observed in all genetic structure-based analyses. In comparisons using AMOVA, 7% of the variance (PhiPT=0.074, P
= 0.0001) occurred between the two ethnic groups. This was reflected in PCoA analyses as a high degree of genetic separation between Indians and Zulus, which also formed separate groups in Bayesian analyses of population structure and to some extent in haplotype network analyses. This difference was postulated to have developed in the years following separation of the two groups by migration of the ancestors of the Indian populations out of Africa into Asia. The introduction of indentured labourers from India to the Durban region resulted in these groups again occupying the same geographic region, which led to varying degrees of interbreeding between the two groups.
However, the relatively short time since the arrival of the Indians in Durban (~ 160 years), combined with cultural and legal barriers to interbreeding, has resulted in the maintenance of clearly detectible genetic structure among the two groups.
The distance separating the sites of origin of the North and South Indian samples, combined with language and cultural differences, were reflected in genetic structure among the groups of North and South Indian origin. Differences between North and South Indians were observed in all genetic structure-based analyses; AMOVA indicated that 3% of the variance occurred among North and South Indian groups (PhiPT =0.029, P < 0.005) whilst PCoA, Bayesian Analysis of population structure and haplotype network analysis showed a level of separation between them. Geographical proximity since the original indentured Indian labourers arrived and the consequent opportunity for the North and South Indian groups to interbreed is likely to have reduced the levels of genetic structure among them, although it is still detectible.
Genetic structure was observed between Hindu and Muslim sample members, although at a very low level. AMOVA revealed that a significant, but low 1% of the variance (PhiPT= 0.009, P = 0.0010), occurred among sample groups.
In language-based comparisons, AMOVA revealed that a relatively low 3% of the variance (P < 0.005) occurred between Tamil and both Hindi and Muslim sample members, and an even lower 1%
(0.001%) between Hindi and Muslim sample members. These differences were also reflected in PCoA and haplotype network analyses. As hypothesized, the existence of genetic structure based on language was supported for all comparisons (Tamil vs Hindi, Tamil vs Muslim (originally Urdu), and Hindi vs Muslim (originally Urdu), although this may have been confounded, in some cases, by region- based differences (North vs South Indians).
The Y-chromosome and surnames are paternally inherited in both North and South Indians and Zulus.
As the Y-chromosome has a relatively low mutation rate per generation, it could be hypothesised that groups of people with a particular surname would be more closely related to each other than to groups with other surnames. Genetic divergence over time among surname groups based on religious and or cultural practices or region of origin are likely to be reflected in genetic divergence among surnames. AMOVA revealed that there is a broad level of genetic structure attributable to surname- based groupings, as eight percent of the variance occurred amongst all 11 surname-based groups (Khan, Maharaj, Singh, Govender; Naidoo, Pillay; Buthelezi, Cele, Dlamini, Mkhize, Zulu).
In AMOVA, 3% of the variance occurred among North Indian surname groups, with PhiPT values being low but significant. The highest PhiPT values were associated with comparisons of the Maharaj group with the Singh and Khan groups respectively. PCoA, BAPS and haplotype network analysis supported this pattern. The surname Maharaj (Brahmin caste, Hindu) appeared most distinct, possibly due to divergence based on intermarriage barriers based on caste (with Singhs) and religion (with Khans, who are Muslim).
Little genetic structure was observed amongst the South Indian Tamil surnames, Govender, Naidoo and Pillay. There are no known barriers to intermarriage among people bearing these surnames, making it unlikely that they would have diverged from one another through time, and that this would be reflected in Y-STR based genetic structure.
AMOVA revealed that 9% percent of the variance occurred among the Zulu surname groups Buthelezi, Cele, Dlamini, Mkhize and Zulu. All pairs of surname-based groups were significantly different from each other and PCoA revealed some separation of groups with the surnames Cele, Dlamini and Mkhize. Bayesian Analysis of Population Structure supported this and showed the surnames Cele and Dlamini to be particularly distinct. Consistent with this, the haplotype analysis shows one cluster consisting of only sample members with the surname Cele. Traditionally, Africans are not allowed to marry within the same in order to prevent inbreeding. Creation of such intramarriage barriers is likely to lead to high levels of diversity and low levels of genetic structure among surname-based groups. In contrast to this expectation, levels of genetic structure among Zulu surname-based groups in this study were considerably higher than those found among North Indian or South Indian surname-based groups.
One of the aims of this study was to determine the mode of inheritance of surnames, viz. whether inheritance is monophyletic or polyphyletic, whether the surname haplotypes overlap or are non- overlapping, and whether paternal transmission of surnames occurs with high or low fidelity (Jobling, 2001).
In this study, surname transmission was found to be polyphyletic for all three sets of surname groups (North Indian, South Indian and Zulu), and surname groups showed overlapping haplotypes and
clades. This implies that multiple genetically different ancestors may have founded different lineages of each specific surname investigated. Low fidelity surname transmission could also have resulted in surnames being part of multiple clades in a haplotype network, and single clades containing multiple surnames, as was observed in this study. This could happen in the case of adopted children, where the child is given the name of the adoptive father, but does not carry his Y-chromosome, or in the case of maternal transmission of surnames. The social data collected as part of this study revealed that, for the North Indian surname group, one third (Khan and Singh) to two thirds (Maharaj) of the respondents indicated that their surnames were derived from their maternal forefathers, consistent with disturbances in surname transmission. Low fidelity surname transmission which may relate to circumstances surrounding the importation of indentured labourers from India to what was then known as Natal. Anecdotal evidence suggests that surnames may have been incorrectly recorded during migration from India to SA, and that officials processing the new arrivals in Natal could not spell or pronounce some of the Indian surnames, leading them to use shortened or misspelled versions of them, or even used first names as surnames.
None of study samples shared haplotypes with those on the Y-chromosome Haplotype Reference Database (YHRD). Some study samples were positioned separately on the Multi-Dimensional Scaling (MDS) plot, whereas others formed groups with samples from the YHRD, indicative of common genetic origins. Overall, the Indian study samples appeared to have a South Asian origin, although the Maharaj surname appeared to be positioned as close to the European samples as to the other Asian samples, possibly indicative of a west Asian genetic origin. The positioning of the Zulu samples appeared to indicate shared origins with samples from Kenya and with Bantu Luhya samples.
Key words: Genetic genealogy, genetic structure, North and South Indian, population and forensic genetics, Y-STRs, Zulu.
PREFACE
Research and lab work were conducted under the standard ethics procedures of the UKZN Biomedical Research Ethics (BE456/16, sub-study of BCA056/16). Data is being held according to the stipulations of the permit. ISFG (International Society for Forensic Genetics) and the SWGDAM (Scientific Working Group on DNA Analysis Methods) recommendations have been followed.
The work described in this thesis was carried out at the School of Life Science, University of KwaZulu-Natal (Westville campus), under the supervision of Prof. Jenny Lamb. This study represents original work by the researcher, except where the work of others is acknowledged in the text, and no part of this work has been submitted in any form to another university.
__________________ __________________
Surina Singh (MSc student) Prof. Jenny Lamb (Supervisor)
Date: 13/11/2017 Date: 02/07/2018
PLAGIARISM DECLARATION
I, Surina Singh, declare that
(i) The research reported in this dissertation, except where otherwise indicated or acknowledged, is my original work;
(ii) This dissertation has not been submitted in full or in part for any degree or examination to any other university;
(iii) This dissertation does not contain other persons’ data, pictures, graphs or other information, unless specifically acknowledged as being sourced from other persons;
(iv) This dissertation does not contain other persons’ writing, unless specifically acknowledged as being sourced from other researchers. Where other written sources have been quoted, then:
a) their words have been re-written but the general information attributed to them has been referenced;
b) where their exact words have been used, their writing has been placed inside quotation marks, and referenced;
(v) Where I have used material for which publications followed, I have indicated in detail my role in the work;
(vi) This dissertation is primarily a collection of material, prepared by myself, published as journal articles or presented as a poster and oral presentations at conferences. In some cases, additional material has been included;
(vii) This dissertation does not contain text, graphics or tables copied and pasted from the Internet, unless specifically acknowledged, and the source being detailed in the dissertation and in the References sections.
_______________
Signed: Surina Singh
Date: 20/06/2018
ACKNOWLEDGEMENTS
I would like to acknowledge and thank the following:
The Almighty Lord, who I believe without whom the completion of this study could have not been possible. I would like to thank God, in whatever form he may be, for giving me the strength, knowledge, metal and physical health, capability and opportunity, to undertake and complete this research project.
Prof. Jenny Lamb, my supervisor, for her overall academic assistance and guidance, and the long hours spent to ensure that the work produced is of high standards. This study would have not been conducted as robustly without her proficient knowledge in the Forensic Genetics field.
Being regarded as her ‘final project’ as a postgraduate student, I hope I have done her proud.
Truly, I could have not asked for a better supervisor and mentor than her.
Velosha Naidoo and Chelsea Mkhize for allowing the use of their profiled Tamil and Zulu surnames respectively, for comparative analyses. Seshvir Pooran for lab assistance.
Family and friends for their overall support and assistance in finding non-related male volunteers to participate in study i.e. Anil Singh, Shamin Maharaj, Abja Maharaj, Sudika Singh-Reinesch, Shahir Rajcomar, Avant Samdhan, Kaveshin Govender, Seshvir Pooran, Ruven Pillay, Nirvedh Bhola, Mr Farook Khan, Suhail Khan, Anas Hamidi, Kishen Juguth, Nevaan Singh, Serisha Puncham, Seresha Naidoo and Munchkin-Wala Singh.
NRF for financial support. Radio Al-Ansar for allowing me the opportunity to speak about my project over-air. Facebook and google surveys as a platform to find volunteers who were willing to participate, and lastly all the male volunteers who participated in this study.
ABBREVIATIONS
AMOVA Analysis of Molecular Variance
AZFc Azoospermia Factor c
BAPS Bayesian Analysis of Population Genetic Structure
DC Discrimination capacity
DNA Deoxyribonucleic acid
FST Fixation index
GD Genetic diversity
HD Haplotype diversity
HID Human identification
ISFG International Society for Forensic Genetics
KZN KwaZulu-Natal
Mb Megabytes
MDS Multi-Dimensional Scaling
MHt Minimal Haplotype
MJ Median-joining
MP Haplotype match probability
MSY Male-specific region
mtDNA Mitochondrial DNA
NRRY Non-recombining region of the Y-chromosome
PAR Pseudoautosomal region
PCoA Principal Co-ordinates Analysis
PCR Polymerase chain reaction
RMu Rapidly Mutating
SA South Africa
SNPs Single nucleotide polymorphisms SRY Sex-determining region of the Y-chromosome
STRs Short tandem repeats
SWGDAM Scientific Working Group on DNA Analysis Methods TMRCA Time to Most Recent Common Ancestry
vs Versus
YHRD Y-chromosome Haplotype Reference Database Y-STRs Y-chromosome short tandem repeats
TABLE OF CONTENTS
ABSTRACT ... I EXTENDED ABSTRACT ... II PREFACE ... VII PLAGIARISM DECLARATION ... VIII ACKNOWLEDGEMENTS ... IX ABBREVIATIONS ... X TABLE OF CONTENTS ... XI 1. List of Figures ... XIII 2. List of Tables ... XIV
INTRODUCTION... 1
1. Background... 1
2. History of South African Indians ... 3
2.1. Movement from India to SA ... 3
2.2. Indian Caste System ... 6
2.3. Marriage practices in Indians and Zulus ... 7
3. Surname studies ... 9
4. Origin and Frequency of Target surnames ... 11
4.1. Surnames of Indians transported to Natal ... 12
4.2. Zulu Surnames ... 14
5. Patterns of transmission of surnames and haplotypes/haplogroups ... 15
6. The Y-chromosome ... 17
6.1. The importance of Y-chromosome testing in forensics ... 18
6.2. Polymorphic Y-chromosome markers ... 21
7. YHRD ( Y-chromosome Haplotype Reference Database) ... 26
8. Purpose of this research ... 27
9. Aims, Objectives and hypotheses ... 28
9.1. Utility of different Y-STR marker in population and forensic genetics analyses ... 30
9.2. Genetic structure analyses based on population sub-groupings ... 30
9.3. Surname-based genetic analyses ... 32
9.4. Population and forensic genetics based on population sub-groupings ... 34
9.5. Comparison of experimental samples with samples and populations on the YHRD ... 34
MATERIALS AND METHODS ... 35
1. Sampling ... 35
1.1. Sample composition ... 36
1.2. Comparison with other available databases ... 37
2. Sampling methodology ... 38
2.1. Sample collection ... 38
3. DNA Profiling ... 39
3.1. DNA extraction ... 39
3.2. DNA Quantification ... 39
3.3. Amplification of Y-STRs ... 40
3.4. Capillary electrophoresis ... 41
4. Genetic Analyses ... 42
4.1. Genetic Structure ... 42
4.2. Genetic diversity and Forensic parameters ... 44
4.3. Comparison of experimental samples with samples and populations on the YHRD ... 44
5. Social aspects: Lineage inheritance in North Indian surname groups ... 45
RESULTS ... 46
1. Comparison of Y-STR marker sets via population and forensic genetics analyses ... 47
2. Genetic structure analyses based on population sub-groupings ... 49
2.1. Genetic Structure based on population sub-groupings ... 49
2.2. Population and forensic genetics based on population sub-groupings ... 55
3. Genetic genealogy: Surname-based genetic analyses ... 57
3.1. Social aspects: Lineage inheritance in North Indian surname groups ... 57
3.2. Surname-based genetic structure and surname inheritance analyses ... 62
3.3. Surname-based population and forensic genetics analyses ... 69
4. Comparisons of study samples with samples found on the Y-chromosome STR Haplotype Reference Database (YHRD) ... 71
DISCUSSION ... 75
1. Comparison of Y-STR marker sets via population and forensic genetics analyses ... 76
2. Genetic structure analyses based on population sub-groupings ... 78
2.1. Genetic structure based on ethnicity (Indian vs Zulu) ... 78
2.2. Genetic structure based on region of origin in India (North vs South India) ... 81
2.3. Genetic structure based on religious groups ... 83
2.4. Genetic structure based on language ... 84
3. Genetic genealogy: Surname-based genetic analyses ... 86
3.1. Surname-based genetic structure ... 86
3.2. Surname Inheritance ... 89
4. Population and forensic genetics ... 91
5. Comparison of experimental samples with samples and populations on the YHRD ... 93
6. Challenges and shortcomings ... 95
7. Recommendations for future research ... 96
8. Conclusion ... 98
REFERENCES ... 101
APPENDIX ... 111
1. List of Figures
Figure 1: Concept Map of the study setup. ... 2Figure 2: Indian migration. ... 5
Figure 3: Indian settlement in Durban. ... 5
Figure 4: Comparison of the older Hindu and Muslim caste systems with the modern day system. ... 7
Figure 5: Possible relationships between Y-chromosomal haplotypes and surname transmission. ... 16
Figure 6: Y-chromosome structure. ... 18
Figure 7: SA's reported rape case trend over a nine year period. ... 20
Figure 8: Fragment sizes and fluorescent dyes used in the amplification of 27 Y-STR loci by the Yfiler® Plus PCR amplification kit. ... 25
Figure 9: Sampling location map. ... 35
Figure 10: Electrophoresis plate setup example. ... 42
Figure 11: GD per locus, for 27 loci and four different marker sets (N=409). ... 47
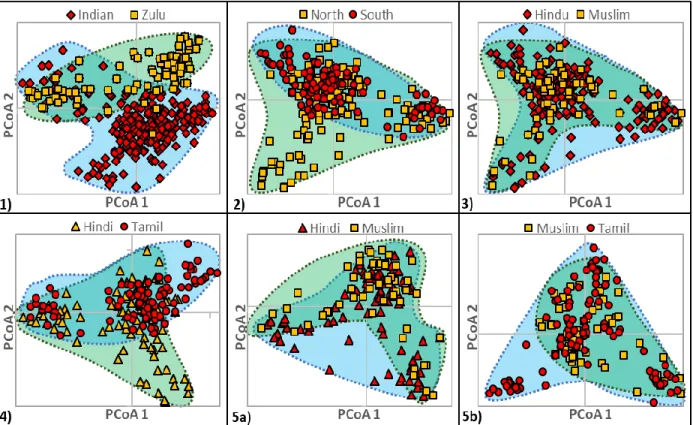
Figure 12: PCoA plot visualising genetic distance and relatedness amongst different sample sub- groupings. ... 51 Figure 13: Bayesian analysis of genetic population structure within the entire sample group (n = 399). ... 53 Figure 14: Haplotype network for the entire sample group, including whites (n = 409). ... 54 Figure 15: Race (a), age (b) and region of birth (c) of study samples (n = 224). ... 58 Figure 16: Frequency distribution and age compostion of the generations of Durban-area Indians in the sample since they arrived in KZN from India. ... 59 Figure 17: Likelihood that members of different sample groupings will share surname, city, religion and language with their children, paternal forefathers and maternal forefathers. ... 61 Figure 18: AMOVA: Distribution of molecular variance among and within surname-based groups of North Indians, South Indians and Zulus (n = 347). ... 62 Figure 19: PCoA plot for surname-based sample groupings. ... 64 Figure 20: Bayesian analysis of population genetic structure for three sample groups containing different surname sets (n = 347). ... 66 Figure 21: Haplotype networks for different surname-based groups (n = 347). ... 67 Figure 22: Haplotype network for shared haplotypes found in the total sample, which includes surname-based groups and random controls (n = 141). ... 68 Figure 23: MDS for 27 Y-STR loci for the studied and comparative populations from the YHRD. 74 Figure A 1: Research survey form ... 118 Figure A 2: Stand curve created using the Quantifiiler Duo kit (Thermo Fisher Scientific,
Waltham, Massachusetts). ... 120 Figure A 3: A Y-STR profile, using the Y-Filer® Plus kit, from GeneMapper® ID-X Software v1.4 (Thermo Fisher Scientific, Waltham, Massachusetts). ... 121 Figure A 4: Haplotype networks for individual surnames, based on Median joining method. .. 134
2. List of Tables
Table 1: Surname frequency world wide and in SA ... 11 Table 2: Composition of 5 different Y-STR multiplex kits. ... 23
Table 3: Summary of the current state of the YHRD. ... 27
Table 4: Sample table. ... 36
Table 5: Comparative population databases (YHRD). ... 37
Table 6: Null Alleles per locus (N=409). ... 46
Table 7: Allelic patterns for the overall study samples (N=409)... 48
Table 8: Forensic genetic parameters for the sample group (N=409) based on different marker sets. ... 49
Table 9: Sample sizes used in analyses of genetic structure among various subgroups of an overall sample of 399 Indian and Zulu samples... 49
Table 10: AMOVA Results ... 50
Table 11: PCOA via covariance: Eigen values and percent variance explained for the principal components 1 and 2 for comparisons among different subgroups of the overall sample (n=399). ... 50
Table 12: Allelic patterns for the overall study sample (n = 399) and sub-grouping within this sample. ... 55
Table 13: Forensic genetic parameters for the overall study sample (n = 399) and sub-grouping. ... 56
Table 14: Sample groupings used in surname-based genetic analyses (n = 347) ... 57
Table 15: Pairwise AMOVA for 27 Y-STR loci for surname-based groups. ... 63
Table 16: PcoA: Percent variation explained and eigenvalues for Indian, North Indian, South Indian and Zulu surname-based groups. ... 63
Table 17: Allelic patterns for the surname-based groups (n = 347). ... 70
Table 18: Forensic genetic parameters for different surname groups (n = 347). ... 71
Table 19: Number of haplotypes for the study samples and comparative populations (YHRD). 72 Table 20: Rst Clustering of populations. ... 72
Table 21: RST and significance values based on pairwise AMOVA for the study population and comparative populations from the YHRD. ... 73
Table A 1: The Yfiler® Plus composition... 119
Table A 2: Standard dilution series ... 120
Table A 3: Allele frequencies for the overall sample group (n = 399) and sub-groupings. ... 122
INTRODUCTION
1. Background
Humans (Homo sapiens) have 46 chromosomes located inside the nucleus of cells. These comprise 22 homologous pairs, and the X and Y sex chromosomes. Every individual inherits one of each of the 22 homologous chromosome pairs and a sex chromosome from each parent. In the case of sex chromosomes, males will inherit an X chromosome from the mother and a Y from the father, whereas, females will inherit an X from each parent (Alberts et al., 2002).
During meiosis, recombination does not occur in most of the Y-chromosome (except for the
‘pseudoautosomal’ regions located at the chromosome ends). Thus, much of the Y-
chromosome is passed on unchanged from father to son, unless a mutation has occurred. This means that many generations of males within a family lineage are likely to share an unchanged Y-chromosome sequence and therefore Y-STR profile (Jobling and Tyler-Smith, 1995; Jobling, 2001), and, in cultures where surnames are passed down in a patrilineal manner, will also share surnames. Rozhanskii and Klyosov (2011), using a metadatabase, found the average mutation rate for the Yfiler® marker haplotypes to be 0.00197 mutation/haplotype/generation, which was similar to the value of 0.00200 found by Klyosov (2009). The implication of this is that a Y- haplotype will mutate approximately once every 500 generations. Several aspects of human population history, including paternal lineage analysis and large-scale patterns of migration, can be explored by analysis of patterns of inheritance of STRs (short tandem repeats) associated with Y-chromosomes (Jobling and Tyler-Smith, 2003).
Driven by the popular interest in establishing family history, a number of studies based on co- inheritance of surnames and Y-haplotypes have been carried out (Sykes and Irven, 2000;
Jobling, 2001; King et al., 2006; McEvoy and Bradley, 2006; King and Jobling, 2009; Solé-Morata et al., 2015; Martinez-Cadenas et al., 2016). Genetic geology is a field of growing interest, involving genealogical testing to determine genetic relationships between individuals.
Genealogical studies involve the use of a wide range of genetic markers to evaluate
relatedness, susceptibility to disease and individual ancestry (King and Jobling, 2009). These studies focus primarily on molecular evolution, population genetics and forensic parameters.
This study will focus on surname inheritance, population and forensic genetics of an
experimental sample of North Indian males with the surnames Khan, Maharaj and Singh, and comparisons of these with similar data (from our lab) for South Indian (Govender, Naidoo and Pillay) and Zulu (Buthelezi, Cele, Dlamini, Mkhize and Zulu) surname-based groups sourced from Durban and surrounding regions of KZN SA. The samples will consist of males, owing to the focus on genetic genealogy, in particular the, co-inheritance of surnames and Y-STRs, which are found only in males. Understanding of genealogy (family history) in relation to genetic
inheritance allows for a more comprehensive interpretation of genetic differences within the Indian and Zulu populations.
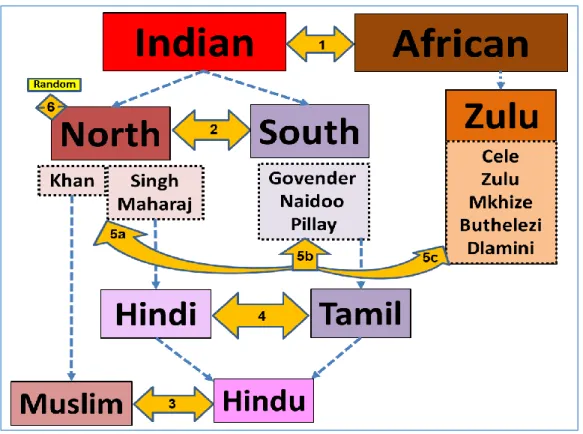
Figure 1: Concept Map of the study setup.
This figure illustrates comparisons made in this study, which will be based on 1.Ethncity: Indian vs African; 2 Region of origin in India: North Indian vs South Indian; 3. Religion: Hindu vs Muslim; 4. Language: Hindi vs Tamil; 5. Genetic
genealogy (coinheritance of surnames and Y-STRs): a. North Indian surnames (Singh, Maharaj, Khan), b. South Indian surnames (Govender, Naidoo, Pillay), c. Zulu surnames (Cele, Zulu, Mkhize, Buthelezi, Dlamini), and 6.
Baseline social data for the North Indian and other random surnames used as controls.
In addition to the investigation of genetic structure among surname-based groups from India and SA, this study will also search for the existence (or not) of genetic structure among groups based on ethnicity, geographic regions of origin, religion and language (Figure 1). Also included will be a questionnaire aimed at establishing baseline aspects of the social history of the North Indian groups in Durban, which relate to genetic genealogy. The age profile and number of generations, since the first family member arrived in the Durban area from India, will be investigated. Information will also be collected on whether a North Indian individual shares his surname, city, religion and language with his child and paternal and maternal forefathers.
2. History of South African Indians 2.1. Movement from India to SA
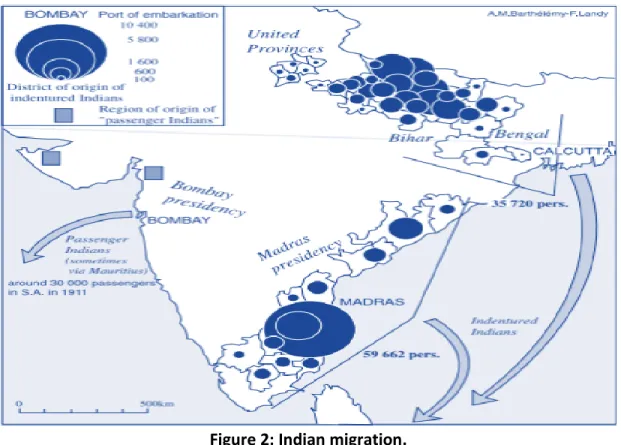
On the 16 November 1860, the first ships transporting 600 Indians arrived in SA on the ship Truro, from Madras and Calcutta in India (Brain, 1985). In total 384 trips were made, bringing approximately 152 184 Indians to Port Natal (currently known as Durban) in SA, under the scheme of indenture (Figure 2), with the last ship, called Umlazi, arriving on 11 July 1911 (Chetty, 2010). Between 1860 and 1902, 59 662 people migrated to Durban from the South Indian region around Madras, and 35 720 arrived there from the North Indian area around Bihar, Bengal and Calcutta (Figure 2).
These Indians, who were imported by the Dutch as labourers since Africans refused to work for them, were known as ‘indentured labourers’. They became urbanized in Natal and migrated towards towns in the Transvaal and the Cape Province after 1870 (Davies, 1981). After 1917, most of the Indians returned to India, although a few settled down in SA. The majority of these became owners of land along the coast of what is now known as KZN, including Durban and surrounding areas (Mukherji, 2011). They quickly established themselves as Industrial and railway workers, clerks and interpreters (SAHO, 2015).
By the 1940s the Indian community formed a major part the emerging industrial working class in KZN. The success of the settlement of these indentured labourers encouraged a new wave of migration by traders. This new group consisted of mainly Gujarati Muslims and Hindus and were known as ‘‘passenger Indians’’, since they had paid to travel to SA (Mukherji, 2011).
During the late 19th through to the early 20th-century, many SA Indians arrived from areas in the Indian subcontinent (Asia) that were under British Colonialism. This resulted in Indians being grouped with the broader ethno-geographic group of ‘Asians’ (Noble, 1994).
As settlements established, ethnic mixing occurred as Indians gradually started trading with other racial groups, such as whites and moved into neighbouring areas. Trading and residence competition resulted in the Indians being prohibited from settling in the Free State (Law 3 of 1885) and in restriction of the area where Indians could settle (Davies, 1981). From 1887, after extensive negotiations and legal proceedings, Indian trade and settlement was confined to certain areas, namely in the city of Durban (see Figure 3). According to the Census 2011 (Stats SA, 2011), there are 1 286 930 Indians found in SA (2.5% of the population), with more than half (756 991) living in KZN.
Currently, Durban has the highest population of Indian people outside of India (SAHO, 2015).
Indian culture is followed to a high extent in Durban. However, over generations it has been segregated according to different religions and social classes (partially defined by surnames), additionally reducing strong associations and social similarity to Indians residing in India (Landy et al., 2004). The majority of SA Indians are English speaking, with traditional languages mainly spoken by the older generations. Traditional Indian culture and languages are gradually dying off.
Figure 2: Indian migration.
The map shows Indian migration to KZN between 1860- 1902. Adapted from Landy et al. (2004).
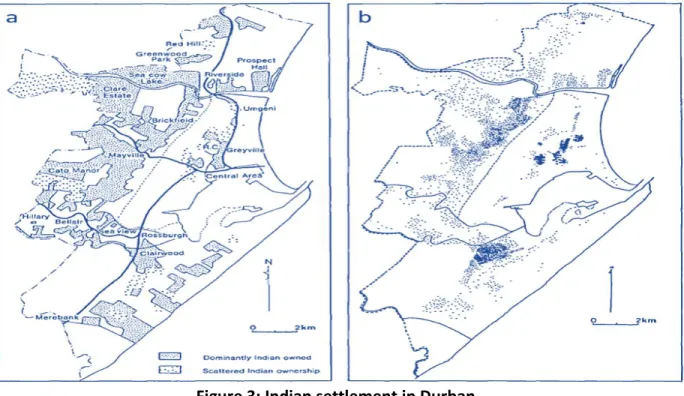
Figure 3: Indian settlement in Durban.
The map of Durban shows: a. Indian owned land in 1953, b. Indian distribution in 1951. Adapted from Davies (1981).
2.2. Indian Caste System
The word ‘caste’ is derived from the Portuguese word ‘castas’ which in translation means pure, idealising the important value in Indian culture i.e. ritual purity (Singh, 2017). To maintain this
‘purity’, Indian individuals tend to marry within the same caste. In the Indian population, there are ~ 37 000 different castes and ~ 500 different tribes (Papiha, 1996; Metspalu, 2001).
The Hindu caste system is believed to have originated from Lord Brahma (Hindu God of
creation) and was created by Manu, the first of Lord Brahmas human sons. ‘The Laws of Manu’
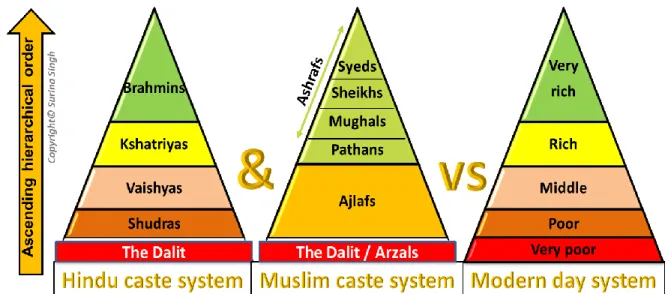
were refined around 200BCE (Doniger, 1991). The Hindu caste system is divided into five groupings (Figure 4) with four main categories in the following order of descending hierarchy:
Brahmins (priestly class), Kshatriyas (warrior class), Vaishyas (merchant and peasant classes) and the Shudras (labour class) (Alamy, 2017; Jayaram, 2017). The fifth grouping called ‘The Dalit’ (lowest of the Shudras) is detached from the other categories since this is an outcaste grouping. They were commonly referred to as the ‘untouchables’ or impure ones (Jayaram, 2017). Of the surnames included in this study, Maharajs are Brahmins (priestly class), whereas, Singhs are Kshatriyas (warrior class).
The Islamic religion does not embrace the Hindu caste system (Sirajudin, 2011). This led many lower caste individuals, and non-believers, to leave Hinduism and practice Islamic belief (Dirks, 2011). However, it is believed that all Indians, regardless of what religion they practice, tend to carry some vestiges of the caste system in them (Thekaekara, 2016). For example, Muslims, who follow a ‘caste system’, rank it according to ancestry, rather than occupation like the Hindu system.
The established Muslim system is followed mainly by South Asian Muslims Ranked in order of descending hierarchy (Figure 4) are: Ashrafs (foreigners who arrived from various regions and assimilated in Delhi, India, including; Syeds, Sheikhs, Mughals and Pathans; Ajlafs (all other converts); and Arzals (Muslim Dalits and caste renouncers) (Upadhyay, 2016).
The unfairness of the caste system has been challenged by Hindu reformist movements and has gradually changed over the years (Dirks, 2011). The modern day system is very different from the Hindu and Muslim caste systems (Figure 4) and is mainly based on wealth, education and job rankings (Alamy, 2017). However, the Hindu and Muslim caste systems are very much alive in India (Thekaekara, 2016).
Figure 4: Comparison of the older Hindu and Muslim caste systems with the modern day system.
Indians that follow the caste system are relatively unlikely to marry out of their caste, resulting in less genetic variation between caste-based groups, and therefore genetic structuring.
Therefore, understanding the extent of adherence to the caste system can help in
understanding why genetic similarities or differences are found within a particular grouping, whether it the grouping surname, regional, language or religion-based.
2.3. Marriage practices in Indians and Zulus
In SA, during Apartheid, mixed-race marriages were prohibited by the Prohibition of Mixed Marriages Act (Act No 55 of 1949) and the Immorality Act of 1950. In 1985, this act was repealed, legalising inter-racial marriages and relationships (SAHO, 2016). Generally, both Indians and Africans tend to marry within their own ethnic groupings. However, endogamy (marriage within a caste) is practiced by many Indians and exogamy (marriage out of a caste and with other castes or surnames) by Zulus.
2.3.1. Endogamy between Indians
Endogamy is the practice of marrying within a specific caste, social group or ethnic group (Bayly, 2001), and is widely practiced by Indians. Although marriage between Indians of different castes, religions, social and/or ethnic groups, is not permitted/ is looked down upon by the community, it does occur. Thus, an Indian is not encouraged to marry: (1) a non-Indian, creating an ethnic barrier between Indians and other racial/ethnic groups; (2) out of their religion, e.g. it is frowned on for a Hindu to marry a Muslim, creating a religion-based barrier;
(3) out of their traditional language, e.g. a Hindi speaking person is not encouraged to marry a Tamil-speaking person, creating a language-based barrier and (4) out of their social group, e.g. a very rich person should not marry a very poor person (in accordance with the modern-day caste system (Figure 4)). An individual is also expected to marry within their ‘jati’ (birth caste) (Bayly, 2001).
Adherence to such social practices would tend to create genetic structuring among the different groups.
2.3.2. Exogamy in Zulus
Exogamy is widely practiced by the Zulu culture. It is against tradition for a Zulu to marry
someone belonging to the same surname or caste as them, even if it is the same as that of their maternal forefather. The purpose of this practice is to prevent incest and inbreeding within the Zulu population. During Zulu weddings, the different clan names of the two families are
announced to re-ensure that exogamy is practiced (Hamilton, 1997).
2.3.3. Changes/exceptions in intermarriage patterns
Hypergamy is marrying someone of a higher sub-caste/social class. Controversially, hypogamy is marrying someone of a lower sub-caste/social class (Gill, 2012). Hypergamy and hypogamy is culturally permitted in some situations provided the people involved are of the same religion and their castes are very different in terms of ranking (Ghurye, 1969). Exogamous marriages are accepted in Islam and Christianity on condition that the person from the different religion converts to Islam or Christianity.
Exogamous and inter-caste marriages have increased over time in different cultures due to individuals marrying within a similar educational background or job field. There are also more interactions between the youth of today, due to social media and social events, for example than there were in past generations, where females in particular were not educated and family caste or social ranking played an important role in their value in society (Leonard and Weller, 1980; Rao, 2003). According to Jacobson et al. (2004), the rate of exogamous marriages in SA, has increased from 1996 (303:1) to 2011 (95:1). This could be attributed to changes in societal attitudes, including greater acceptance of different cultures and ethnic groups (Jacobson et al., 2004).
3. Surname studies
Many detailed surname genetic diversity (GD) studies focused on surnames of the British Isles (Sykes and Irven, 2000; King et al., 2006; King and Jobling, 2009). The existence of genetic structuring among people with the same or different surnames can be confirmed or disproved;
research can be directed at the history of formation of surnames in a particular geographical area or timeframe, making it easier to narrow down a search and locate a person of interest;
and surname-based migration patterns can be established over generations (World Families Network, 2015).
The first genetic surname related study was published in 1875 by George Darwin, the son of Charles, who used surnames to estimate the frequency of marriages between first-cousins. He calculated the expected proportion of such marriages to be 4.5% for the upper classes and 2.25% for the general rural population (Darwin, 1875).
The isonomy method (based on the frequency of marriage between individuals of the same surname) became popular and widely used due to the affordability and ease of collecting large datasets of marriages, births and deaths among past and current populations (Jobling, 2001).
This is a good method for estimating inbreeding coefficients within a population (Crow and Mange, 1965; Sykes and Irven, 2000).
The degree of co-ancestry, within surnames, is highly dependent on surname frequency
(Martinez-Cadenas et al., 2016). These authors found that, in the case of Y- chromosome single nucleotide polymorphisms (Y-SNPs) and Y- chromosome short tandem repeats (Y-STRs) the GD correlated positively with surname frequency (Spearman’s r = 0.896; p < 0.0001 for STR
haplotypes and r = 0.749; p < 0.0001 for haplogroups). However, the correlation found between surname frequencies and Y-STR inheritance differed between British and Irish surnames. British surnames, with a frequency higher than 5000 bearers at the national level, showed very little or no Y-chromosome co-ancestry, and Y-chromosome haplotype sharing increased as surname frequency decreased (King et al., 2006; King and Jobling, 2009).This relationship was also observed by Martinez-Cadenas et al. (2016), who found that frequent Spanish surnames had a lower match probability, whereas, rare and very rare surnames have a higher match probability (Spearman’s Rank Correlation: r = 0.906, p < 0.0001). In contrast, frequent Irish surnames were found to have very high Y-chromosome co-ancestry levels (McEvoy and Bradley, 2006).
Surname frequencies generally show clusters of population isolation if clans don’t mix with one another and if they remain within their geographic location. This results in a lack of GD, which sometimes results in the development of a unique language or way of talking (Martinez- Cadenas et al., 2016). Lane et al. (2002), who studied SA’s Bantu-speaking groups (Pedi, Southern Sotho, Tsonga/Shangaan, Tswana, Venda Xhosa and Zulu) based on 9 autosomal and 4 Y-STR loci, found clustering within language-based groups, with the exception of the Tsonga speaking group, and high genetic distances between the different language groups. Lane et al.
(2002) also found that genetic distances between SA’s African populations correlated positively with geographical distances. In contrast, no correlation was found between language and geographical distance.
4. Origin and Frequency of Target surnames
Since the Medieval period, it has been common practice for English children to take the surname of their father (Sykes and Irven, 2000). The majority of Indian and Zulu surnames originated from a family’s local language. Generally, the meaning of the surname was derived from a family’s geographical origin or profession and/or social status, and in some cases the surname also indicated the caste. In these groups, surnames were also passed down from father to child.
Children taking their fathers surname has become a common practice since the English Mediaeval period. The majority of Indian and Zulu surnames originated from a family’s local language. Generally, the meaning of the surname was derived from a family’s geographical origin or profession and/or social status, and in some cases the surname also indicated the caste. Table 1 shows the surname frequency of the North Indian, South Indian and Zulu surname sub-groups used in this study.
Table 1: Surname frequency world wide and in SA
Ranking = Ranking position as most common surname. ~ n = Approximate number of people sharing the surname.
Adapted from Forebears (2016) and Name Stats SA (2016).
1. North Indian surnames 2. South Indian Surnames
Surname Location Ranking ~ n Surname Location Ranking ~ n a. Singh World 6th 36 970 960
a. Govender World 2 487th 220 815
SA 15th 182 936 SA 2nd 364 936
b. Maharaj World 5 559th 98 287
b. Naidoo World 1 719th 315 434
SA 46th 84 708 SA 1st 498 108
c. Khan World 12th 24 514 296
c. Pillay World 2 409th 227 413
SA 38th 96 720 SA 4th 324 376
3. Zulu surnames
Surname Location Ranking ~ n Surname Location Ranking ~ n a. Cele World 12 678th 41 824
d. Buthelezi World 9 716th 55 471
SA 328th 18 252
b. Zulu World 1639th 330 394 SA 205th 27 560
SA 177th 30 212
e. Dlamini World 1 609th 336 164 c. Mkhize World 6 552th 83 094
SA 150th 34 632 SA 64th 63 024
4.1. Surnames of Indians transported to Natal
When transported to SA, the Indian settlers were asked for their surname or, in the case of those who did not understand, their ‘father’s name’. Confused by what this meant, many listed their father’s first name as their surname. This resulted in the founding of new surnames, which creates difficulties when attempting to trace back ancestry. The surnames collected as the experimental sample in this study, Khan, Maharaj and Singh, are ranked in the top 50 commonest surnames in SA (Name Stats SA, 2016). These are regarded as ‘highest caste’
surnames.
4.1.1. North Indian Surnames
The Singh surname ranks as the 2nd most common surname in India (1:35 people), followed by SA (1:500 people) and the United States (1: 2 533 people) (Forebears, 2016). It is still a common surname for many North Indian Hindus. It is the most common North Indian Hindu surname in SA (Name Stats SA, 2016). Singh, originating from India, is derived from the word simba, meaning ‘lion’ in Sanskrit (Feuerstein, 2002). Singh is commonly used as a surname as well as a title and middle name. This surname is associated with power and authority, and was adopted by people of multiple castes (Chaudhary, 1995). Spelling variations include ‘Sinh’, and ‘Sing’. In the 16th century, this surname became popular amongst Rajputs (a clan derived from the Sanskrit term ‘raja-putra’, meaning ‘son of a king’) and in 1699 it was adopted by Sikh followers of Guru Gobind Singh (Chander, 2003). Singh was used as a title by several groups in the 18th century. This surname is found throughout the Indian sub-continent, amongst several
communities and religious groups (Singh, 1996) and it is only out of India where it is known to be a true surname (Brook, 2017).
The Maharaj surname has the highest frequency in SA (1: 962 people) and is the second highest frequency in India (1: 76,631 people) (Forebears, 2016). Maharaj originated from the word Maharaja, meaning ‘great king’ in Sanskrit. Spelling variations include Maraj, Maharajh and Maharaja. It has the frequency in Trinidad and Tobago, where it is the 8th most common surname (Forebears, 2016). However, there is still confusion surrounding the origin of this
surname. Most people identify a Maharaj as someone from Brahmin decent (Figure 4), however, this is not always the case. Maharaj was also used as a title to represent someone who was a master of a particular skill, and as such could be a guru (priest) or even a cook (Orie, 2013).
The Khan surname is most commonly found in Pakistan (1:15 people) (Forebears, 2016). In India 1 in 281 people bear this surname, and in SA, 1 in 734 people (Forebears, 2016). Khan originated, around 4000 BCE, as a title given to a Prince or Lord amongst Mongolian and Turkish tribesmen (Yule and Burnell, 1996; Brook, 2017). This surname was owned by Genghis Khan, an emperor also known as the ‘Great Khan’, who established a historical empire ranging from Turkey to China (Brook, 2017). According to Zerjal et al. (2003), approximately 16 million Asian men are descendants of Genghis Khan. Khan is a common surname in China, belonging to 1:734 people (Forebears, 2016). Khan is most commonly used as a surname amongst the Muslim population of Pakistan. It has a frequency of 1:15 among the Pakhtoon people. where it ranks as the most common surname. In Bangladesh, it is borne by 1:31 people and in India, 1:281 people (Forebears, 2016). The absorption of this name into the Muslim population had nothing to do with Islamic religion, but was a title given, during the British era in India, to ‘loyal
Muslims’ (Phukan, 2011).
4.1.2. South Indian Surnames
The Govender surname is most commonly found in SA (1:254 people) and is not as frequent in India (1: 43 035 172 people) (Forebears, 2016). The name Govender originated in Lanarkshire, Scotland. They were owners of the land ‘Govan’’. The name was derived from two Saxon words meaning ‘good wine’(Lewis, 1851). Spelling variations of this family name include ‘Govan’.
The Naidoo surname is the 1st most frequency surname in SA (Table 1) (1: 180 people) and is greater than that in India (1: 20 459 344 people) (Forebears, 2016). Naidoo is a Tamil surname from the Naitea clan (also known as Navãyats) (Forebears, 2016). It is used as a title by the Telegu community (Kumari, 1998). Spelling variations include ‘Naidu’.
The Pillay surname is found at greatest frequency in SA (1:273 people); it has the fourth highest frequency in India (1: 343 334 people) (Forebears, 2016). Pillay is a Tamil surname, meaning
‘child’. It was derived from the word ‘Pilav’, which refers to an oriental dish of stewed meat and rice (Forebears, 2016). Spelling variations include ‘Pillai’, which is used more as a title, meaning
‘prince’.
4.2. Zulu Surnames
Zulu people are of Bantu decent, and arrived in SA in the 9th century (Contralesa, 2016). They are the largest ethnic group in SA, where IsiZulu is the most common home language, spoken by 11.58 million people in SA (22.7%) (Stats SA, 2011). Y-STR data from Zulu males, generated by Siyethaba Mkhize and part of the lab database, were included in these analyses for
comparative purposes. The Zulu males included in the study had the surnames Buthelezi, Cele, Dlamini, Mkhize and Zulu.
The Cele surname is most commonly found in SA (1:1410 people) (Forebears, 2016). Cele is derived from the old English word ‘saelig’ which means ‘one who is happy and blessed’
(https://www.houseofnames.com/cele-family-crest).
The Zulu surname is most commonly found in Zambia (1:71 people) and second most
commonly in SA (1:870 people) (Forebears, 2016). Zulu means ‘heaven’ in the Zulu language, deriving from the Nguno Tribe (Forebears, 2016). The Zulu clan was formed in Northern KZN in 1709 by Zulu kaMalandela (Contralesa, 2016).
The Mkhize surname is most commonly found in SA (1:70 people) (Forebears, 2016). The Buthelezi surname is most commonly found in SA (1:1009 people) (Forebears, 2016). The Dlamini surname is most commonly found in Swaziland (1:7 people) and second most commonly in SA (1:382 people) (Forebears, 2016).
5. Patterns of transmission of surnames and haplotypes/haplogroups
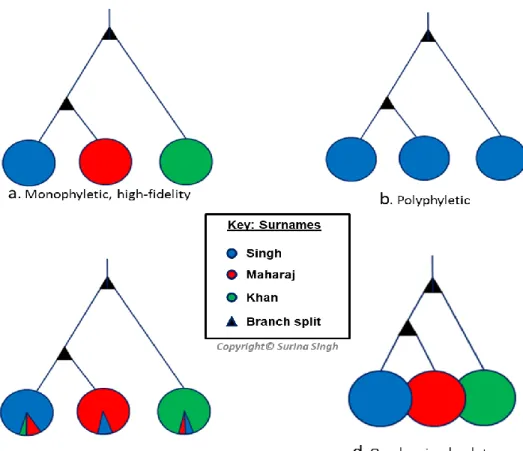
According to Jobling (2001), surnames may be monophyletic i.e. derived from a founder (Figure 5a) or polyphyletic, derived from multiple founders (Figure 5b).Transmission of surnames occurs with low fidelity when there is a disturbance between the co-transmission of the
surname and the Y-chromosome (Figure 5c). If surnames have genetically similar founders, then overlapping haplotypes would occur (Figure 5d).
Monophyletic, with high fidelity (Figure 5a) is the ‘ideal’ method of surname transmission.
Here, each surname has a unique founder whose haplotypes are highly diverged from those of the other founders. The haplotypes, therefore, do not overlap and there will be no haplotypes shared between surnames. If each surname has a unique founder, but the founders are not highly diverged from each other, then overlapping haplotypes will occur, and people with different surnames can share Y-STR haplotypes (Figure 5d).
Transmission of surnames may be high fidelity in situations, where a child always derives its surname from its biological father. However, there are several situations which are likely to cause surnames to be transmitted with less fidelity i.e. ‘low fidelity transmission’. These include situations where the child does not take the surname of the true father; the child might be conceived via a partner who is outside of the marriage (or current relationship) in which the mother is involved and takes the name of her husband/partner; the mother might choose to retain her surname and pass it on to the child; or the child might be adopted and bear the name of the adoptive parents (Figure 5c) (Jobling and King, 2004).
Figure 5: Possible relationships between Y-chromosomal haplotypes and surname transmission.
An illustration of the phylogenetic patterns expected in the case of different modes of surname transmission for three different surnames, based on Jobling (2001).
In many cultures, both surnames and the Y-chromosome are passed down from father to son.
Thus, people with the same surname should have a greater chance of being related to each other than to members of the general population (King and Jobling, 2009).This makes it possible to trace male lineages based on surnames.
In the ‘ideal’ situation, each surname might form an independent Y-chromosome based haplotype cluster (this might be regarded as the equivalent of a null hypothesis relating to surname and Y-chromosome transmission). These clusters would be distinct from each other and not contain haplotypes found in other surnames i.e. monophyletic transmission with non- overlapping haplotypes (Jobling, 2001), allowing surnames to be predicted from Y-STR
haplotypes, which would be of use in forensic genetics.
Several aspects of human population history, in particular large-scale patterns of migration, can be explored by analysis of the inheritance of Y-STRs (Jobling and Tyler-Smith, 2003).
Most of the Indian paternal population (> 50%) belongs to the R1a1, O2a, and H mitochondrial haplogroups (Sahoo and Kashyap, 2006). Haplogroups A, B and E are most commonly found in the African ethnic groups of SA (Motladiile, 2004). In SA, the haplotype diversity between four different ethnic groups (Zulu, Coloured, Afrikaner and Indian) was found to be 0.9981 (Tsiana, 2015). Solé-Morata et al. (2015), found that HD of Catalan surnames in Catalonia was positively correlated with surname frequency, and the inheritance of these surnames was monophyletic with high-fidelity. Monophyletic transmission was also observed by Sykes and Irven (2000) who found that almost half of their samples with the surname ‘Sykes’ in United Kingdom, shared the same Y-chromosome haplotype, even though it was predicted that this surname originated in many different regions (i.e. was predicted to be polyphyletic). This pattern was not found in the control group (random male individuals), which contained samples from the same geographical region. The average rate of non-paternity was estimated to be 1.3% per generation during the past 700 years.
6. The Y-chromosome
Discovered in 1905, the Y-chromosome (Figure 6) is a single copy sex chromosome found only in males. The Y-chromosome, about 60 megabytes (Mb) in size, is one of the smallest
chromosomes found in the human genome (Skaletsky et al., 2003) and comprises
approximately 2% of the total Deoxyribonucleic acid (DNA) (Seyedebrahimi et al., 2017). The parental ancestor of all modern Y-chromosomes is assumed to come from Africa (Out of Africa concept) (Seielstad et al., 1999). The first STR polymorphism, discovered in 1992 by Roewer et al. (1992), lead to the foundation of Y-chromosome evolution studies (Page et al., 2010;
Bachtrog, 2013; Kayser, 2017).
The Y-chromosome is essentially haploid in state and is made up of the pseudoautosomal regions (PAR) at the tips and a central non-recombining region of the Y-chromosome (NRRY) (Figure 6). During meiosis, recombination is limited to the PAR i.e. PAR 1 (less than 1mb) and 2 (approximately 2.5mb), found at the tip of the short arm (Yq) and long (Yp) arm respectively (Graves et al., 1998). The NRRY (Figure 6) is more commonly referred to as the male-specific region of the Y-chromosome (MSY) and comprises 95% of its length. The MSY represents a useful source of polymorphisms for the forensic analysis of male DNA (Jobling and King, 2004).
The paternally inherited MSY remains intact throughout generations, unless a mutation occurs (Quintana-Murci et al., 2001; Kwak et al., 2005; Butler, 2011). Since both DNA and surnames are passed down from our ancestors in many cultures and traditions, people with the same surname should have a greater chance of being related to each other than to members of the general population (King and Jobling, 2009). Since most surnames are inherited surname studies can trace male lineages.
Figure 6: Y-chromosome structure.
An illustration of the Y-chromosome, indicating: the Yp (long arm), and Yq = (short arm); PAR (pseudoautosomal region) 1 and 2; the non-recombining region/ MSY (male specific region of the Y-chromosome) which contains: the
heterochromatic region (non-functional genes), euchromatic region (functional genes), centromere, and the SRY (sex-determining region of the Y-chromosome).
6.1. The importance of Y-chromosome testing in forensics
Descendants from the same male lineage often share a Y-STR haplotype; this is due to the lack of recombination during meiosis, resulting in no variation or very little variation (in the case of a
mutation) from generation to generation. According to Zhivotovsky et al. (2004), the average Y- chromosome mutation rate is 6.9 x 10⁻⁴ per 25 year period (Butler, 2005, 2014). Thus, male family lineages will share a Y-STR haplotype for many generations until a mutation occurs.
Y-chromosome DNA profiling has important applications, especially in forensics. It can be used to eliminate and/or contribute to identifying a male perpetrator by comparison with other suspect profiles (unless the suspects come from the same paternal lineage). In paternity testing it can provide evidence on the likelihood of a male being the father of a child, as they would be expected to share the same Y-STR profile, unless a mutation had occurred; again, if other male members of the same lineage were also potential fathers, this method would not be helpful (Khan et al., 2017). It is used in other paternal kinship analyses such as historical cases and for familiar searching such as the Vaatstra case. It is also used in male related missing person and victim identification cases (Kayser, 2017).
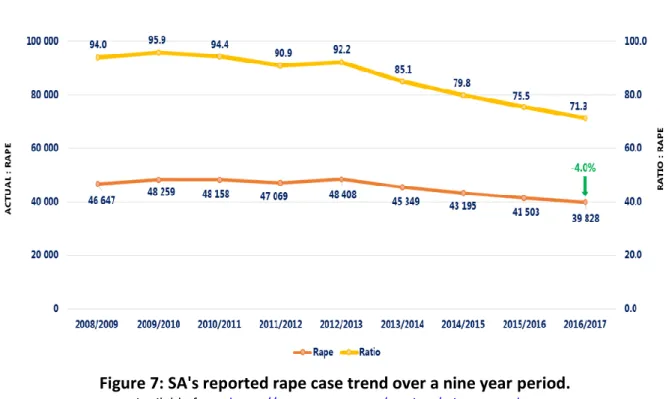
Sexual offences, specifically rape, are a serious problem especially in SA, therefore an effective system to catch perpetrators is required. SA has one the highest number of rape reports, therefore, a large growing database plays a critical role in establishing a more stable approach in how strong Y profiles can play in forensic investigations (Brenner, 2010; Andersen et al., 2013; Andersen and Balding, 2017; Cereda, 2017). According to the South African Police Service annual crime report (https://www.saps.gov.za/services/crimestats.php) the prevalence of rape has steadily decreased since 2012/2013 (Figure 7),which could have decreased due to the development of the DNA act in 2013.
The Criminal Law (Forensic Procedures) Amendment Act No. 37 of 2013, also known as the
"DNA Act", allowed for the development of a forensic DNA database in SA. This DNA act entitles the SA police services to collect DNA generate DNA profiles and match profiles of the reference samples to crime scene samples. However, getting access to a refence sample is not allows guaranteed. This places limitations on the use of DNA as an investigative tool. SA law also prevents the use of molecular typing phenotyping i.e. DNA cannot be used in any analyses
pertaining to health/ medical testing, nor can it be used to find other any other physical information other than the gender of a person (Slabbert and Heathfield, 2018).
Figure 7: SA's reported rape case trend over a nine year period.
Available from: https://www.saps.gov.za/services/crimestats.php.
Y-STR loci are useful in investigation of rape cases as: 1) It is possible to generate the male perpetrator’s Y-STR profile from biological evidence left behind at the crime even if only mixed samples are available; 2) Male Y-STR profiles are unambiguous, even in the presence of excess amounts of female DNA; and 3) The number of male contributors can be identified, as the non- recombining region is haploid (Shewale et al., 2004; Khan et al., 2017). In SA, D’Amato et al.
(2011) assessed the use of 10 non-commercial Y-STR markers (DYS385a/b, DYS447, DYS449, DYS481, DYS504, DYS518, DYS612, DYS626, DYS644, and DYS710) in forensic analyses of sexual assault for the African, White and Asian/ Indian population and found these markers give higher levels of diversity and discrimination capacity (DC) when compared with common commercial markers.
Evaluation of different non-commercial Y-STR marker sets in SA revealed, as might be expected, that the greater the number of markers, and the higher their diversity, the more useful the
marker set is for forensic applications (Leat et al., 2004; Ehrenreich, 2005; Leat et al., 2007;
D’Amato et al., 2011; Tsiana, 2015).
6.2. Polymorphic Y-chromosome markers
The two major categories of Y- chromosome markers are Y-SNPs and Y-STRs (also known as microsatellites). Convenient polymorphic Y-SNPs and Y-STR markers have been identified on the non-recombining portion of the Y-chromosome (Jobling and Tyler-Smith, 1995).
SNPs are the most abundant type of polymorphism found in the human genome, and occur at approximately 1 in every 1000 bases (Sachidanandam et al., 2001). Discovered in 1994 by Hammer (1994), Y-s are slow-mutating binary polymorphisms, with mutations occurring at a rate of approximately 10-8 per base per generation (Jobling and King, 2004). They are classified into haplogroups i.e. groups related by descent from a common ancestral SNP haplotype.
In contrast, microsatellites (STRs) are fast mutating multi-allelic markers. Large numbers of haplotypes are usually found within haplogroups and can be used to estimate the Time to the Most Recent Common Ancestor (TMRCA) (Jobling, 2001). STRs comprise ~ 3 % of the human genome, and are found in both the autosomes and sex-chromosomes, including the Y- chromosome (Ehrenreich, 2005). The number of tandem repeats varies among individuals, making these polymorphic makers useful in HID (Moxon and Wills, 1999).
The Y-STR locus DYS385 and the forward primer-binding site of DYS389 are duplicated on the Y- chromosome. Whilst undergoing polymerase chain reaction (PCR) using a single primer set, two fragments are created for DYS385, i.e. DYS385a and DYS385b, if different alleles are present on the two duplicates of this locus. DYS389 yields two products i.e. DYS389I and DYS389II, which differ in length by approximately 100bp (Ehrenreich, 2005). As Y-STRs are highly polymorphic, they are useful in identifying and comparing closely related populations (Tsiana, 2015).
The use of Y-SNPs in deter