Research Article
Species composition and above ground biomass of a pine forest at Bodogol,
Gunung Gede Pangrango National Park, West Java
*
Laode Alhamd and Joeni Setijo Rahajoe
Laboratory of Ecology, Botany Division, Research Center for Biology, Indonesian Institute of Sciences, Jalan Raya Jakarta Bogor KM. 46, Cibinong Science Center, West Java, Indonesia. *email: [email protected]
ABSTRACT. Species Composition and Above Ground Biomass (AGB) of a pine forest at Bodogol in Gunung Gede Pangrango National Park (GGPNP) was conducted over three years. A
2
permanent plot of 200 x 50 m was established and was then divided into 100 subplots sized 10 x 10
2
m . The highest Important Value was reached for Tusam (Pinus merkusii) with IV=140.9, followed by Calliandra calothyrsus (94.4) and Piper aduncum (28.9). In contrast, the Relative Growth Rate of C. callothyrsus was highest compared to other dominant trees. The number was highly contributed by a class distribution of less than 10 cm, generally filled by other species except pine trees, that were found on class distribution of more or equal to 30 cm. The changes of AGB ranged
-1
from 247.2 to 328.6 ton ha , and the trend of increasing AGB may be attributed to the growth of pine trees. However, it showed that there are significant differences between 2009 and 2010 - 2011 (one way ANOVA, P<0.05).
Keywords: AGB, Gunung Gede Pangrango NP, Relative Growth Rate, Pinus merkusii.
INTRODUCTION
Tusam or Sumatran pine (Pinus merkusii) is a pine native to the Malesia region in Southeast Asia. In Indonesia, it is mainly found in the mountains of northern Sumatra, with two outlying populations in central Sumatra on mounts Kerinci and Talang. In GGPNP, Sumatran pine was planted to rehabilitate the area mainly in the slope region and this was carried out by the
state forest corporation, Perum Perhutani and local people around the national park.
Above ground biomass (AGB) and carbon storage in the forest ecosystem play an important role in the global carbon cycle (Goodale et al., 2002; Houghton, 2005). Forests as carbon reservoirs store more carbon per unit area than any other terrestrial ecosystem; they may act as an effective measure to mitigate elevated atmospheric carbon dioxide (CO ) concentration 2 through an increase in forested land. As a member, Indonesia is seeking to implement its commitments under the UNFCCC (United Nations Framework Convention on Climate Change) through nationwide amelioration of forest conditions to increase the level of carbon storage in the forest ecosystem and to reduce carbon emission up to 26%.
The 15,196 ha forest area in the GGPNP was expanded to 21,975 ha (Decree of the Ministry of Forestry No.174/Kpt.s-II/ June 10, 2003). The expanded area included the Perum Perhutani, located on the border of the park and close to residents. Common species found are the Agatis (Agathis philippinensis), Tusam (P. merkusii) and Kaliandra trees (Calliandra calothyrsus). Tusam is a plant that can be used in reforestation as pine has several functions including ecologically protecting land and timber production. In addition, pine is competitive to other plants, whereby it can prevent other plants from growing too close, thus stopping them from taking space and nutrients available (Marisa, 1990).
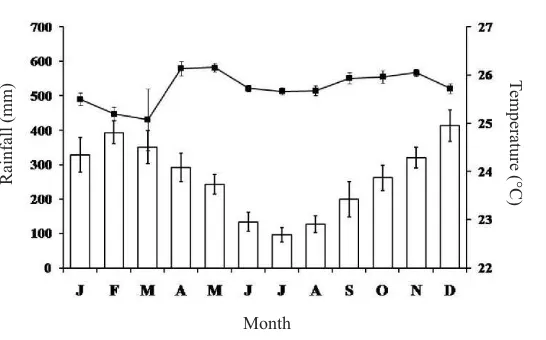
Figure 1. Monthly changes of rainfall (histogram) and temperature (black square) within nine years (2002-2010). Data was collected from a Meteorological Station close to Gunung Gede Pangrango National Park (GGPNP). Data represents as mean ± SE.
A few studies have investigated species composition and AGB in the pine forest in GGPNP, with most studies of forest composition and structural patterns concentrating on the mountainous and lowland vegetation of natural forests (Abdulhadi et al., 1998; Sadili et al., 2009; Yamada, 1975; Helmi et al., 2009). Measurement of permanent sampling plots at certain intervals and over a one-year period is required to understand the process in which changes occur at individual and even species levels. However, there are no data on balance between growth, recruitment and mortality. Thus, the objective of the present study is to provide information on composition and AGB of pine forests over a three year period in Bodogol, GGPNP.
METHODOLOGY
Study site
This study was carried out at a lowland pine forest at Bodogol in the Gunung Gede Pangrango National Park (GGPNP), which is
situated at 06º46’5.47” S and 106º51’11.0” E at about 800 m above sea level (asl). The topography of the area is that of a hilly ridge with steep slopes. The characteristic of soil include acidic soil of pH 4.4, 13.8 of C/N ratio,
-1
16 mg (100 g of soil) of phosphor, while other macro nutrients of calsium (Ca), magnesium (Mg), potassium (K), and sodium (Na) were
-1 respectively 3.7, 1.5, 0.1 and 0.2 cmol (g soil) .
According to Schmidt & Ferguson (1957), the climate in the study area belongs to type A with mean annual rainfall of approximately 3121.3 mm ± 131.3 (SE). Based on calculated data of climate for nine years, rainfall tended to be low during the dry season recording 133.3 to 199.2 mm (July to September), while the wettest time is from December to March with rainfall reaching to 414.2 mm in December. The monthly temperature varied from 25.1 to 26.2 ºC, with mean monthly temperature of 25.7 ºC ± 0.2 (SE). High fluctuation of temperature was recorded in March at 25.1 ºC ± 0.6 (SE), as shown in Figure 1.
Temperature (°C)
Month
Sampling plots
2
A permanent plot of 200 x 50 m was established in the pine forest and was divided into 100 subplots of
2
10 x 10 m each to allow better control of measurement. The first enumeration of the plot was made in 2009. All trees with girth breast height (gbh) of more or equal to 15 cm were labeled with aluminum tags, identified, measured and recorded on a 1.3 m above ground or above buttress level. Re-measurement two times in 2010 and 2011 were done, and recruitment tree (new individuals growing up to 15 cm in gbh) and dead trees were recorded. A similar measurement was also conducted for all surviving and recruited trees. All species recorded were collected as voucher specimens for further scientific identification.
Data analysis
The density, frequency and dominance of expressed basal area, the relative value and importance value of each species were measured by the equation of Mueller-Dombois & Ellenberg (1972). The growth was calculated based on girth increment of surviving trees, as relative growth rate (RGR) by Kohyama & Hotta (1986), as follows:
RGR = (ln G10 – ln G09)/t
where G09 and G10 are the girth at breast height in the first and the second measurement respectively, and t is period of study in year.
A similar calculation was performed between the second and third year and between the first and third year. Above ground biomass was estimated/calculated using the allometric equation developed by Midgley (2003).
RESULTS AND DISCUSSION
Species Composition
The total number of species recorded in the sampling plot was 29. The total number of individual trees in the sampling plot decreased
-1 -1
from 841 trees ha (2009) to 779 trees ha (2011). The total basal area ranged from 33.9 in
2 -1
2009 to 36.9 m ha in 2011. The most dominant species in terms of important value (IV) within the three year period was Pinus merkusii, which reached about 50% of IV (140.9), followed by Calliandra calothyrsus (94.4) and Piper aduncum (28.9 of IV) (Table 1). The high IV of pine trees could be attributed to the large stem circumference and its occurrence in all sub-plots. The 23 other species that grow naturally with pine vegetation had an IV lower than 10.
Table 1. Fifteen leading tree species based on Important Value (IV) of pine forest at Bodogol, GGPNP (2009-2011).
Species name
Pinus merkusii Jungh. & De Vr.
Calliandra calothyrsus Meiss.
Piper aduncum L.
Maesopsis eminii Engl.
Dendrocnide stimulans
Omalanthus populneus (Geisl.) Pax
Cecropia peltata L.
Arthocarpus elasticus Bl.
Payena lucida (Don.) DC.
Mallotus paniculatus (Lam.) Mull.
Schima wallichii (DC.) Korth.
Pithecolobium clypearia Bth.
Bridelia monoica Merrill
Trevesia sundaica Miq.
Peronema canescens Jack.
Tree density and relative growth rate
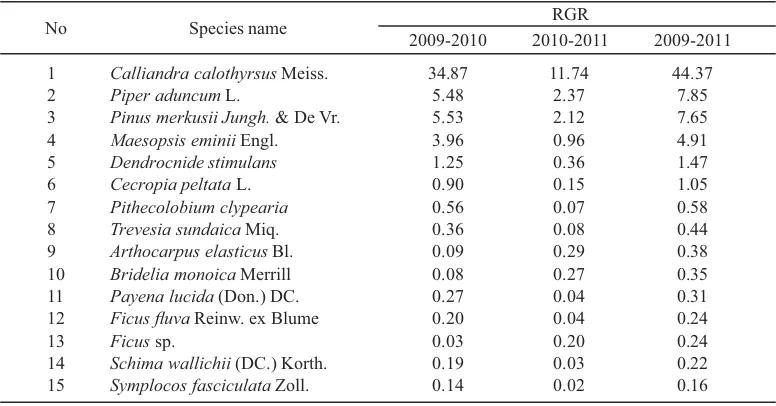
The tree density decrease because the increment of tree density from recruitment was lower than the trees loss to mortality, such as C. calothyrsus. The death of this species was 12.5% due to the steep area. The relative growth rate (RGR) of C. calothyrsus was highest and could influence the number of individuals despite a small increase in stem diameter RGR. The increase of tree density also was followed by increase of basal area, although the recruited trees were lower than that lost through mortality. Pine trees covered the highest basal area, reaching 89.3 (2011) to 91.0% (2009) of the total basal area in the sampling plot, although the RGR was lower than C. calothyrsus and Piper aduncum (Table 2). However, the differences both in density and basal area were not significant (ANOVA, P>0.05).
The species that disappeared from the plot occurred at low density (one or two trees per ha), and any cause of mortality might eliminate them from the plots. However, in their absence, they might be replaced by newly recruited trees due to ingrowth. Some of the species found in the plot had low density, only less than one tree per ha, as typically found in a tropical rain forest (Whitmore, 1984).
The mean diameter increment of all -1 species ranged from 0.2 to 1.0 cm yr . This range value is comparable to those reported in some tropical rain forests in Southeast Asia (Nicholson, 1965; Manokaran & Kochummen, 1993; Sist et al., 2002), but a bit lower compared to the Amazonian rain forest (Nebel et al., 2001; Silva et al., 2002; Laurence et al., 2004). Some of the previous studies reported that the growth pattern was highly dependent on tree size. Based on absolute growth rate, it was found that big trees tended to have quicker growth as larger trees occupy the canopy and have more energy supply and higher photosynthetic rates. Some studies on pine tree areas showed that only several trees could grow under the pine canopy as pine leaf litter on the ground produce allelopathy substrates that inhibit tree growth (Marisa, 1990).
Forest structure
In three years, the number of individuals decreased and showed similar trends in a higher diameter class of 40-50 cm (Figure 2). The number was highly contributed by the class distribution of less than 10 cm, which was generally filled by other species of pine, while pine trees were found on class distribution of more or equal to 30 cm.
Table 2. Relative Growth Rate (RGR) of 15 leading species in year 2009, 2010 and 2011.
Species name
Calliandra calothyrsus Meiss.
Piper aduncum L.
Pinus merkusii Jungh. & De Vr.
Maesopsis eminii Engl.
Dendrocnide stimulans
Cecropia peltata L.
Pithecolobium clypearia
Trevesia sundaica Miq.
Arthocarpus elasticus Bl.
Bridelia monoica Merrill
Payena lucida (Don.) DC.
Ficus fluva Reinw. ex Blume
Ficus sp.
Schima wallichii (DC.) Korth.
Symplocos fasciculata Zoll.
In horizontal (diameter) and vertical (height) structures, almost no tree species except pine, had parameters larger than pine trees due to the characteristics of non-shaded tolerant species. No significant differences were found in structures over three years (ANOVA, P>0.05), although the number of individuals decreased over time.
Above ground biomass
From the measured variables, the diameter and height and the above ground biomass (AGB) of each tree was calculated. Then, AGB of all trees was summed up to estimate the AGB of each tree for each measurement (Figure 3). The
changes of AGB ranged from 247.2 to 328.6 -1
tonne ha , and the trend of increasing AGB may be attributed to the growth of pine trees. However, it showed that there are significant differences between 2009 and 2010-2011 (ANOVA, P<0.05). Most species showed
-1 smaller change, lower than one tonne ha in AGB during the three year period, indicating that carbon uptake by these species was limited over that period.
Compared to other tropical regions, it showed that the AGB, in the present study, was lower than the AGB formula used by Brown (1997) and Chave et al. (2005). The similar pattern of estimating AGB for all individual trees is shown in Figure 3.
Figure 3. The biomass estimation of trees in the respective years of 2009, 2010 and 2011 at pine forest of GGPNP. Green line represents the estimation of AGB in the present study, while the brown and blue lines indicate the estimation of AGB by Chave et al. (2005) and Brown (1997), respectively.
2009 2010 2011
Year 700
600
500
400
300
200
100
0
-1
Individual tree ha
<10
10-20
20-30
30-40
40-50
50-60
60-70
Figure 2. Diameter distribution in the respective years of 2009 to 2011 in pine forest of GGPNP.
Diameter (cm)
-1
AGB (kg ha
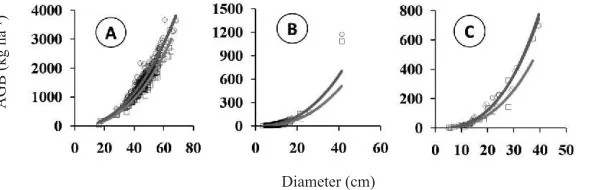
The pine tree contributed high AGB over three years compared to other species, ranging
-1
from 238.4 to 315.3 tonne ha , followed by Calliandra calothyrsus (4.96 to7.50) and -1
Maesopsis eminii (1.69 to 2.78 tonne ha ) (Figure 4). High contribution of AGB was highly affected by diameter and height variables, and even some studies related to specific gravity value of species (Ketterings et al., 2001; Chave et al., 2005).
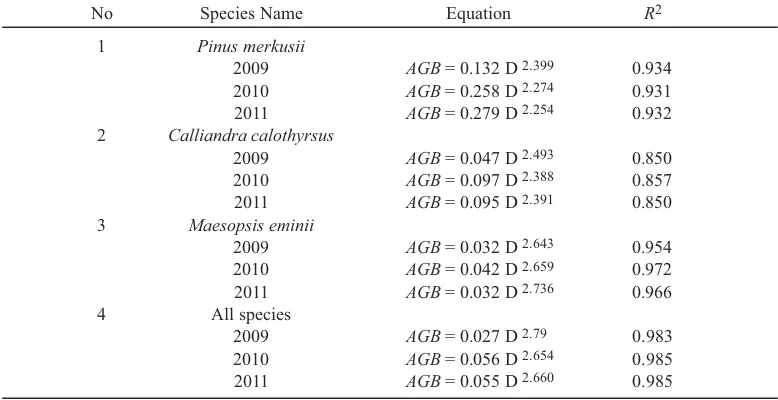
Significant differences between years, 2009 and 2010-2011, in each species was found
only in pine trees (one way ANOVA, P<0.05). The similar pattern of estimating AGB for each dominant species is shown in Figure 4. The trend line of each equation is listed in Table 3
2
with high correlation coefficient (R ). High 2
value R could be influenced by the class distribution of each species, as all species had the highest value. For the dominant contribution species, it is clear that the African tree (M. eminii) had higher value compared to the other two species, suggesting the fitting formula would be more fixed if the class diameter was randomly distributed.
Table 3. The equation for estimating above ground biomass (AGB) in pine forest at Bodogol, GGPNP (2009-2011).
Pinus merkusii
2009 2010 2011
Calliandra calothyrsus
2009 2010 2011
Maesopsis eminii
2009 2010 2011 All species
2009 2010 2011
2.399
AGB = 0.132 D 2.274
AGB = 0.258 D 2.254
AGB = 0.279 D 1
2
3
4
Species Name Equation R2
Figure 4. The high contribution of AGB in the respective years of 2009, 2010 and 2011 at pine forest of GGPNP. A. Pinus merkusii, B. Calliandra calothyrsus and C. Maesopsis eminii. Line types as in Figure 3.
2.493
AGB = 0.047 D 2.388
AGB = 0.097 D 2.391
AGB = 0.095 D 2.643
AGB = 0.032 D 2.659
AGB = 0.042 D 2.736
AGB = 0.032 D 2.79
AGB = 0.027 D 2.654
AGB = 0.056 D 2.660
AGB = 0.055 D
0.934 0.931 0.932 0.850 0.857 0.850 0.954 0.972 0.966 0.983 0.985 0.985 No
Diameter (cm)
-1
AGB (kg ha
CONCLUSION
The changes in density and basal area in the pine forest were a bit lower than those found in several other tropical forests. The differences were probably due to more species have entered the plot and more recruited trees passing the minimum diameter limit. The vegetation in the pine forest maintains its diversity, structural features and above ground biomass, and even carbon storage over the period of study. A longer period of monitoring with regular measurements is necessary to clarify these trends.
ACKNOWLEDGEMENTS
We are grateful to the Research Center for Biology of the DIPA Program for providing financial support. Thanks also go to staff of Gunung Gede Pangrango National Park (GGPNP) for permitting us to conduct this research, and to the people around the Bodogol area in GGPNP for their support in field work. Special thanks to anonymous reviewers for improving the previous version of this paper. Our thanks also go to Bayu, Jaka, Fauzi, Heru, Suhendra and Syarif for their support in the field and laboratory work.
REFERENCES
Abdulhadi, R., A. Srijanto & K. Kartawinata. 1998. Composition, structure, and changes in montane rain forest at the Cibodas Biosphere Reserve, West Java, Indonesia. In: Dallmeier, F. & J.A. Comiskey (eds.).
Forest Biodiversity Research, Monitoring and
Modeling. Conceptual Background and Old World
Case Studies. Man and the Biosphere Series 20: 601-612. Brown, S. 1997. Estimating Biomass and Biomass Change
of Tropical Forest. A Primer. FAO. USA. FAO Forestry Paper No.134.
Chave, J., C. Andalo, S. Brown, M.A. Cairns, J.Q. Chambers, D. Eamus, H. Folster, F. Fromard, N. Higuchi, T. Kira, J.P. Lescure, B.W. Nelson, H. Ogawa, H. Puig, B. Riera & T. Yamakura. 2005. Tree allometry and improved estimation of carbon stocks and balance in tropical forests. Oecologia
145: 87-99.
Goodale, C.L., L.S. Heath, R.A. Houghton, J.C. Jenkins, G.H. Kohlmaier, W. Kurz, S. Liu, G.J. Nabuurs, S. Nilsson, A.Z. Shvidenko, M.J. Apps, R.A. Birdsey & C.B. Field. 2002. Forest carbon sinks in the Northern Hemisphere. Ecological Application
12: 891-899.
Helmi, N., K. Kartawinata & I. Samsoedin. 2009. An undescribed lowland natural forest at Bodogol, The Gunung Gede Pangrango National Park, Cibodas Biosphere Reserve, West Java, Indonesia.
Reinwardtia 13(1): 33-34.
Houghton, R.A. 2005. Aboveground forest biomass and the global carbon balance. Global Change Biology 11: 945-958.
Laurence, W.F., H.E.M. Nascimento, S.G. Laurence, R. Condit, S. DAngelo & A. Andrade. 2004. Inferred longevity of Amazonian rain forest trees based on a long-term demographic study. Forest Ecology
Management 190: 131-143.
Marisa, H. 1990. Pengaruh Ekstrak Daun Pinus (Pinus
merkusii Jungh. & De Vriese) terhadap
Perkecambahan dan Pertumbuhan Vegetatif Tanaman Kedelai (Glycine max (L.) Merr.). Tesis
Pasca Sarjana Biologi. Institut Teknologi Bandung.
Bandung. (In Indonesian).
Manokaran, N. & K.M. Kochumen. 1993. Tree growth in Primary lowland and hill Dipterocarp forest. Journal
of Tropical Forest Science 63: 332-345.
Mueller-Dombois, D. & H. Ellenberg. 1972.Aims and
method of vegetation ecology. John Wiley and Sons,
New York.
Midgley, J.J. 2003. Is bigger better in plants? The hydraulic costs of increasing size in trees. Trends Evolution
Ecology 18: 5-6.
Nebel, G., L.P. Kvist, J.K. Vanclay & H. Hidaurre. 2001. Forest dynamics in flood plain forest in the Peruvian Amazon: effects of disturbance and implications for management. Forest Ecology Management 150: 79-92. Nicholson, D.I. 1965. A review of natural regeneration in
the dipterocarp forests of Sabah. Malaysian Forester
28: 4-18.
Sadili, A., K. Kartawinata, A. Kartonegoro, H. Soedjito & A. Sumadijaya. 2009. Structure and composition of subalpine summit habitats on Mt. Gede Pangrango cmplex, Cibodas Biosphere Reserve, West Java, Indonesia. Reinwardtia 12(5): 391-404.
Silva R.P.Da., J. Dos Jantos, E.S. Tribuzy, J.Q. Chambers, S. Nakamura & N. Higuchi. 2002. Diameter increment and growth patterns for individual tree growing in Central Amazon, Brazil.
Forest Ecology Management 166 (1-3): 295-301.
Sist, P. & N. Nguyen-The. 2002. Logging damage and the subsequent dynamics of a dipterocarp forest in East Kalimantan (1990-1996). Forest Ecology
Management 165: 85-103.
Whitmore, T.C. 1984.Tropical rain forest of the far east nd
(2 edition). Clarendon Press, Oxford. 352 p. Yamada, I. 1975. Forest ecological studies of the montane