OLD-AGE POVERTY IN INDONESIA:
Empirical Evidence and Policy Options
A Role for Social Pensions
JAN PRIEBE AND FIONA HOWELL
ii
The TNP2K Working Paper Series disseminates the findings of work in progress to encourage discussion and exchange of ideas on poverty, social protection and development issues.
Support for this publication has been provided by the Australian Government through the Poverty Reduction Support Facility (PRSF).
The findings, interpretations and conclusions herein are those of the author(s) and do not necessarily reflect the views of the Government of Indonesia or the Government of Australia.
You are free to copy, distribute and transmit this work, for non-commercial purposes.
Attribution: Priebe, J. and F. Howell. 2014. “Old-Age Poverty in Indonesia: Empirical Evidence and Policy Options - A Role for Social Pensions”, TNP2K Working Paper 07-2014. Tim Nasional Percepatan Penanggulangan Kemiskinan (TNP2K), Jakarta, Indonesia.
To request copies of the report or for more information on the report, please contact the TNP2K - Knowledge Management Unit ([email protected]). The reports are also available at the TNP2K website.
TNP2K
Email: [email protected] Tel: +62 (0) 21 391 2812 Fax: +62 (0) 21 391 2513 Web: www.tnp2k.go.id
Empirical Evidence and Policy Options
JAN PRIEBE AND FIONA HOWELL
TNP2K WORKING PAPER 07 – 2014 March 2014
OLD-AGE POVERTY IN INDONESIA:
Empirical Evidence and Policy Options
iv
Table of Contents
Acknowledgements ... ix
Author Biographies ... x
Acronyms and Abbreviations ... xi
Executive Summary ... xii
1. Demographic Trends ... 1
2. Poverty and the elderly ... 6
Empirical evidence on old-age poverty in Indonesia ... 8
Measurement of poverty ... 8
Demographic aspects and poverty of the elderly ... 16
Poverty and household living arrangements ... 16
Robustness of old-age poverty rates ... 18
Socio-economic characteristics of the elderly ... 23
Education ... 23
Health ... 25
Labour ... 32
Pension coverage and inter-household transfers ... 36
3. Legal and policy background in Indonesia ... 39
Legal background ... 40
The ASLUT programme ... 43
Insights from the Unified Database ... 45
4. Alternative Policy Options ... 48
Pension systems internationally ... 49
Why social pensions? ... 55
Poverty-targeted vs. universal social pensions ... 56
5. Poverty impact: Ex-ante simulations on poverty-targeted vs. universal pension benefits ... 64
Ex-ante simulations on poverty and social pensions ... 66
Perfect targeting scenario ... 66
Targeting error scenario ... 67
Ex-ante simulations on fiscal costs ... 70
Current government spending ... 70
Estimates of the cost of social pensions ... 71
6. Strategic pathways for social pensions in Indonesia... 76
Policy options ... 77
Key actors on social pensions ... 79
TNP2K’s role ... 80
Bibliography ... 81
List of Figures
Figure 1: Demographic trends in Indonesia, population projections (2010 – 2050) ... 3
Figure 2: Demographic trends in Indonesia, population projections for elderly 60+ (2010-2050) ... 4
Figure 3: Predicted life expectancy in Indonesia, population projections (2010 – 2050) ... 5
Figure 4: Poverty rates in Indonesia, annual Susenas rounds (March) (2005 – 2012) ... 9
Figure 5: Poverty rates in Indonesia (vulnerability), annual Susenas rounds (March) (2005 – 2012) ... 10
Figure 6: Poverty rates for the Elderly in Indonesia, by gender, annual Susenas rounds (March) (2005 – 2012) ... 12
Figure 7: Poverty rates in Indonesia (urban/rural), annual Susenas rounds (March) (2005 – 2012) ... 13
Figure 8: Provincial poverty rates (%) in Indonesia (2012) ... 15
Figure 9: Poverty rates and age in Indonesia, adult equivalence scales (2012) ... 20
Figure 10: Poverty rate and age in Indonesia, economies of scale (2012) ... 21
Figure 11: Poverty and reported health problems in Indonesia (2012) ... 29
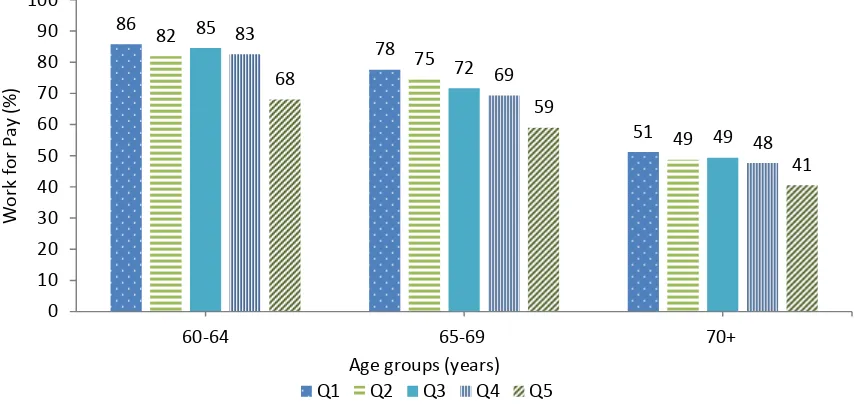
Figure 12: Expenditure quintiles and work among elderly men in Indonesia (2012) ... 35
Figure 13: Expenditure quintiles and work among elderly women in Indonesia (2012) ... 35
Figure 14: Composition of individuals targeted for social assistance programs (2012) ... 69
Figure 15: Targeting scenario, elderly 65+ in Indonesia (2012 – 2050) ... 74
vi
List of Tables
Table 1: Historical development trends in Indonesia (1961-2010) ... 2
Table 2: Overall population trends in Indonesia (2010-2050) ... 2
Table 3: Population projections for Indonesia by gender (2010 – 2050) ... 4
Table 4: Life expectancy projections for Indonesia in years, by gender (2010 – 2050)... 5
Table 5: Poverty rates for persons aged 60 and above, in Indonesia (2005 – 2012) ... 9
Table 6: Poverty rates in Indonesia, different poverty lines(2005 – 2012) ... 10
Table 7: Chronic vs. transient poverty rates among the elderly (2008-2010) ... 11
Table 8: Poverty rates for the Elderly in Indonesia, by gender (2005 – 2012) ... 12
Table 9: Poverty rates among the non-elderly in Indonesia (2005 – 2012) ... 13
Table 10: Rural-Urban poverty rates in Indonesia (2005 – 2012) ... 14
Table 11: Marital status in Indonesia in 2012 by age and gender ... 16
Table 12: Poverty rates in Indonesia in 2012 by living arrangements ... 17
Table 13: Living arrangements elderly-children in Indonesia (2012) ... 18
Table 14: Poverty rates and adult equivalence scales in Indonesia in 2012... 20
Table 15: Poverty rates and economies of scale in Indonesia (2012) ... 21
Table 16: Literacy rates (%) in Indonesia(2005 – 2012) ... 23
Table 17: Literacy rates in Indonesia by gender (2005 – 2012) ... 24
Table 18: Literacy rates (%) in Indonesia (2005 – 2012) ... 24
Table 19: Highest education degree obtained (share of individuals, %) in Indonesia (2005 – 2012) .. 24
Table 20: Highest education degree obtained among elderly (60+) (share of individuals, %) in Indonesia (2005 – 2012) ... 25
Table 21: Highest education degree obtained among elderly (60+) (share of individuals, %) in Indonesia (2005 – 2012) ... 25
Table 22: Disability in Indonesia (2010) ... 26
Table 23: Self-reported prevalence of sickness in Indonesia (2012) ... 27
Table 24: Self-reported prevalence of sickness among the elderly in Indonesia (2012) ... 28
Table 25: Self-reported outpatient treatment over last month (%) in Indonesia (2012) ... 30
Table 26: Self-reported inpatient treatment over last year (%) in Indonesia (2012) ... 30
Table 27: Self-reported outpatient treatment among the elderly over last month (%) in Indonesia (2012) ... 31
Table 28: Self-reported inpatient treatment among the elderly over last year (%) in Indonesia (2012) ... 31
Table 29: Health expenditure patterns among elderly and non-elderly households in Indonesia (2012) ... 32
Table 30: Health expenditure patterns among elderly households in Indonesia (2012) ... 32
Table 31: Labour statistics for Indonesia (2012) ... 33
Table 32: Labour statistics for men in Indonesia (2012) ... 34
Table 33: Labour statistics for women in Indonesia (2012) ... 34
Table 34: Pension coverage of elderly individuals in Indonesia - (IFLS 2007) ... 37
Table 36: Number of individuals by age group in PPLS 2011 ... 45
Table 37: Number of individuals with disability by age group in PPLS 2011 ... 46
Table 38: Number of individuals with chronic diseases by age group in PPLS 2011 ... 46
Table 39: Number of individuals with reported social assistance coverage by age group in PPLS 2011... 47
Table 40: Classification of pension programmes - international ... 51
Table 41: "Zero-Pillar schemes" ... 57
Table 42: Ex-ante simulation results on poverty effect of social pensions in Indonesia – perfect targeting (2012) ... 66
Table 43: Illustration of inclusion and exclusion error ... 68
Table 44: Simulation on the distribution of selected beneficiaries ... 68
Table 45: Ex-ante simulation results on poverty effect of social pensions – simulated targeting errors ... 70
Table 46: Government expenditures on selected social assistance programmes in Indonesia (2009 – 2012) ... 71
Table 47: Budget simulations for social pensions in Indonesia, benefit level 200,000 Rp per month (2012 – 2050) ... 72
Table 48: Budget simulations for social pensions in Indonesia, benefit level 300,000 Rp per month (2012 – 2050) ... 73
Table A1: Provincial poverty rates in Indonesia (March 2012) ... 89
Table A2: Laws, treaties and decrees related to old-age poverty ... 90
Table A3.1: Types of mandatory systems for retirement income (Asia) ... 91
Table A3.2: Types of mandatory systems for retirement income (Africa) ... 93
Table A3.3: Types of mandatory systems for retirement income (Latin America) ... 95
viii
List of Boxes
Acknowledgements
TNP2K’s mission is to coordinate poverty alleviation policies in Indonesia. As part of its tasks, TNP2K conducts and commissions research reports and studies with the objective of facilitating and informing evidence-based policy planning.
TNP2K has undertaken several research activities and policy initiatives related to old-age poverty in
Indonesia. This report, “Old-Age Poverty in Indonesia: Empirical Evidence and Policy Options - A Role
for Social Pensions”, presents Indonesia’s first poverty report specifically dedicated to the analysis of
old-age poverty. This report entails a detailed literature review, simulations and discussions on how Indonesia can make progress in achieving pension coverage of the elderly population by reviewing and discussing a variety of policy options related to social pensions.
The analysis and interpretation presented in this report are those of Jan Priebe and Fiona Howell from the Cluster 1 Policy Working Group of TNP2K, who are responsible for any errors and omissions. The authors would like to thank Isis Gaddis (World Bank), Suahasil Nazara (TNP2K), Elan Satriawan (TNP2K), Sudarno Sumarto (TNP2K), Jurist Tan (ex-Australian Aid), Stephan Klasen (University of Göttingen), and Mitchell Wiener (World Bank) for valuable input and comments. Editorial support was provided by Niall Sinclair, Maya Thatcher (TNP2K) and Megha Kapoor (PRSF).
The conclusions contained in this report do not necessarily represent the views of TNP2K, Australian Aid, the Government of Indonesia or Government of Australia.
x
Author Biographies
Fiona Howell is the Social Assistance Policy Advisor in TNP2K, Government of Indonesia. Her policy and program work involves the design and development of social protection interventions for poor and vulnerable families including conditional cash transfers, social pensions, cash transfers for education, food transfers, nutrition, microfinance, skills training and employment. She has worked in South-East Asia for more than 15 years on social security, health insurance, employment, vocational training, entrepreneurship and social assistance programs in Vietnam, Cambodia, Laos, Malaysia, Thailand and Timor Leste. She is currently studying for her PhD at the University of Liverpool, U.K.
Acronyms and Abbreviations
ADB Asian Development Bank
ASCC ASEAN Socio-Cultural Community ASEAN Association of Southeast Asian Nations
ASLUT Social Assistance for Elderly (Asistensi Sosial Lanjut Usia Terlantar) Australian Aid Australian Agency for International Development
BAPPENAS National Development Planning Agency (Badan Perencanaan dan Pembangunan Nasional)
BPS Central Bureau of Statistics (Biro Pusat Statistik)
BSM Cash Transfers for Poor Students (Bantuan Siswa Miskin) CBN Cost of Basic Needs
DJSN National Social Insurance Council (Dewan Jaminan Sosial Nasional) FF-DC Fully-Funded Defined-Contribution
GDP Gross Domestic Product
GIZ German Society for International Cooperation (Deutsche Gesellschaft für Internationale Zusammenarbeit)
ILO International Labour Organisation
JAMKESMAS National Health Insurance (Jaminan Kesehatan Masyarakat) MoF Ministry of Finance
MOSA Ministry of Social Affairs
MP3KI Master Plan for the Acceleration and Expansion of Poverty Reduction (Masterplan Percepatan dan Perluasan Pengurangan Kemiskinan Indonesia)
OECD Organisation for Economic Co-operation and Development
PAYG Pay-As-You-Go
PKH Conditional Cash Transfer Programme for Poor Families (Program Keluarga Harapan)
PMT Proxy Means Test
PPLS Data Collection of Social Protection Programmes (Pendataan Program Perlindungan Sosial)
PRSF Poverty Reduction Support Facility
Raskin Rice for the Poor (Beras untuk Orang Miskin)
SJSN National Social Security System in Indonesia (Sistem Jaminan Sosial Nasional) SKTM Letter of Poor Status (Surat Keterangan Tanda Miskin)
Susenas National Socioeconomic Survey
TNP2K National Team for the Acceleration of Poverty Reduction (Tim Nasional Percepatan Penanggulangan Kemiskinan)
xii
Executive Summary
Indonesia has made remarkable progress in reducing poverty levels over the last several decades. However, despite these achievements, poverty rates in many areas and among vulnerable groups remain alarmingly high.
On the need for social pensions in Indonesia
Indonesia in 2013 is an ageing society with an elderly population (60+) of approximately 20 million or eight percent of the total population. Due to continuously low fertility levels, lower mortality and higher life expectancy rates, the number of elderly in the country is predicted to increase to more than 80 million individuals by 2050 who will by then constitute about 25 percent of the total population. The increase in the number of elderly poses a variety of policy challenges for health care provision, labour markets, saving plans and pensions. Only a small share of the elderly population is presently covered by any sort of formal pension (about eight percent) which leaves a majority of the elderly uncovered. In 2006, Indonesia created its first direct social assistance cash-transfer benefit programme (ASLUT) that focuses exclusively on the elderly. By 2013 ASLUT was operational in all Indonesian provinces and intends to cover about 32,500 beneficiaries by 2014. While this programme is a step in the right direction, it covers only a fraction of poor elderly. Even when programme coverage is narrowed to only cover those poor elderly with significant health problems, millions of elderly remain without any coverage.
Considering the rise in its elderly population and the low pension coverage, the Indonesian government has shown strong commitment to raise the number of elderly gaining access to formal pensions. In line with a variety of social welfare laws, the National Security Law (SJSN), declarations under ASEAN and commitments to a comprehensive social protection floor policy, Indonesia has endorsed a multi-pillar approach to providing income support in old age. However, the current reforms associated with the SJSN Law are aimed at providing income support for the future elderly generation - those working age adults that will retire in 15-40 years. While the success of the SJSN reforms still needs to be demonstrated, there remains substantial scope for addressing the need for pension coverage among the current elderly population. The substantial under-coverage of the elderly population by either a formal pension or social-assistance benefit (ASLUT) needs to be benchmarked against the wider socio-economic and policy context. The elderly population is, together with very young children, the population group with high poverty rates in Indonesia or, according to some estimates, the population group with the highest poverty rates. However, while several large scale social assistance programmes have been designed to address the specific needs of children such as Cash Transfers for Poor Students (BSM) or Conditional Cash Transfer Program for Poor Families (PKH), there is no comparable programme for the elderly that matches these programmes in terms of beneficiary coverage and financial allocations. Therefore, it is timely to consider the role of social pensions in Indonesia.
and programme commitments to alleviate old age poverty and contrasts it with recent international experiences on pension reform. This report discusses in particular the benefits of social pensions for
Indonesia’s elderly, and outlines the pros and cons of poverty targeted and universal pension schemes.
Thirdly, the report provides ex-ante simulation results on the poverty and fiscal impacts for selected social pension schemes.
Main findings
Poverty among the elderly
One of the most vulnerable groups in the country is Indonesia’s elderly population. According to data from the March 2012 Susenas report, poverty among the elderly (60 years and older) amounts to 12.65 percent nationally compared to 11.95 percent of the non-elderly population. Poverty rates among the elderly tend to further increase with age (13.81 percent among elderly age 65 years and above; 14.92 percent among elderly age 70 years and above; and 15.42 percent among elderly age 75 years and above). The findings imply that currently about 2.5 million elderly (60 years and above) are considered to be poor in Indonesia. These figures increase further once elderly identified as vulnerable to poverty are included. If the official poverty lines from Central Bureau of Statistics (BPS) were increased by a factor of 1.2 (the near-poor poverty line), poverty rates among the elderly (60 years and above) would increase to 26.26 percent. Applying a factor of 1.5 times to the national poverty line increases this number to 41.93 percent, indicating that many more millions of elderly are vulnerable and are living just above the poverty line. In line with these findings, panel data from Susenas 2008, 2009 and 2010 show that in the age group of elderly 65-69 years old about 26 percent were categorised as poor at least once during the course of just two years, with four percent of all elderly having been poor in all three years (chronically poor).
Regional poverty differences
TNP2K research shows that very pronounced geographical differences exist in old-age poverty rates across provinces and between rural and urban areas. In line with the official rural and urban BPS poverty estimates, the research shows that old-age poverty rates, for example among the elderly aged 65 years and above, are much higher in rural (17.0 percent) than in urban areas (10.5 percent). However, both rural and urban old-age poverty rates are higher than those of the non-elderly population in these areas. An analysis of provincial poverty estimates shows that poverty rates among the elderly are not higher than those of the non-elderly population in all provinces. In several provinces, particularly in some provinces outside of Java, old-age poverty rates are lower than those of the non-elderly population. Cultural habits, earning possibilities, family structures and regionally specific migration patterns seem to be the main reasons behind these variations.
Gender differences in poverty rates and living arrangements
xiv significant difference are due to the increased life expectancy of women combined with elderly men tending on average to be married to younger women.
Socio-economic characteristics of the elderly
TNP2K research findings further illustrate that poverty among the elderly is related to many other factors, such as low education levels, poor health and high old-age labour participation rates.
Education
Indonesia has made remarkable progress in primary and secondary schooling over the last few decades. However, many are still illiterate among the current elderly generation. In the 65-69 age groups, about 28.5 percent are illiterate, with the rate increasing to more than 50 percent for those aged 75 years and older. Further significant differences exist along gender and regional lines. Women tend to show much higher illiteracy rates than elderly men. Likewise, illiteracy is much more pronounced in rural than urban areas.
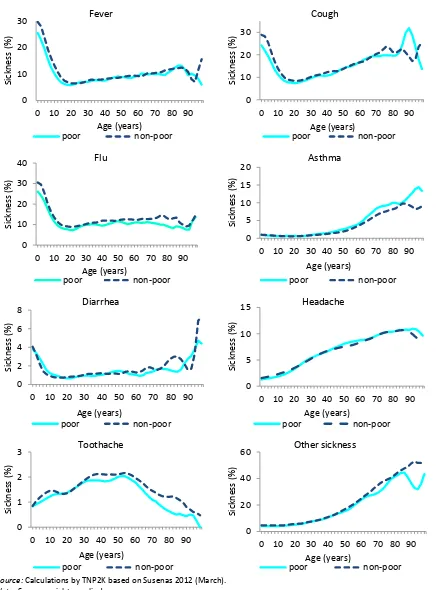
Health
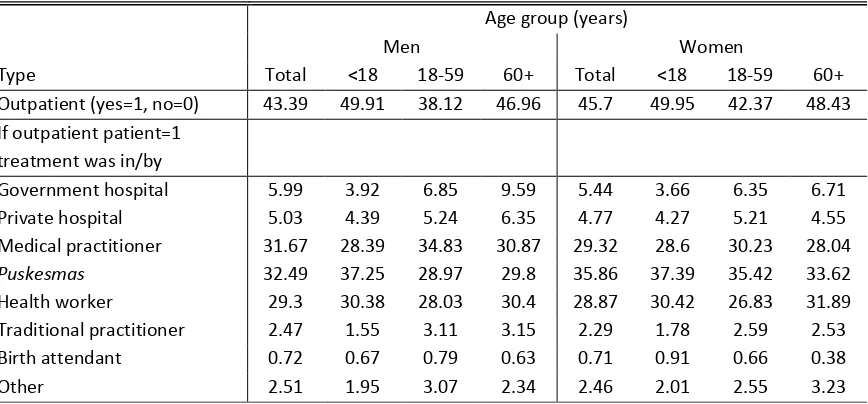
Elderly persons are significantly more likely to suffer from chronic health problems and disabilities. While it is common to expect deteriorating health conditions at older ages, the ability and capability of elderly households to obtain quality treatment for health problems depends significantly on wealth. The research presented, based on Susenas, shows that while poor and non-poor elderly are equally likely to suffer from health problems, the poor are less likely to seek treatment (inpatient and outpatient). Furthermore, when the elderly poor seek treatment they do so at lower cost facilities, such as public hospitals and puskesmas (local clinics), while the majority of better-off elderly prefer to receive treatment from private healthcare professionals.
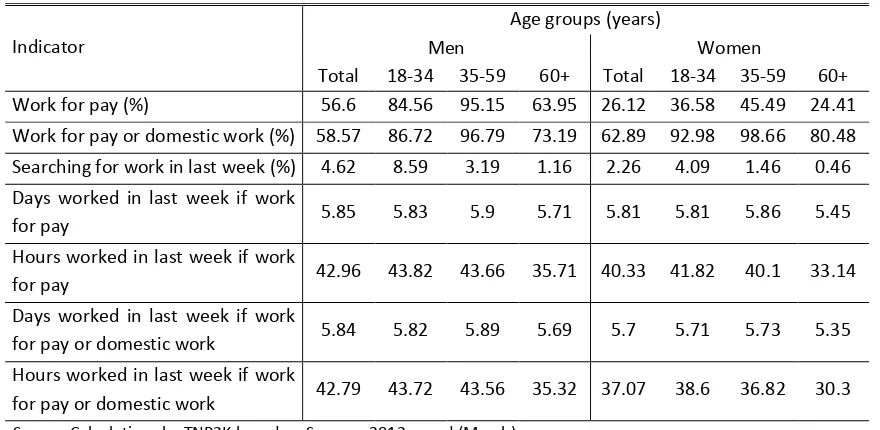
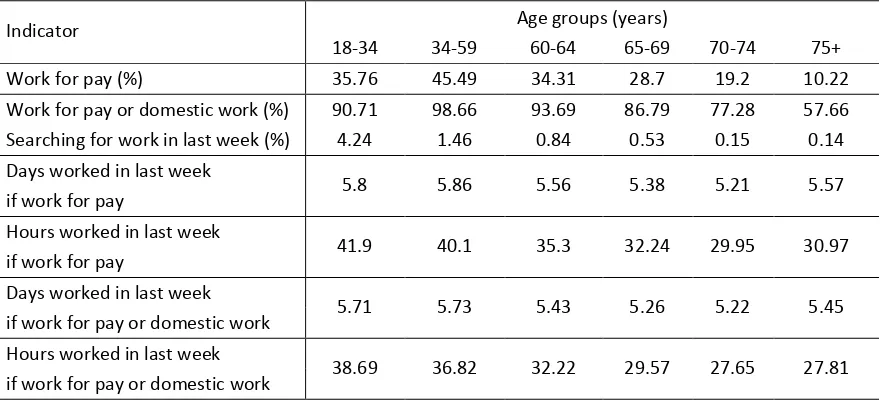
Employment
The majority of the elderly continue to work, although their labour force participation rates tend to decline at older ages. Significant gender differences exist in the types of work undertaken. While, for instance, about 69.0 percent of men in the 65-69 age group work for pay in the labour market, only 28.7 percent of women work for pay with the vast majority of women contributing through domestic and family work within the household. Analysis of Susenas data further shows that the poor elderly are somewhat more likely to work than non-poor elderly, underscoring the need for a substantial proportion of the elderly to continue working through old age to meet their basic needs.
Inter-household transfers
Data from the Indonesian Family Life Survey (IFLS 4) shows that private financial transfers (transfers from/to children, siblings, parents, persons outside the household) constitute a main source of income and insurance of households against consumption shortfalls and health risks, with the elderly more likely to benefit from and depend on such transfers.
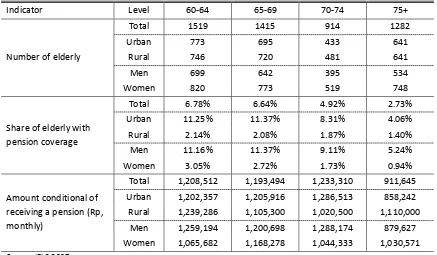
Pension coverage
benefits. In response to the high poverty rates among the elderly and their increased need to spend on health-related issues, combined with their diminishing work capacity, the Ministry of Social Affairs (Kemensos) created the ASLUT programme in 2006. ASLUT provides social assistance cash benefits to poor elderly who are considered neglected and without any means of self-support. In 2013, ASLUT aimed to cover about 27,000 elderly and expand this figure to 32,500 by 2014. While ASLUT is a step in the right direction to fighting old-age poverty, the coverage is far too small. Only 0.2 percent of all elderly and less than 1.5 percent of poor elderly in Indonesia are covered by this programme, compared to 2.5 million poor elderly (60 years and above),or the estimated 2.1 million elderly (60 years and above) living in the lowest decile of Indonesian households. Analysis of the Data Collection for Social Protection Programs (PPLS) 2011 reveals about 400,000 elderly persons with chronic health problems or disabilities among this bottom ten percent. ASLUT, therefore, has significant scope for extending its coverage.
Social pensions: poverty-targeted and universal pension scenarios
In order to tackle the problem of old-age poverty in the context of low pension coverage rates, many countries have introduced social pensions that complement formal sector pensions by providing income support to the elderly. While several different forms of social pensions exist, this report focuses its analysis on poverty-targeted and universal social pensions. More explicitly, this report simulates the potential effect on poverty rates among the elderly and the general population when social pensions are administered to the bottom five percent, ten percent, 15 percent or 20 percent of the population, versus a universal pension in which each all elderly would receive a pension benefit. Taking possible targeting errors into account, the analysis and simulations show that both poverty-targeted and universal pensions provide a meaningful way of fighting old-age poverty. For instance, assuming social pensions are provided to persons aged 70 years and older at a benefit level of Rp. 200,000 per month, old-age poverty rates would decrease to 11.94 percent (10.96 percent at a benefit level of Rp. 300,000 per month) from 14.57 percent if the poorest five percent were targeted, to 9.59 percent (8.29 percent) if the poorest ten percent were targeted, to 7.69 percent (6.28 percent) if the poorest 15 percent were targeted, to 6.37 percent (4.9 percent) if the poorest 20 percent were targeted, and to 3.51 percent (1.95 percent) if every elderly person aged 70 years or more received a social pension.
While social pensions in the universal scenario show the highest impact on poverty rates, they are associated with higher costs. Poverty-targeted social pensions perform better in terms of the poverty reduction/programme cost ratio. However, both poverty-targeted and universal social pension schemes are shown to be fiscally affordable scenarios as the current costs for all scenarios resulted in expenditures equivalent to less than one percent of Indonesia’s GDP.
Legal background and pension reform
The Indonesian constitution guarantees the fulfilment of basic needs for all people. The special needs of elderly people have been subsequently addressed in a variety of laws and decrees, including Law Number 4 of 1965 on the provision of assistance to disadvantaged older persons, Law Number 13 of 1998 on the welfare of older persons1, Law Number 40 of 2004 (Law on Sistem Jaminan Sosial
xvi Nasional, or SJSN), Law Number 11 of 2009 on social welfare and Law Number 24 of 2011 on social security providers.
Law Number 13 of 1998 led to the creation of the ASLUT programme in 2006, and Law Number 40 of 2004 created the National Social Security Council (DJSN), which spurred reforms for formal and informal sector pensions in Indonesia. In addition to national laws, the Social Protection Floor Strategy (2012) and the Master Plan for the Acceleration and Expansion of Poverty Reduction (MP3KI) (2013) envision the introduction of social pensions in Indonesia, with a particular focus on poor elderly. Furthermore, Indonesia has signed several ASEAN declarations over the last 15 years that aim at improving the welfare situation of the elderly (ASEAN Vision 2020, ASEAN Human Rights Declaration, ASEAN Charter, ASEAN Strategic Framework, and Plan of Action for Social Welfare).
Policy recommendations
Indonesia still lacks a significant pension programme that provides significant coverage for poor and vulnerable elderly. The number of elderly persons covered under ASLUT is very small (about 27,000 persons in 2013) while the SJSN pension reform will require at least 20 years to show significant increases in pension coverage rates. Current poor elderly are unlikely to be able to participate in the SJSN pension and old-age saving accounts. Therefore, for the short- and medium-term, the government should consider the policy options presented in this report in order to address poverty among the elderly.
The minimalist approach and least expensive option (Option 1) would be to ensure that ASLUT is covering at least its target population, namely the poor elderly who face severe health and mobility constraints and who are neglected. Under this option, national poverty rates of the elderly would remain high as only a small subset of the total elderly poor would be covered. However, implementing full coverage the current ASLUT programme would provide assistance for the poorest and most vulnerable elderly person.
1.
Demographic Trends
2 Indonesia has achieved remarkable progress in a variety of economic and social indicators over the last 50 years. Fertility has decreased from nearly six children per woman in 1961 to 2.1 in 2010, with Indonesian fertility levels currently being at the replacement level (Angeles et al., 2005; Hull, 1976, 1980, 1981, 2010; Hull and Tukiran, 1976; Hull and Davarna, 1988; Nam et. al, 1991). According to the World Development Indicators (2012) during the same time period, infant and under-five mortality rates dropped sharply from 125 per thousand live births to 25 (infant mortality), and from 211 per inthousand live births to 31.8 (under-five mortality). With improvements in general living conditions over the last 50 years in Indonesia, life expectancy for both women and men increased rapidly with both sexes having gained more than 20 years in additional life expectancy over the period.
Table 1: Historical development trends in Indonesia (1961-2010)
Indicator 1961 1970 1980 1990 2000 2010
Overall population (millions) 94.2 118.0 151.0 184.0 213.0 240.0
Fertility rate 5.7 5.5 4.4 3.1 2.5 2.1
Infant mortality rate (per 1,000 live births) 125 99.5 75.7 54.1 37.6 24.8 Under-five mortality rate (per 1,000 live births) 211 164 120 81.6 52.5 31.8 Male life expectancy at birth (years) 47.1 50.3 56 60.5 64.1 67.3 Female life expectancy at birth (years) 44.6 53.5 59.3 63.8 67.3 70.6 GDP/capita (in 2005-US$-PPP) - - 1,320 2,010 2,620 4,090
Source: World Development Indicators 2012
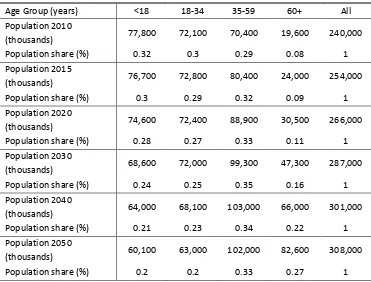
Table 2: Overall population trends in Indonesia (2010-2050)
Age Group (years) <18 18-34 35-59 60+ All Population 2010
(thousands) 77,800 72,100 70,400 19,600 240,000 Population share (%) 0.32 0.3 0.29 0.08 1 Population 2015
(thousands) 76,700 72,800 80,400 24,000 254,000 Population share (%) 0.3 0.29 0.32 0.09 1 Population 2020
(thousands) 74,600 72,400 88,900 30,500 266,000 Population share (%) 0.28 0.27 0.33 0.11 1 Population 2030
(thousands) 68,600 72,000 99,300 47,300 287,000 Population share (%) 0.24 0.25 0.35 0.16 1 Population 2040
(thousands) 64,000 68,100 103,000 66,000 301,000 Population share (%) 0.21 0.23 0.34 0.22 1 Population 2050
(thousands) 60,100 63,000 102,000 82,600 308,000 Population share (%) 0.2 0.2 0.33 0.27 1
Source: World Bank 2012 population projections (mimeo).
The decline in fertility and mortality rates together with an increase in life expectancies of Indonesians has led to significant changes to Indonesia’s demographic structure, with the country having entered a period of decreasing dependency ratios due to lower fertility rates and a healthier adult population. Economists and demographers tend to speak of a period of the “demographic gift/dividend” in which the working age population, i.e. individuals aged 18 to 60, represents a very large share of the overall population with sufficient income generated by this group to support children and the elderly. While Indonesia has benefitted for several years from a demographic structure that helped to foster economic growth, the country is becoming, like many Western countries, an aging society in which elderly people represent an ever increasing share of the total population. This demographic trend is mainly the result of Indonesia’s continuing success of limiting population growth and improving overall living conditions that lead to higher life expectancies. However, it also presents a variety of new challenges and the need to look specifically at the situation of the elderly.
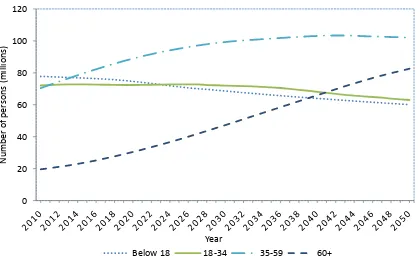
Table 2 and Figure 1 present population projections, based on the 2010 population census. Table 2 shows that people aged 60 years or more already constituted a large share of the population (eight percent) in 2010. However, this share of elderly individuals is predicted to increase significantly, up to 33 percent in 2050, with the absolute number of elderly expected to grow rapidly from 19.6 million people in 2010 to more than 80 million by 2050.
Figure 1: Demographic trends in Indonesia, population projections (2010 – 2050)
Source: World Bank 2012 population predictions (mimeo).
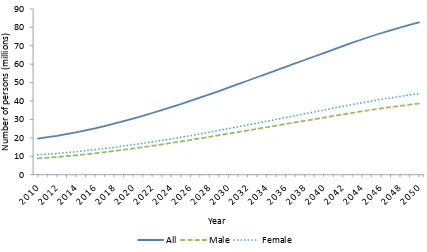
As Indonesia becomes an aging society, it is important to note that among the elderly population there are now and will be in the future, far more women than men. This phenomenon is often referred to by demographers as the “feminisation of aging”. Due to biological differences, but also differences in risky lifestyle behaviours, such as smoking, driving, and hazardous working conditions of men, women in most countries tend to have a higher life expectancy than men. Table 3 and Figure 2 show the respective population numbers disaggregated by gender.
4 Table 3: Population projections for Indonesia by gender (2010 – 2050)
Sex
<18 39,600,000 39,000,000 38,000,000 34,900,000 32,500,000 30,500,000
18-34 36,100,000 36,700,000 36,700,000 36,600,000 34,600,000 31,900,000
35-59 35,100,000 40,000,000 44,100,000 49,500,000 51,800,000 51,500,000 60+ 8,825,588 11,000,000 14,200,000 22,300,000 31,000,000 38,600,000
All 120,000,000 127,000,000 133,000,000 143,000,000 150,000,000 153,000,000
Women
<18 38,200,000 37,600,000 36,700,000 33,800,000 31,500,000 29,500,000
18-34 36,000,000 36,100,000 35,700,000 35,400,000 33,600,000 31,000,000
35-59 35,300,000 40,500,000 44,800,000 49,800,000 51,300,000 50,400,000
60+ 10,800,000 13,000,000 16,300,000 25,000,000 35,100,000 43,900,000
All 120,000,000 127,000,000 133,000,000 144,000,000 151,000,000 155,000,000
Source: World Bank 2012 population projections (mimeo).
Figure 2: Demographic trends in Indonesia, population projections for elderly 60+
(2010-2050)
Source: World Bank 2012 population predictions (mimeo).
In addition to increasing the absolute number of elderly and their share in the population overall, it is worth noting that Indonesians life expectancy across all age cohorts, and for both men and women, is predicted to further improve (Table 4, Figure 3).The improving life expectancy rates are also highly relevant to policies for old-age social assistance. The life expectancy of individuals at age 60 (65) will continuously increase from 17.9 years currently to 22.7 years by 2050 (14.5 years currently to 18.7 years by 2050). This development has repercussions for policy decisions related to work in old age, retirement ages, savings, intra-household transfers, household structures and the government’s design of social protection/assistance measures that focus on the elderly.
Table 4: Life expectancy projections for Indonesia in years, by gender (2010 – 2050)
Source: World Bank 2012 population projections (mimeo).
Figure 3: Predicted life expectancy in Indonesia, population projections (2010 – 2050)
Source: World Bank 2012 population projections.
The tables and figure presented above show the most important demographic trends in Indonesia at
the national level. Given Indonesia’s regional diversity, demographic trends and the extent of aging
within local communities might be very different from village to village, from kecamatan to kecamatan, kabupaten to kabupaten or from province to province. In particular, (internal) migration in Indonesia (Ananta and Arifin 2009) is a factor, in addition to fertility and mortality patterns, that together determine whether a certain community or region has a higher share of elderly in its population. Regions with low fertility rates and high outmigration rates, such as some areas in Eastern Java, already have communities in which the share of elderly is above 20 percent of the local population (Kreager and Schröder-Butterfill, 2005; Rammohan and Magnani, 2012). In general, the strong migration patterns of working-age populations from rural to urban areas, especially to the main cities in Indonesia, has led to some communities having a larger share of elderly, and to various forms of complex family arrangements related to household composition and transfers/remittances.
70 71 73 75
6
2.
Poverty and the
elderly
National statistical agencies and the World Bank’s poverty assessments usually do not disaggregate their poverty statistics by age groups - the only exception being child poverty rates. Therefore, very little is in fact known about the poverty situation of the elderly both at the national and international level.
For developed countries, Whitehouse (2000) and Bloom et al. (2011) state that in countries that make up the Organisation for Economic Co-operation and Development (OECD), older people were significantly poorer than non-elderly during the 1960s/1970s, while nowadays older people tend to be better-off than the non-elderly. This relative welfare improvement of older people is explained by the fact that the current generation of elderly are able to benefit for the first time from long and significant contributions into private or public social security systems. Similarly, among Eastern European and Central Asian countries that transitioned from socialist economies, older people were able to rely on built-up assets and generous pensions, and, therefore, were typically better off than other population groups.
8
Empirical evidence on old-age poverty in Indonesia
Besides a few small-scale qualitative studies with very limited regional coverage (Rudkin, 1993; Kreager and Schröder-Butterfill, 2005, 2008), there is no recent quantitative evidence on the poverty situation of older persons in Indonesia. Neither the Central Statistical Office (BPS) nor the World Bank in its reports (WB, 2006, 2012a, 2012b) provides poverty statistics specifically for the elderly or poverty data disaggregated by age groups. This report tries to overcome this knowledge gap by providing poverty estimates for the elderly, for the period 2005-2012. It further analyses the robustness of the poverty profile of the elderly according to different specifications and methodologies and puts the poverty situation in perspective with other socio-economic characteristics of the elderly. By doing so, this report offers Indonesia’s first poverty assessment that focuses on the welfare of the elderly.
Measurement of poverty
This report follows the official procedure of BPS to measure poverty. Under this methodology, a person is classified as poor if his/her consumption expenditure is below the poverty line. A person’s consumption expenditures are calculated by summing-up all household expenditures and dividing this figure by the number of persons living in the household (per-capita expenditure measure). This study uses the consumption aggregate provided by BPS in its annual Susenas rounds (March rounds) and the official poverty lines that differ by province and rural/urban areas, in order to allow for variability in prices and food availability/preferences across regions. The final poverty estimates refer to individuals and not households, in line with BPS practices. By following BPS data and procedures, TNP2K reproduced the published BPS poverty estimates for the general population for 2008-2012, with very small differences to the 2005-2007 official statistics (less than 1 percentage point).
Table 5 and Figure 2 present poverty statistics for different age groups and their respective shares in the overall population. From Table 5, it can be clearly established that old-age poverty rates across all age groups are higher than those of the rest of the population. This observation holds true for the entire period (2005-2012) and is particularly pronounced the older people get. For instance, persons age 702 or above experience at least three percentage points higher poverty rates than the overall population3. In contrast to findings from developed countries, as stated above (Whitehouse, 2010; Bloom et al. 2011), there has been no relative progress in old-age poverty rates. For the eight year period under consideration, the situation of the elderly has not improved more than that of the general population.
Table 5: Poverty rates for persons aged 60 and above, in Indonesia (2005 – 2012)
Year Poverty Rates (%) Population Share
Total 60+ 65+ 70+ 75+ 60+ 65+ 70+ 75+
2005 16.51 17.69 18.97 19.72 20.63 8.02 5.12 3.13 1.48 2006 17.68 17.88 19.13 19.55 20.75 8.67 5.75 3.47 1.70 2007 16.19 16.55 17.80 18.52 19.10 8.78 5.91 3.66 1.92 2008 15.42 16.82 18.01 19.04 20.78 8.33 5.61 3.42 1.77 2009 14.15 15.16 16.16 17.01 18.13 8.81 5.86 3.62 1.89 2010 13.33 14.18 15.17 15.83 16.56 9.20 6.12 3.76 1.94 2011 12.49 13.84 15.27 16.52 17.91 7.58 5.03 3.06 1.61 2012 11.96 12.65 13.81 14.92 15.42 7.56 5.02 3.05 1.61
Source: Calculations by TNP2K based on annual Susenas rounds (March).
Note: Official BPS poverty lines (rural/urban province level) applied. Poverty rates refer to individuals. Survey weights applied.
Figure 4: Poverty rates in Indonesia, annual Susenas rounds (March) (2005 – 2012)
Source: Calculations by TNP2K based on annual Susenas rounds (March).
In addition to looking at BPS’s official classification of poverty it is also interesting to look at the near-poor or those vulnerable to poverty. According to BPS, these are individuals who live below 1.2 times the official poverty line. Table 6 and Figure 5 depict poverty figures once the poverty line is adjusted for 1.2 times, as well as for 1.5 and 2 times the official poverty line. The results suggest that a very large part of the elderly population can be classified as vulnerable to poverty, just living above the official poverty line. Data from 2012 shows more than a quarter of the elderly population above 65 or 70 years can be classified as vulnerable to poverty. Taking into account that about five percent (three percent) of the Indonesian population is at least 65 (70) years old, this implies that with a population of about 240 million in 2012 about three million (two million) elderly people live in poverty or are acutely vulnerable to poverty.
10 13 16 19 22
2 0 0 5 2 0 0 6 2 0 0 7 2 0 0 8 2 0 0 9 2 0 1 0 2 0 1 1 2 0 1 2
Po
ve
rty
ra
te (%
)
Year
10 Table 6: Poverty rates in Indonesia, different poverty lines (2005 – 2012)
Poverty rates (%) for elderly 65+ Poverty rates (%) for elderly 70+ Poverty line multiplied by: Poverty line multiplied by:
Year 1 1.2 1.5 2 1 1.2 1.5 2
Source: Calculations by TNP2K based on annual Susenas rounds (March).
Note: Official BPS poverty lines (rural/urban province level) applied. Poverty rates refer to individuals. Survey weights applied.
Figure 5: Poverty rates in Indonesia (vulnerability), annual Susenas rounds (March) (2005 – 2012)
Source: Calculations by TNP2K based on annual Susenas rounds (March).
Note: Official BPS poverty lines (rural/urban province level) applied. Poverty rates refer to individuals. Survey weights applied.
An alternative way of defining vulnerability to poverty among individuals and households lies in tracking individuals/households over time. The Susenas March rounds for 2008, 2009 and 2010 allow researchers to follow a cohort of households (a subset of the data) over this three-year period4. The panel structure can be exploited to analyse poverty dynamics. To analyse chronic and transient poverty rates, a person is classified as “chronic poor” if they have been poor in all three Susenas
4 The same Susenas panel data structure was exploited in WB (2012a), with similar rates derived for the overall population.
10
rounds, while an individual is defined as “transient poor” if they were poor in at least one of the three rounds but not in all three rounds. Together, the transient and chronic poverty rates provide an alternative measure of the rate of individuals who are vulnerable to poverty.
Table 7: Chronic vs. transient poverty rates among the elderly (2008-2010)
Age Poverty in 2008 (%) All (%) Men (%) Women (%) (years) weighted unweighted chronic transient chronic transient chronic transient
All 16.09 16.43 4.77 22.98 4.59 22.63 5.00 23.44
Source: Calculations by TNP2K based on Susenas March 2008, March 2009, March 2010 panel components.
Note: The term ‘weighted’ refers to the use of the individual weights from Susenas, while ‘unweighted’ refers to calculations in which no weights were used at all. Chronically poor is defined as being poor in all three rounds. Transient poor is defined as being poor at least once but not being chronically poor.
Table 7 shows the results for individuals who could be tracked through all three rounds5. While the official BPS 2008 poverty figure was slightly below 16 percent, the figure obtained here is only marginally higher and remains comparable. Across all age groups, children and the elderly are found in the age groups with the highest poverty rates (columns 1 and 2). Chronic and transient poverty rates for the overall sample (columns 3 and 4) show that, for instance, about 30 percent of the elderly aged between 65-69 years have been poor between 2008 and 2010 at least once, with about four percent of all elderly in this age cohort being poor during all three time periods. As shown above, poverty rates in this age group (65-69 age cohorts) were about 18 percent. The four percent of chronic poor in this age group, therefore, suggests that about 20 percent to 25 percent of all elderly poor are chronic poor. Consistent with previous findings, old-age poverty rates both in chronic and transient poverty rates seem to increase with age. Among elderly persons aged 75 years and older, more than one-third have been poor at least once between 2008 and 2010.
Old-age poverty rates do not differ solely by age group, but also by several other characteristics such as gender and location. With respect to differences between elderly men and women, Table 8 and Figure 6 show old-age poverty rates disaggregated by gender. The first thing to note is that the poverty rates for both elderly men and women are higher than those of the general population over the entire period. Secondly, old-age poverty rates for women in the 60+ and 65+ age groups seem to be slightly higher than those for men, while in the age groups 70+ and 75+ the gender differences seem to level out. One possible explanation for these variations could be age differences in marriage patterns where older men (e.g. 70+ or 75+) are married to relatively younger women (60+ or 65+), in which case the same elderly couple/household has the same poverty rate.
12 Table 8: Poverty rates for the Elderly in Indonesia, by gender (2005 – 2012)
Poverty rates (%)
Men Men Men Men Women Women Women Women Year Total 60+ 65+ 70+ 75+ 60+ 65+ 70+ 75+
2005 16.51 17.37 19.51 20.77 20.45 17.98 18.51 18.76 20.78 2006 17.68 17.26 18.71 20.32 21.79 18.43 19.50 18.85 19.88 2007 16.19 15.97 17.54 18.96 19.58 17.06 18.02 18.16 18.72 2008 15.42 15.80 16.95 18.23 19.93 17.71 18.90 19.70 21.48 2009 14.15 14.35 15.18 16.90 18.4 15.87 17.01 17.10 17.91 2010 13.33 13.60 14.90 16.58 17.86 14.69 15.40 15.21 15.51 2011 12.49 13.64 14.81 15.89 18.81 14.00 15.64 17.00 17.26 2012 11.96 12.46 13.76 15.23 15.92 12.81 13.84 14.69 15.06
Source: Calculations by TNP2K based on annual Susenas rounds (March).
Note: Official BPS poverty lines (rural/urban province level) applied. Poverty rates refer to individuals. Survey weights applied.
Figure 6: Poverty rates for the Elderly in Indonesia, by gender, annual Susenas rounds (March) (2005 – 2012)
Source: Calculations by TNP2K based on annual Susenas rounds (March).
Note: Official BPS poverty lines (rural/urban province level) applied. Poverty rates refer to individuals. Survey weights applied.
Table 9 shows poverty rates for the non-elderly population disaggregated by gender while the first column repeats the poverty rate for the total population. Comparisons of Table 8 and Table 9 reveals that poverty rates among the non-elderly population across both genders are lower than those of the respective elderly age groups. The disparity increases markedly with higher age cut-offs. In general, the poverty rates of the non-elderly are relatively close to the total population poverty rates, which is in line with the non-elderly comprising of a larger share in the overall population.
10 15 20 25
2 0 0 5 2 0 0 6 2 0 0 7 2 0 0 8 2 0 0 9 2 0 1 0 2 0 1 1 2 0 1 2
Po
ve
rty
ra
te (%
)
Year
All Elderly 65+ (male)
Table 9: Poverty rates among the non-elderly in Indonesia (2005 – 2012)
Source: Calculations by TNP2K based on annual Susenas rounds (March).
Note: Official BPS poverty lines (rural/urban province level) applied. Poverty rates refer to individuals. Survey weights applied.
While gender differences in old-age poverty rates are relatively small or non- existent, poverty rates by rural and urban location and across provinces differ significantly. Several academic papers on Indonesia have documented rural-urban and provincial differences in poverty: Akita and Lukman, 1995; Akita and Alisjahbana, 2002; Asra, 1999; Bidani and Ravallion, 1993; Booth, 1993, 2000; Islam and Khan, 1986; Ravallion and van de Walle, 1991; Ravallion and Lokshin, 2007. As is widely documented in BPS’s annual reports, “Data dan Informasi Kemiskinan”, rural poverty rates are consistently higher than urban poverty rates even when taking price differentials in living costs between rural and urban areas into account (rural poverty lines are always lower than urban poverty lines for the same province).
Figure 7: Poverty rates in Indonesia (urban/rural), annual Susenas rounds (March) (2005 – 2012)
Source: Calculations by TNP2K based on annual Susenas rounds (March).
Note: Official BPS poverty lines (rural/urban province level) applied. Poverty rates refer to individuals. Survey weights applied.
14 Table 10 and Figure 7 show the 2005-2012 poverty rates disaggregated by age group and rural-urban location. Urban poverty rates across all years are clearly below rural poverty rates by about seven to eight percentage points for the overall population. In both rural and urban areas, poverty rates of the elderly are higher than those of the overall population. Interestingly, the difference is particularly pronounced for urban areas, in which old-age poverty rates are about three percentage points higher than those of the overall population.
Table 10: Rural-Urban poverty rates in Indonesia (2005 – 2012)
Poverty rates (%)
Total Elderly 65+ Elderly 70+ Year Total Urban Rural Urban Rural Urban Rural
2005 16.51 12.43 20.00 15.96 20.95 15.86 22.16 2006 17.68 12.77 22.40 14.7 22.27 16.51 21.72 2007 16.19 10.85 20.08 12.81 20.52 13.46 21.17
2008 15.42 11.65 18.95 14.27 20.69 16.26 20.94 2009 14.15 10.73 17.35 14.13 17.68 15.34 18.21 2010 13.33 9.87 16.56 12.03 17.59 13.01 17.91 2011 12.49 9.23 15.71 13.21 17.27 14.82 18.15 2012 11.96 8.78 15.12 10.50 17.00 11.85 17.84
Source: Calculations by TNP2K based on annual Susenas rounds (March).
Note: Official BPS poverty lines (rural/urban province level) applied. Poverty rates refer to individuals. Survey weights applied.
As stated above, poverty rates do not only differ by rural and urban status but also by province. Table A1 (in the appendix) and Figure 8 present poverty rates by province and age group for the 2012 Susenas March round. The results first confirm that there are strong regional variations in poverty rates in the overall population, with poverty in Jakarta being relatively low at 3.7 percent and poverty in places like Papua being as high as 30 percent. The most important result from Table A1 and Figure 8 is that old-age poverty rates are not higher than those of the overall population in every province. It is difficult to find a general spatial pattern, but old-age poverty rates are much higher than those of the general population in Java, while on the other islands no clear picture emerges with old-age poverty being substantially lower in some places, like Papua Barat or Aceh provinces. In line with these findings of strong regional differences in the comparison of old-age poverty rates vs. poverty rates in the overall population, Table A1 also shows that no clear age-poverty gradient emerges among the elderly age groups (60+, 65+, 70+, 75+) across the different provinces. In Javanese provinces, poverty is particularly pronounced among the very old, however, this pattern does not hold for a variety of other provinces.
Figure 8: Provincial poverty rates (%) in Indonesia (2012)
Source: Annual Susenas rounds 2012 (March).
Note: Official BPS poverty lines (rural/urban province level) applied. Poverty rates refer to individuals. Survey weights applied.
0 5 10 15 20 25 30 35
Papua Papua Barat Maluku Utara Maluku Sulawesi Barat Gorontalo Sulawesi Tenggara Sulawesi Selatan Sulawesi Tengah Sulawesi Utara Kalimantan Timur Kalimantan Selatan Kalimantan Tengah Kalimantan Barat Nusa Tenggara Timur Nusa Tenggara Barat Bali Banten Jawa Timur DI Yogyakarta Jawa Tengah Jawa Barat DKI Jakarta Kepulauan Riau Kepulauan Bangka Belitung Lampung Bengkulu Sumatera Selatan Jambi Riau Sumatera Barat Sumatera Utara Aceh
16
Demographic aspects and poverty of the elderly
Poverty and household living arrangements
In order to better understand old-age poverty in Indonesia, it is important to shed more light on the living arrangements of the elderly. Understanding the role of living arrangements is relevant as they affect the measurement of poverty, and they also help to learn more about the causes of poverty, and thereby contribute to the design of appropriate policies and programs.
This section starts with analysing marriage patterns among the elderly. It is most common among Indonesian adults, and especially among the generation of elderly that are the focus of this research, that most people have been married at one point in time. Table 11 confirms this basic assumption, showing that only about one percent of elderly men and women were not married at one point in time.
Table 11: Marital status in Indonesia in 2012 by age and gender
Men Women
Status 60-64 65-69 70-74 75+ 60-64 65-69 70-74 75+
No. of individuals (thousands) 2,995 2,273 1,563 1,639 3,200 2,518 1,963 2,274
Unmarried (%) (1=yes, 0=no) 0.83 0.57 0.57 0.93 1.18 1.33 1.00 1.00
Married (%) (1=yes, 0=no) 89.22 85.55 80.21 71.31 54.59 42.91 27.27 16.19
Divorced (%) (1=yes, 0=no) 1.27 1.51 0.97 0.97 3.47 3.27 2.89 2.21 Widowed (%) (1=yes, 0=no) 8.67 12.37 18.26 26.79 40.76 52.48 68.83 80.60
Source: Calculations by TNP2K based on Susenas 2012 round (March).
Note: Survey weights applied.
Moreover, Table 11 shows that the share of individuals who are widows/widowers increases with age, for both men and women. Table 11 further shows that there are very strong gender differences in the share of elderly that are married or widowed. While the majority of elderly men are still married at age 75 or above (71.31 percent), this does not hold true for women. Women from age 65 onwards are significantly more likely to be widowed than to be married. At age 75 or older, only 16.19 percent of women are still married. Several reasons for these strong gender differences exist. Qualitative studies (e.g. Kreager and Schröder-Butterfill, 2008) have pointed out that in some ethnic groups in Indonesia only men are allowed to re-marry in the case of death of their spouse, while women are not. However, the larger reasons for gender differences in the marriage status of elderly are likely to be caused by (a) women having higher life expectancies than men; (b) fewer men available for re-marriage than women, and (c) age differences between men and women in re-marriages, with men tending to be older than women.
official BPS poverty rates for all individuals, as replicated by TNP2K, are 11.96 percent - the poverty rate for all households is 9.36 percent. This result is very intuitive since poorer households tend to consist of more household members.
Table 12: Poverty rates in Indonesia in 2012 by living arrangements
Category
Share of
households (%) Poverty rate (%)
Individuals 11.96
Households 9.36
Elderly households 100.00 13.22
Single elderly households 3.81 4.22
Single elderly male households 0.80 1.21
Single elderly female households 3.02 5.01
Two elderly person household (husband + spouse) 7.89 10.25
Nuclear elderly household 15.69 9.71
Nuclear elderly household with male elderly 12.21 10.67 Nuclear elderly household with female elderly 5.73 8.81
Extended elderly household 72.67 17.47
Extended elderly household with male elderly 32.90 19.07 Extended elderly household with female elderly 50.99 17.40
Source: Calculations by TNP2K based on Susenas 2012 round (March).
Note: Official BPS poverty lines (rural/urban province level) applied. Survey weights applied. Elderly household is defined as including at least one person with age 65 or older. Nuclear household is defined as household in which elderly person lives only with his child or step-child. Extended family refers to all remaining household arrangements.
Elderly households, here defined as a household with at least one elderly person aged 65 or older, tend to have substantially higher poverty rates (13.22 percent) than found in the overall population (9.36 percent). However, poverty rates for elderly living arrangements differ considerably. Poverty rates among single elderly households (4.22 percent) seem to be much lower compared to other elderly living arrangements, and also compared to the overall poverty figure of 9.36 percent. However, one needs to note that only a small fraction of all elderly (<4 percent) actually live in single person households. The general finding lends weight to the hypothesis that the elderly want to sustain their own household as long as their financial means are sufficient, and only merge into households with their children or other relatives once these means are exhausted. However, household formation processes are very complex in general and are determined by a variety of factors. Moreover, as stated previously, substantial regional differences are also likely to exist. For instance, east Javanese elderly tend to prefer to sustain their own household, while in some Sumatran communities the traditional pattern of elderly forming a multi-generational household seems to be desired by most elderly (Kreager and Schröder-Butterfill, 2008).
18 a minority of children live with an elderly person. Even when looking at poor children, only 14 percent live with an elderly person aged 60 years or older, and only about three to four percent of poor children live with an elderly person aged 75 or older. While in poorer households the likelihood to find an elderly person and a child living together increases, it becomes clear that policies that focus only on addressing the needs of children and young families leave a substantial share of poor elderly without any benefit from such policies. On the other hand, policies targeted towards elderly persons, particularly poor elderly persons, have the advantage that children are relatively likely to benefit.
Table 13: Living arrangements elderly-children in Indonesia (2012)
Share of elderly (%) living with children Share of children (%) living with elderly
Category 60+ 65+ 70+ 75+ 60+ 65+ 70+ 75+
All 47.73 46.27 45.45 44.91 14.62 10.00 6.35 3.44 Men 48.11 44.42 42.93 41.08 14.65 9.81 6.14 3.28 Poor men 69.84 66.01 62.97 56.55 19.74 14.67 9.41 5.15 Non-poor men 45.10 41.13 39.40 38.24 13.76 8.97 5.57 2.95 Women 47.40 47.78 47.35 47.67 14.59 10.20 6.58 3.62 Poor women 67.21 65.32 62.03 60.37 20.35 14.52 10.21 5.70 Non-poor women 44.57 45.00 44.92 45.49 13.64 9.48 5.98 3.28
Source: Calculations by TNP2K based on Susenas 2012 round (March).
Note: Official BPS poverty lines (rural/urban province level) applied. Poverty rates refer to individuals. Survey weights applied. Child defined as persons below the age of 18.
Robustness of old-age poverty rates
Official poverty rates around the world are usually calculated by using income or (consumption) expenditures as a measure of welfare, with Latin American countries using income and African and Asian countries using (consumption) expenditures. To determine the national poverty line, most countries in the world use an absolute poverty line and determine this line by the so called cost of basic needs (CBN) approach that has been advocated by the World Bank since the 1990s (Ravallion, 1998). The most prominent exceptions are some countries in the European Union with a relative poverty line, or Bhutan with a happiness measure. Indonesia uses a CBN approach together with per-capita consumption expenditures as measures of welfare. The choice of a per-per-capita measure is not uncontroversial and countries like Argentina, Brazil, and the US and many African countries have chosen to diverge from this practice. The problem with a per-capita measure lies in dividing a
household’s consumption expenditures by the number of household members. By doing this, BPS
assumes that:
a) Children are as needy as adults, and younger adults are as needy as elderly adults; and b) All households have needs in proportion to the number of household members (Deaton and
Paxson, 1995, 1998a).
While national statistical offices and academic studies differ on whether to apply different weights to, for instance, children vs. adults or small vs. large households, it is commonly agreed to test the robustness of poverty estimates against these different assumptions.
The formal representation of this testing is depicted in equation 1, in which the effective expenditure level of an individual i (
E
i,eff) is obtained by dividing nominal household expenditures (Eh) by theeffective household size. The effective household size is the sum of the number of adults (na) and children (nc) in a household whereby children receive a weight (wc) between 0 and 1, depending on their needs compared to adults (adult equivalence scale). The parameter θ represents the assumption made about the role of public goods in household expenditures (economies of scale) and lies between 0 and 1, with 1 indicating that no economies of scale or benefits from public goods items are expected.
𝐸𝑖,𝑒𝑓𝑓 =(𝑛𝑎+𝑤𝐸ℎ𝑐∗𝑛𝑐)𝜃
(1)
In order to better understand the role of adult equivalence scales and economies of scale on the measurement of poverty, we follow the specifications in which either only adult equivalence scales or only economies of scales are applied, but not both at the same time (Deaton and Paxton, 1995, 1998a; Dreze and Srinivasan, 1997; Lanjouw et al., 2004). For the adult equivalence scale, we use scenarios in which children needs are assumed to be (wc) 80 percent or 50 percent less than the needs of adults, with children being defined as individuals below the age of 18. For the economies of scale, we chose
values for θ of 0.9 – 0.2, with values of 0.8-0.9 being most discussed as relevant for developing
countries6.
The effect of applying either adult equivalence scales or economies of scale on old-age poverty rates is not a-priori clear. As Table 10 shows, a large share of elderly live in larger households and in households with children. Therefore, the effect of applying the different scales depends on how elderly living arrangements are compared to an average household type (Deaton and Paxson, 1998a). Applying different scales for poverty measures provides policy makers with two main insights: - How sensitive are old-age poverty rates to assumptions about needs and household sizes? - What is the relative share of the elderly among the poor, especially when compared to children?
Adult equivalence scales
Table 14 shows results using different assumptions about the relative weights of children. The baseline BPS scenario is repeated with wc=1. Assuming that children are moderately less needy than adults (0.8), the results show that old-age poverty rates will be much higher than usually conferred by BPS statistics. Assuming that children have a weight of half an adult (0.5) old-age poverty rates increase even further.
20 Table 14: Poverty rates and adult equivalence scales in Indonesia in 2012
Category
Poverty rate (%)
wc: 1 wc: 0.8 wc: 0.5
Total 11.96 12.29 12.01
Elderly 60+ 12.35 15.20 19.13
Elderly 65+ 13.48 16.62 20.90
Elderly 70+ 14.57 18.23 22.75
Elderly 75+ 15.01 18.77 23.72
Note: Calculations by TNP2K based on Susenas 2012 (March). Official BPS poverty lines (rural/urban province level) applied. Poverty rates refer to individuals. Survey weights applied. Children are defined as individuals below age 18.
Figure 9 further illustrates the relative share of the elderly among all age groups. The official BPS procedure (dashed blue line) shows a clear age-poverty relationship with children being the poorest age group followed by the elderly. Using moderate assumptions (dashed green line) about the relative needs of children with respect to adults already changes this picture with the elderly becoming the relatively poorest population sub-group in Indonesia. Assuming that children have about half the expenditure needs of adults (solid blue line) further increases this conclusion.
Figure 9: Poverty rates and age in Indonesia, adult equivalence scales (2012)
Source: Susenas 2012 round (March)
Economies of scale
The results of making changes to assumptions on the role of public goods and household consumption expenditures (economies of scale), but giving children an equal weight compared to adults are depicted in Table 15.
5 10 15 20 25 30
0 6 1 2 1 8 2 4 3 0 3 6 4 2 4 8 5 4 6 0 6 6 7 2 7 8 8 4 9 0 9 6
Po
ve
rty
ra
te (%
)
Age (years)
Table 15: Poverty rates and economies of scale in Indonesia (2012)
θ
Poverty rates (%)
Total Elderly 60+ Elderly 65+ Elderly 70+ Elderly 75+
1 11.96 12.35 13.48 14.57 15.01
0.9 11.06 12.75 13.99 15.42 16.32
0.8 10.09 13.36 14.94 16.45 17.30
0.7 9.30 14.24 15.97 17.72 18.63
0.6 8.95 15.78 17.69 19.68 20.55
0.5 8.64 17.34 19.66 21.88 23.12
0.4 8.52 18.96 21.34 23.65 24.96
0.3 8.62 20.89 23.44 26.08 27.05
0.2 8.79 22.70 25.50 28.31 29.62
Source: Calculations by TNP2K based on Susenas 2012 round (March).
Note: Official BPS poverty lines (rural/urban province level) applied. Poverty rates refer to individuals. Survey weights applied.
Assuming values of θ=0.9 or 0.8 increases old-age poverty rates quite significantly and underlines the
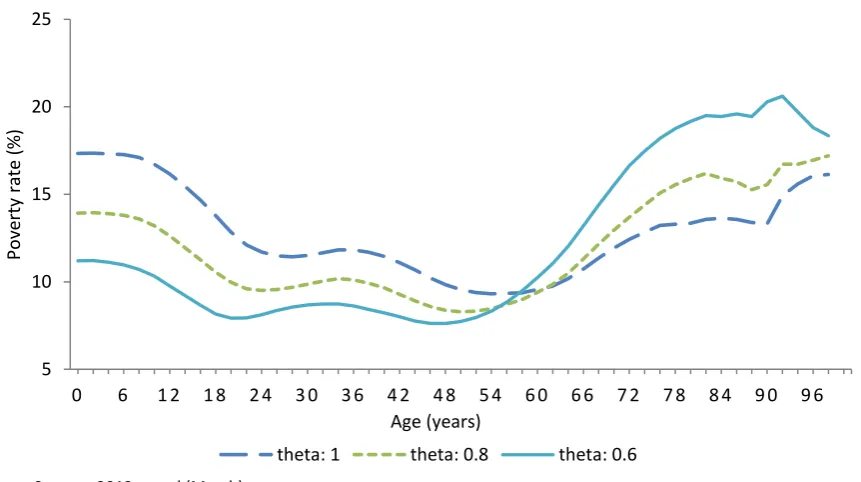
sensitivity of old-age poverty estimates on the way poverty is measured. Figure 10 shows the age-poverty relationship with the dashed blue line showing the BPS scenario. Similar to the case of adult equivalence scales, one finds a strong shift in the relative share of the poor towards elderly people and away from children. The elderly are found to be the poorest population sub-group when economies of scale are used.
Figure 10: Poverty rate and age in Indonesia, economies of scale (2012)
Source: Susenas 2012 round (March)
Allowing for adult equivalence scales or economies of scale in the measure of poverty has strong effects on the absolute number of poor elderly and on the relative share of the elderly among the poor. These results are in line with earlier findings from measurements of old-age poverty in countries such as Ghana, Korea, South Africa and Ukraine, and are very sensitive to assumptions about the
5 10 15 20 25
0 6 1 2 1 8 2 4 3 0 3 6 4 2 4 8 5 4 6 0 6 6 7 2 7 8 8 4 9 0 9 6
Po
ve
rty
ra
te (%
)
Age (years)
22 relative cost of children and public goods in household consumption (Deaton and Paxton, 1995, 1998a; Lanjouw et al., 2004).
Poverty rates among the elderly in Indonesia are already very high compared to the non-elderly population. Adopting a perspective such as those in statistical offices in Argentina, Brazil, the U.S. or most African countries; namely that children are not as costly as adults or assuming that certain household expenditures have a larger public good character (taking the perspective that per-capita measures are biased towards child poverty), leads to the elderly becoming the population group with the highest poverty rates in Indonesia.