CHAPTER III
RESEARCH METHODOLOGY
The purpose of this study is to examine the influence of
studentengagement and teachers’ performance to student satisfaction.
A. Population and Sampling Techniques
1. Population
The study will be conducted in Bandung and it will focus on public high
schools. According to Gravetter and Wallnau (2007), population is a set of all
theindividuals of interest in a particular study and a sample isa set of
individualsselected from a population, usually intended to represent the
population in a researchstudy.
No School name
Grade X
Boys Girls Total
1. SMA Negeri 1 Bandung 161 199 360
2. SMA Negeri 2 Bandung 169 178 347
3. SMA Negeri 3 Bandung 132 192 324
4. SMA Negeri 4 Bandung 140 227 367
5. Sma Negeri 5 Bandung 157 184 341
6. SMA Negeri 6 Bandung 159 197 356
7. SMA Negeri 7 Bandung 126 194 320
8. SMA Negeri 8 Bandung 166 238 404
9. SMA Negeri 9 Bandung 165 205 370
10. SMA Negeri 10 Bandung 169 227 396
11. SMA Negeri 11 Bandung 202 230 432
12. SMA Negeri 12 Bandung 148 176 324
13. SMA Negeri 13 Bandung 122 171 293
14. SMA Negeri 14 Bandung 163 195 358
15. SMA Negeri 15 Bandung 132 172 304
16. SMA Negeri 16 Bandung 188 249 437
17. SMA Negeri 17 Bandung 140 211 351
19. SMA Negeri 19 Bandung 145 171 316
20. SMA Negeri 20 Bandung 172 179 351
21. SMA Negeri 21 Bandung 168 156 324
22. SMA Negeri 22 Bandung 177 197 374
23. SMA Negeri 23 Bandung 179 186 365
24. SMA Negeri 24 Bandung 155 205 360
25. SMA Negeri 25 Bandung 196 200 396
26. SMA Negeri 26 Bandung 121 159 280
27. SMA Negeri 27 Bandung 170 163 333
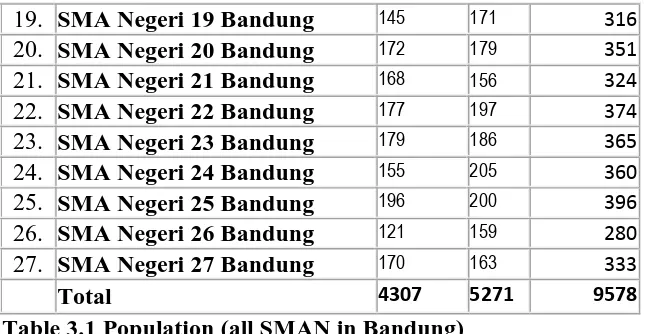
Total 4307 5271 9578
Table 3.1 Population (all SMAN in Bandung)
2. Sampling
There are two categories of sampling: random sampling and non-random
sampling. Random sampling is the process of selecting sample that would be
representative of the population of interest (Norazman et al, 2007). In contrast,
non-random sampling does not provide an equal chance for every member of the
population to be selected as sample in a research. Random sampling has been
selected to conduct the survey of this research because in random sampling, every
member of the population has an equal probability to be chosen to participate in
the research. Another reason is that the results of the research would yield a
representative sample.
In addition, the formula by Sugiyono (2006) will be used to calculate the
sample in the study as below:
n= N
N (d2) +1
n= Total sampling
N=Total Population
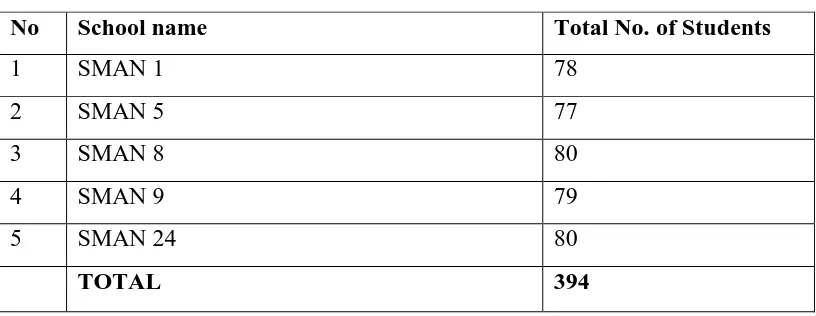
Schools for samplimg
No School name Total No. of Students
1 SMAN 1 78
2 SMAN 5 77
3 SMAN 8 80
4 SMAN 9 79
5 SMAN 24 80
TOTAL 394
Table 3.2 Sampling (5 SMAN in Bandung)
The unit of analysis in this study will include feedback from high school
students.
The following methods and techniques will be applied in data collection:
Questionnaires will be organized which will focus on getting the whole
information about teachers competency in integrating ICTs in education at high
school level in Bandung.
B. Research design
The research design is a case study to be conducted in public schools in
Bandung (City). The researcher will visit public schools in this region and
observe, give questionnaires and interview teachers, students and Principals about the influence of student engagement and teachers’ performance to student satisfaction in their schools. The aim is to find out whether there is an influence of student engagement and teachers’ performance to student satisfaction in their schools. The study will be conducted in a quantitative methodology which will mainly focus on interviews and questionnaires. Teachers’ performance will also include the use of ICT in the process of learning.
Moreover, the overall structure for a quantitative design is based in the
scientific method. It uses deductive reasoning, where the researcher forms a
from the investigation, after analysis is made and conclusions are shared, to prove
the hypotheses not false or false. With this stance, the basic procedure of a
quantitative design is: making observations about something that is unknown,
unexplained, or new by investigating the current theory surrounding the research
problem or issue; hypothesizing an explanation for those observations; making a
prediction of outcomes based on hypotheses by formulating a plan to test the
prediction; collecting and processing data; and verifying the research findings by
making final conclusions and presenting the findings in an appropriate form.
C. Operational Definition
1. Student satisfaction (Y)
Student satisfaction is being presented asan important quality factor in
educationalsettings. A key element in defining quality isthe capacity to show that
the outcome fromthe process (teaching) is meeting user/clientneeds.Dill, D(2007)
has described the application of acustomer satisfaction model to student
evaluationof teacher performance. He has established a linkbetween student
evaluation and student satisfaction. According to Sean B. Eom, (2011), student
satisfaction can be defined as the following: student satisfaction refers to the student’s perception or attitude towards the learning activities. Where the student is happy with his/her studies or adopts an aggressive learning attitude, student is
deemed to be satisfied; where the student is unhappy or adopts negative or passive
attitude, student is deemed to be dissatisfied. On the same hand Student’
satisfactionis defined by Wiers-Jenssen, Stensaker, B. (2007)as students’
assessments of the services provided by Schools, universities and colleges.In this
research student satisfaction means a fulfillment felt by students after following a
certain program (Including integration of ICT in learning) and this fulfillment is
connected to their expectations, beliefs and perceptions they had before joining
Student Satisfaction indicators
1. Academic advising
2. Social activities
3. Learning experience
4. Student support service
5. Library
6. Course content
7. Quality of instructions
8. Adaptability
2. Student Engagement (X1)
Researchers have recently used the term engagement to refer to the extent
to which students identifywith and value schooling outcomes, and participate in
academic and non-academic school activities. Itsdefinition usually comprises a
psychological component pertaining to students’ sense of belonging at schooland
acceptance of school values, and a behavioural component pertaining to
participation in school activities(Harris, 2008). The psychological component emphasises students’ sense of belongingor attachment to school, which has to do with feelings of being accepted and valued by their peers, and byothers at their
school. Another aspect of the psychological component concerns whether or not
studentsvalue school success – do they believe that education will benefit them
personally and economically(Chen, Gonyea and Kuh, 2008). Students who do not
feel they belong at school, or reject school values, areoften referred to in the
literature as alienated or disaffected. The participation component of
engagementis characterised by factors such as school and class attendance, being
prepared for class, completinghomework, attending lessons, and being involved in
extra-curricular sports or hobby clubs.
Stovall (2009) suggests that engagement is defined by a combination of
students’ time on task and their willingness to participate in activities. Krause and
Coates (2008) say that engagement is the quality of effort students themselves
devote to educationally purposeful activities that contribute directly to desired
degree to which learners are engaged with their educational activities and that
engagement is positively linked to a host of desired outcomes, including high
grades, student satisfaction, and perseverance. Other studies define engagement in
terms of interest, effort, motivation, time-on-task and suggest that there is a causal
relationship between engaged time, that is, the period of time in which students
are completely focused on and participating in the learning task, and academic
achievement (Bulger, et al., 2008).
In this research student engagement has come to refer to how involved or
interested students appear to be in their learning and how connected they are to
their classes, their institutions, and each other. The following are the indicators of
student engagement: thoughts, level of responsibility, participation, motivation,
interest, collaboration, and test readiness.
3. Teachers’ Performance (X2)
Despite the great relevance of individual performance and the widespread
use of job performance as an outcome measure in emprical research, relatively
little effort hasbeen spent on clarifying the performance concept.However,during
the past 10 to 15 years, one can witness an increasing interest in developing
adefinition of performance and specifying the performance concept.Authors agree
that when conceptualizing performance one has to differentiate betweenan action
(i.e., behavioral) aspect and an outcome aspect of performance (Hanushek and
Rivkin, 2006).Performance is what the organization hires one todo, and do well
(Murray, J., 2009). Thus, performance is not defined by theaction itself but by
judgemental and evaluative processes. Moreover, only actions which can be
scaled, i.e.,measured, are considered to constitute performance. Performance is a
multi-dimensional concept. On the most basic level, (Lavy, V. 2009) distinguish
between task and contextual performance. Task performancerefers to an individual’s proficiency with which he or she performs activitieswhich contribute to the organization’s ‘technical core’. This contribution can be bothdirect (e.g., in the case of production workers), or indirect (e.g., in the case of managersor staff
personnel). Contextual performance refers to activities which do not contribute
psychological environmentin which organizational goals are pursued. Contextual
performance includes notonly behaviors such as helping coworkers or being a
reliable member of the organization,but also making suggestions about how to
improve work procedures.
In this research, teachers’ performance means teaching activities which contribute to student satisfaction including integration of ICT in learning and
these activities should have performative aspects of teaching, leading, testing,
accountability, and policymaking.Teachers do not just become reliable members
of school but also participate in the improvement of student satisfaction in ICT.
Teaching is a complex activity. Competent teachers apply broad, deep, and
integrated sets of knowledge and skills as they plan, implement and revise
instructions. Technology proficiency (including technical skills and instructional
applications) is but one dimension of teacher competence.
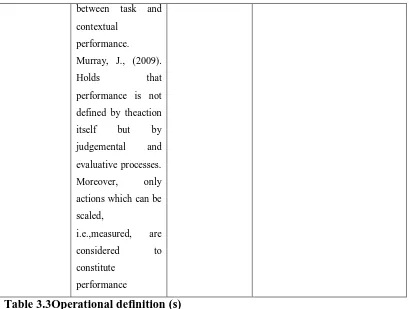
Definition Dimension Indicators & Items
Student
satisfaction model to
student evaluationof
services provided by
Schools, universities
Social activities Student support service Attitude: items 9-11 Library
Library equipment Quality of instructions Adaptability: items 12-14 ICT
ICT’s facilities items:15-18
Adaptability
Douglas, J.,
It cover the efforts
that students Relevance of school to
future aspirations Value of learning (goal
Additionally, Chen,
Gonyea and Kuh
(2008) say that
engagement is the
degree to which
learners are engaged
with their
educational activities
and that engagement
is positively linked
to a host of desired
outcomes, including
high grades, student
satisfaction, and
perseverance.
perseverance Time on task
Homework completion
rate
Class grades: items 29-32
Teachers’
theaction itself but
by judgemental and
evaluative processes.
Moreover, only
actions which can be
scaled,
concept. On the most
basic level, Lavy, V.
(2009),distinguish Time for practice
Preparedness of the
between task and
contextual
performance.
Murray, J., (2009).
Holds that
performance is not
defined by theaction
itself but by
judgemental and
evaluative processes.
Moreover, only
actions which can be
scaled,
i.e.,measured, are
considered to
constitute
performance
Table 3.3Operational definition (s)
D. Research Instrument
In view of the objective and purpose of the study, questionnaires with
students will be organised.Close-ended questions will be formulated for each
variable (Student engagement, Teachers’ performance and Student satisfaction) in
order to get into the depth of each variable.
The research instruments used in data collection are questionnaires. In this
sense, questionnaires are a number of written questions used to obtain information
from respondents in terms of statements about personal or things that are known
(Arikunto, 2010). Therefore, the questionnaires of the research instrument are
given to respondents (students and teachers).Based on the reason above, the
research instrument (questionnaires) will be used in the preparation of models of
Likert Scale. According to Riduwan and Kuncoro (2007), Likert Scale is used to
measure the attitudes, opinions and perceptions about a person or group social
translated into dimensions, the dimensions are translated into sub-variables and
sub-variables are translated into indicators. With measurable indicators can be
used as a starting point to make the item instrument in the form of questions or
statements that need to be answered by the respondents. Therefore, instrument is
usedtoobtain informationfromsubjects in this studyisa questionnairewithanswer
choices by usinga form of LikertScalewithfive weighted options.
- To know the level of the Influences of Students’ engagement (X1) in
the day-to-day school operations, the Likert Scale questionnaire will be
applied as below:
Student engagement
- To know teachers’ performance for student satisfaction (X2)
1. Instrument Development Process
Upon completion of data collection tool, then the next step is to test the
form of a questionnaire-instrument or questionnaires disseminated throughout
respondents to students in the targeted public senior High schools in Bandung
city. In a test an instrument is used statistical analysis. Statistical test aims to test
the validity and reliability so that it can be justified scientifically. The test validity
and reliability are illustrated in the following following:
2. Test Validity of Data
Test Validity describes how the questionnaire will gauge intended
variables, so the validity of test is the more appropriate tool of the planned target.
Validity value is essential to the value of the correlation function to calculate the
used items. The technique used in the total item correlation is consistency
between the scores of items that can be seen overall magnitude of correlation
coefficient between each item with an overall score, which is the basis of the
Pearson Product Moment Correlation.
Related to the validity testing of the instrument according to Riduwan and
Kuncoro (2008), it is explained that validity is a measure of the degree of
reliability or correctness of a measuring instrument. A good questionnaire should
be able to measure with a clear framework of the research to be measured.
Validity means the extent to which the precision and accuracy of a measuring
procedures to see whether in the form of questionnaires as a measuring instrument
can measure carefully or not.
Validity is a measurement that indicates the validity of research instrument
(Arikunto, 2006). To get data of the research, the instrument should be valid one.
A test is be valid if the content of the test is consistent with the stated goal for
which the test being administrated.
In order to test the validity of the instrument, the formula of Pearson
Product Moment (Akdon & Hadi, 2005)will be used:
r : Correlation Coefficient
N : Number of Respondents
ΣXY : Number of products X and Y pair scores ΣX : Total score in distribution X
ΣY : Total score in distribution Y
ΣX2 : Total score squares in the distribution of X ΣY2 : Total score of squares in Y distribution
Then the number of T-test calculations with the formula:
2
r : Coefficient Correlation
For critical values of the t distribution (Table t), α = 0.05, and degrees of
freedom (df = n - 2), the following formula will be followed:
If tcount> ttable means that the instrument is valid.
If tcount<ttable means that the instrument is invalid. Statistical Package for
the Social Sciences (SPSS) version 19, which serves to measure the validity of
any item questionnaire will be used as a measure of research.
3. Test Reliability of Data
According to Arikunto (2006), reliability is reliable if the result shows
constancy. It means if a test is tested in another time or place the result is still
constant.
Reliability test is done to obtain the level of accuracy (reliability) of data
collection tool (instrument) which is used. To measure the level of reliability of
the instrument, the researcher will conduct an analysis of test instruments using
the split second (odd-even) and calculate reliability throughout the test Spearman
Brown formula premises, namely:
11
2
1
b
b
r
r
r
Where:
r11 = Reliability Internal Whole Instrument
rb = Product Moment Correlation between the First and
Second Hemisphere
For distribution α = 0.05, and test two parties with degrees freedom (Df = n-2), so that in rtable can beRule-making: If rcount<rcritic means not reliable. Tools
Statistical Package for the Social Sciences (SPSS) version 19will also be used for
processing, testing data analysis to know the reliability of the instrument. I will
4. Measures of Variability
Variability indicates the spread of the scores in a distribution.Range,
variance, and standard deviation all indicate the amount of variability in a
distributionof scores. This information helps us see how dispersed the responses
are to itemson an instrument. Variability also plays an important role in many
advanced statisticalcalculations (Creswell, 2012).
5. Results of testing Instrument
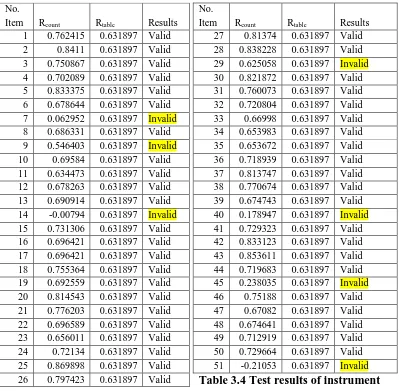
Validity is determined by the value ofthe significanceof each
itemwithan item,that is, rcount,comparingthe correlation valuewiththe criticalvalue
of rcritical which is0.631897. Whenrcount issmaller thanrcritical(rcount<rcritical) itis
concludedthatthe item is notvalid. On the same hand, if rcountis greater
thanrcritical(rcount>rcritical) then the itemis valid.
No.
Table 3.4 Test results of instrument
From 51 items (questions) which were given to ten (10) respondents with
the intention of testing the instrument (Validity and reliability) seven (7) items did
not perform well hence they are invalid and therefore I cannot use them.
Meanwhile, fromthe calculations, the greatest value ofrcounton Student
Satisfaction (Y) is .833. Thencheckedwithrtabelwheredf =(n-2) df =10-2=8at the5%
levelis0.63. This means that thevariableYquestionnaireaboutStudent satisfaction
isreliable, becausercount>rtable.
Student Satisfaction
According to Cronbach’s Alpha these results are reliable since the outcome is 0.939.
p31 .760
p32 .721
p33 .670
p34 .654
p35 .654
p36 .719
2. Reliabilitas
Reliability Statistics
Cronbach's
Alpha N of Items
.918 12
According to Cronbach’s Alpha these results are reliable since the outcome is 0.918
Teachers Performance
1. Validity
Inter-Item Correlation Matrix
Total
Total 1.000
p37 .814
p38 .771
p39 .675
p41 .729
p42 .833
p43 .854
p44 .720
p45 .238
p46 .752
p47 .671
p48 .675
p49 .713
p50 .730
p51 -.211
2. Reliability
Reliability Statistics
Cronbach's
Alpha N of Items
.889 15
According to Cronbach’s Alpha these results are reliable since the outcome is 0.889
6. Testing analysis
a. Weighted MeansTestScored
This activity isscoringineveryalternative answersgiven bythe
respondentsin accordancewith thepredeterminedweights. Any statement inthe thirdvariable hasthe answerwith5criteriawhichstartsfrom1,2,3,4,
and5withprovisionfordeclaration ofcalculation offigures.
Percentageofeachvariableaimstoidentify trends
ofgeneralrespondentsforvariablesnamely Student engagement (X1), teachers’
calculated byusing thefollowingformula. General descriptionof eachvariableis
describedbyan average scorethat obtained from thefollowing formula:
Description:
X: The average valuesought
X: totalcomposite score(frequency multiplied by theweighingforeachanswer
alternativecategory)
N: Number of respondents
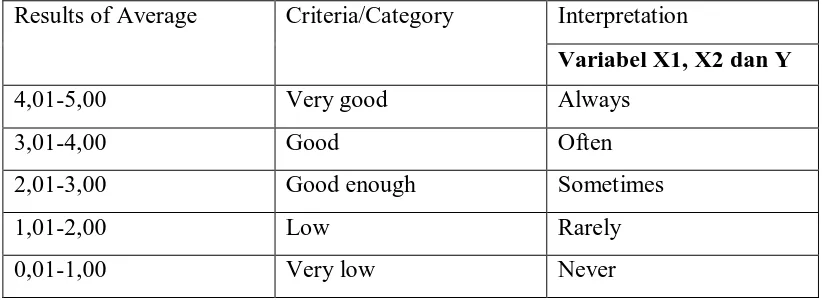
WeightedMeansclusteringcriteriondeterminesScored(WMS)tothe average
scoreof eachpossible answer. In average score all respondents are represented with
weighted means score. The followingcriteria or table will be used to determine the
averages of all items in order to know the category in which they fall:
Results of Average Criteria/Category Interpretation
Variabel X1, X2 dan Y
4,01-5,00 Very good Always
3,01-4,00 Good Often
2,01-3,00 Good enough Sometimes
1,01-2,00 Low Rarely
0,01-1,00 Very low Never
Table 3.5WeightedMeans
7. Normality test
The purposeof thenormality testisto determine whethertreatment
Datain this studyis usingParametricornonparametric analysis. Inthis
Description:
2 = Chi-square
f0=frequencyobservations
fe=frequencyexpected
To knowwhether data isnormalornot, it can be determinedthetesting
criteriaasfollows:
IfX2≥X²table, meaningAbnormalDataDistribution
IfX2<X2table, meaning thatdistribution of data is normal.
E. Techniques of Data Collection
These are the tools and approaches used to collect data to answer the
research question and hypothesis. More than one technique can be employed; the
commonest are questionnaires and interviews. Technique of data collection is the
way that can be used by the researcher to collect data (Arikunto, 2006). To collect
the data, the researcher will use a questionnaires as an instrument. Questionnaire
is a series of questions or exercises of other means of measuring skill, knowledge,
intelligence, and capacities of aptitudes or an individual or groups (Arikunto,
2006).
Based on this, data from the field will be collected through questionnaires.
The researcher will administer the questionnaires personally. And the researcher
will also visit the schools for obtaining the opinions of students
F. Techniques of DataAnalysis
The data will be obtained in the field of research study (collected data:,
internet sources, questionnaire responses, and observations) will be critically
and standard deviation in order to test if those data are valid. Data analyzing
technique involves three parts, namely, correlative analysis, comparative analysis,
and descriptive analysis (Arikunto, 2010). Correlation methods of analysis aim to
describe the correlation between the two variables. Correlation analysis attests the
relation between two or more variables, but does not measure the causal relation
between them. Correlation analysis may also indicate the intensity of the
relationship between variables (KOPPA, 2013). Comparative analysis is the
item-by-item comparison of two or more processes, qualifications and sets of data,
system, products, comparable alternatives or the likes. Comparative analysis is
meant to solve the mistakes made by casual inferences mainly on the basis of only
small number of cases. The descriptive analysis is utilized in this research. In fact,
the descriptive analysis is used if the researcher wants to know how, how far, and
so on about the condition. In this research, the descriptive quantitative technique
is used to measure the mean and the level of effectiveness of the influence of
student engagement and teachers performance for student satisfaction.
In the implementationof thisresearchdata analysis, data processingis
donethroughthe help ofthecomputerprogramStatistical Package
fortheSocialSciences(SPSS) version19. The analysis techniqueusedin this
studyisthe correlationanalysis(Pearson Product Moment) andmultiplecorrelations.
This analysiswillbe usedtotestthe influenceof variablesX1andX2to variable Y.This
analysisdetermines the effect of Influences of Students’ engagement(X1) and
Teachers’ performance (X2) for Student satisfaction(Y) in the public senior high
schools in Bandung. The formula ofPearsonProduct Moment(PPM) is shown as
below:
Where:
r : correlationcoefficient
Yi : Total scoretotal(all items)
n: Number of respondents
x̄
:XAverage� :Y Average : Summation
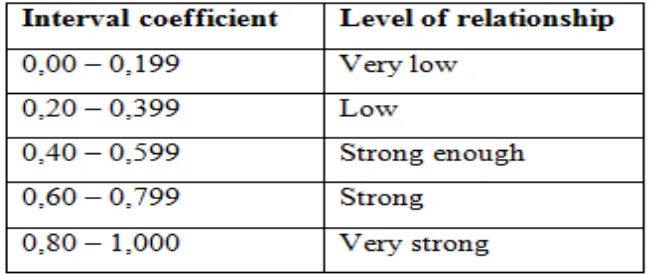
Correlationrwiththe provisions ofPPMisnotmorethanthe value of r(-1 ≤r≤+1). If thevalue of r=-1 meansa perfect negativecorrelation, r=0means nocorrelation. Meanwhile, r=1 means thatthe correlation isverystrong. Meaningthe
valuerwill be consultedwith
acorrelationcoefficientvalueinterpretationtabler(Riduwan, 2010).
Table 3.6 Interval coefficient
To measurethe size of theinfluencegiven bythe variableXto variable Y,
then, the following formula will be used:
2
100%
KD r
Where:
KD : Determinants coefficient value
Meanwhile, to test the significance the following formula will be used:
r : Correlationcoefficientvalue
n : Number of samples
Distribution(Table t) forα=0.05, anddegrees of freedom(df = n-2),
thedecisionrule: iftcount>ttable, it means that significantandvice versa.
Determination of the effect ofvariablesX1andX2 tovariable Y is used with
the multiplecorrelation formulaasbelow:
Furtheranalysisusessimplecorrelation techniques. Ease
ofcomputationusedinthe form of softwareof computerprogramStatistical Package
X1 = Students’ Engagement
X2 = Teachers’ Performance
Y = Student Satisfaction
R = Coefficient Correlation
I will use SERVQUALas a way of trying to measure service quality;
researchers have developed a methodology known as SERVQUAL – a perceived
service quality questionnaire survey methodology. SERVQUAL examines five
dimensions of service quality:
Reliability
Responsiveness
Assurance;
Empathy, and
Tangible (e.g. appearance of physical facilities, equipment, etc.)