TESTING THE LOW-COST RPAS POTENTIAL IN 3D CULTURAL HERITAGE
RECONSTRUCTION
M. Bolognesi a, *, A. Furini a, V. Russo b, A. Pellegrinelli a, P. Russo a
a
Engineering Department, University of Ferrara, Saragat 1, 44122, Ferrara, Italy (marcello.bolognesi, alessio.furini, alberto.pellegrinelli, paolo.russo) @unife.it,b [email protected]
Commission V, WG V/4
KEY WORDS: photogrammetry, RPAS (UAV), 3D Digital Model, Accuracy, Low-cost systems, Cultural Heritage, GoPro
ABSTRACT:
In order to analyze the potential as well as the limitations of low-cost RPAS photogrammetric systems for architectural cultural heritage reconstruction, some tests were performed by a small RPAS equipped with an ultralight camera. The tests were carried out in a site of remarkable historical interest. A great amount of images were taken with camera’s optical axis in vertical and oblique position. Images were processed by the commercial software PhotoScan of Agisoft and numerous models were realized, each of them was compared with an accurate TLS model used as a reference. The test, despite some problems found, has provided good results in terms of accuracy (average error <2cm) and reliability.
* Corresponding author.
1. INTRODUCTION
In recent years there have been significant advances in Close Range Photogrammetry due to several well known factors, such as, for example, the application of Computer Vision techniques (Structure for Motion), the increase of the quality of low cost digital cameras and the significant development of photogrammetric software (Fonstad et al, 2013; Green et al, 2014). At the same time light RPAS (Remotely Piloted Aircraft Systems) have been equipped with navigation systems more and more advanced and reliable (Nex and Remondino, 2014; Turner et al, 2012; Mancini et al, 2013). The combination of these two technological developments led to a fast and widespread use of light RPAS in photogrammetric survey, with particular regard to Cultural Heritage (Hashim et al, 2012). By consequence a growing number of technicians and professionals from various fields not strictly belonging to the world of surveying, began to apply digital photogrammetry from RPAS. This trend points out the need for simple guidelines for the correct use of low cost photogrammetry performed from very light RPAS (weight less than 2 kg) in order to obtain sufficiently accurate 3D models of the surveyed objects (Koutsoudis et al, 2014). To achieve this goal it is important to test the low-cost technologies currently on the market. For such purpose in this paper we present the results of some experimental tests carried out by means of a Dji Phantom 2 equipped with a GoPro hero3 + Black Edition (Fig.1) and software as the PhotoScan of Agisoft.
Figure 1: RPAS used for the photogrammetric survey
The main advantage by operating with this kind of technology relates to the cost of the equipment, especially if compared with the standard of aerial photogrammetry. The choice of the equipment was made not only to save money, but also with a focus on convenience and ergonomics of the sensor and the RPAS.
The experiment consisted in performing some flights in a test site by acquiring several images with both vertical and oblique camera’s optical axes. By means of the commercial software PhotoScan of Agisoft were created numerous models, each of which was compared with an accurate TLS reference model.
2. TEST SITE
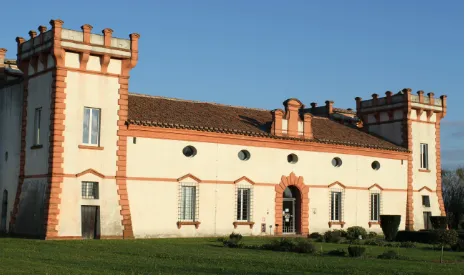
The monument selected for the tests is the “Delizia Estense del Verginese” (Fig.2), a renaissance castle located in the province of Ferrara (Italy), already used in recently for assessing the accuracy of 3D models by RPAS and terrestrial photogrammetry in Cultural Heritage surveys (Bolognesi et al, 2014).
Figure 2: The test site, the “Delizia Estense del Verginese” castle (XVth century)
It is an ideal test-site for its historical and cultural importance, and for the possibility to survey it easily with different techniques.
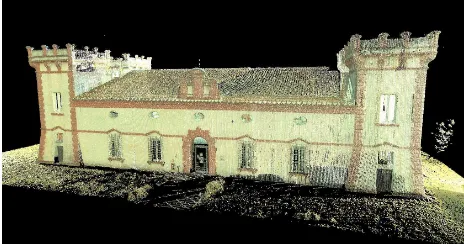
In order to estimate the accuracy of the photogrammetric survey it is necessary to have a high accurate reference model of the castle. For this purpose, a TLS survey was performed by a Leica C10 laser scanner (figure 3).
Figure 3: The TLS point clouds of the Castle
The model of the castle was realized by several point clouds registered in the absolute reference system.Moreover about 400 control points belonging to the external walls of the building (GCP) were surveyed by a Leica total station from the vertices of a local high accurate geodetic network established around the castle. The reference model was validated by comparing it directly with the positions of GCPs.
As the average deviation between TLS clouds and Total station GCP resulted approximately 10-13 mm, the laser scanner model was considered as a reference in subsequent tests.
3. DATA ACQUISITION façades (one per side) with flight direction parallel to the façade and oblique camera’s axes at a distance of about 5 - 7 meters from the walls. During the execution of the flights were acquired images also in correspondence of the 4 corners of the building in order to provide views which join together the façades (two by two) and part of the roof.
For an integrated processing of all the data such images have proved to be very useful, especially as regards the relative orientation of the frames automatically. The flights were performed in order to obtain an average overlap between frames of about 80%. Table 1 shows for each flight the number of
Table 1: flights/dataset performed, taken images, GSD and object distances
Furthermore, as already said, by means of the total station were detected about 400 natural points uniformly distributed on the four sides. Some of these points were also used in the early stages of orientation as GCPs.
4. DATA PROCESSING
Data processing was made with the commercial software PhotoScan of Agisoft ver.1.1.0. Given the large number of available images, it was decided to select a reduced data set to be used for processing, so as to optimize the computational time for the same accuracy of the geometrical model (Tab. 2).
ID
Table 2: Images used for data processing
The datasets were used in different projects, from the basic up to more complex ones, varying the number of images, the camera calibration, the introduction of GCPs and their number, etc. This “modus operandi”, step by step, allowed the control of the various phases of the processing. The default computation parameters of the software were assumed (Tab. 3). In a second step the parameters were changed to achieve better results.
WORKFLOW Scale bar accuracy (m) 0.001 Projection accuracy (m) 0.1 Tie point accuracy (pix) 4
BUILD DENSE CLOUD
Quality Medium
Depth filtering Aggressive
Table 3: Parameters and workflow used in Agisoft PhotoScan
STEP ONE: the first project was realized without specifying the type of camera, the calibration parameters and the location of the camera centres. In this phase it was maintained the division of flights, thus creating five separate models. One of these is shown in figure 4. In the figure it is observed a clear curvature of the model, the so-called "bowl-effect".
Figure 4: bowl-effect visible on first alignment made.
The result was actually to be expected since the photogrammetric software has no data to be able to eliminate the remarkable distortion of the GoPro camera. In this
particular example were used only the photos taken with vertical axis. Differently in the single-side models (figure 5) the "bowl-effect" appears practically absent or greatly reduced.
Figure 5: results of alignment process in façade reconstruction
This result is due to the shorter distance from the object (about 7 m), the homogeneity of images scale and the greater degree of overlap. In addition, images taken with inclined axes at the two corners of the front have allowed a more accurate three-dimensional modelling
STEP TWO: in the second test it was decided to include some GCPs to try to eliminate or greatly reduce the "bowl-effect" also in the project with the vertical axes for the survey of the roof. In total were included 9 GCPs well spread on the ground around the castle. As seen in figures 6, the effect of the distortion continues to be significantly present, distortion also confirmed by residuals on the GCP on average resulting of 65 cm.
Figure 6: bowl-effect still visible in alignment with GCPs.
STEP 3: a further test was made under the assumption to know the calibration parameters of the camera. In this case, the camera was previously calibrated with the software Photomodeler, and the parameters obtained were incorporated into the project PhotoScan, not as rigid constraints but as approximated values, whose correction is estimated by PhotoScan during the processing. This choice is important and is due to the fact that the focusing system of the GoPro is automatic and may change slightly during the flight. In figures 7 and 8 are reported the models obtained respectively with photos with vertical axes (roof) and with oblique ones (single façades). In both models the bowl-effect seems to be eliminated or remarkably reduced. This result was confirmed in a second step in which a few GCPs were included in the computation obtaining the residuals shown in table 4.
Also in this project were obtained "dense clouds" models (figures 9 and 10) that have been compared with the reference TLS one.
Figure 7: alignment made using precalibrated camera (dataset 01)
Figure 8: alignment made using precalibrated camera (dataset 02)
ID flight/dataset GCP Error (m) Error (pix)
01 11 0.057 0.778
02 7 0.022 0.465
Table 4: Residual error of GCPs estimated positions by PhotoScan
Figure 9: Point clouds obtained using precalibrated camera (dataset 01)
Figure 40: Point clouds obtained using precalibrated camera (dataset 02)
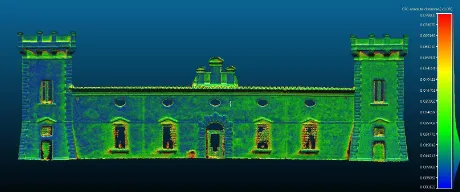
The "dense clouds" are very “noisy”, especially the one obtained from vertical images. In addition there are missing data in the roof and the façades, caused by suboptimal alignments. However, comparing the clouds with the reference model (figures 11 and 12) are obtained deviations of the same magnitude of the residuals already reported in Table 4.
Figure 11: Comparison between photogrammetric point clouds and TLS one. Comparison made by CloudCompare
(dataset 01)
Figure 12: Comparison between photogrammetric point clouds and TLS one. Comparison made by CloudCompare
(dataset 02)
The statistical analysis of such deviations shows that they agree with a Weibull type distribution. The correspondence between the distribution and frequency histograms obtained is in fact remarkably significant. Figure 13 shows the distributions of the two models.
Figure 13: Weibull distribution of absolute distances between the photogrammetric point clouds and the TLS one. Project
made from precalibrated camera.
The point clouds of the façades present deviations smaller than that the roof: in the latter model most of the errors is about 3-4 cm, while the models of the façades show average deviations slightly greater than 2 cm. Note how these values are consistent with the residuals obtained on GCP during the orientation phase. The differences between the two types of models are most likely related to the distance from the object: the images of the façades have been acquired at a lesser distance from the images of the roof (see table 1).
STEP 4: to improve results in this step the images have been previously corrected by the distortion using the software Photomodeler. For both models, the residuals of GCPs (table 5)
resulted immediately acceptable being lower than the previous ones reported in table 4 (step 3).
ID flight/dataset GCP Error (m) Error (pix)
01 8 0.021 0.253
02 6 0.007 0.191
Table 5: Residual error of GCPs estimated positions by PhotoScan
Even for these projects were created “dense clouds" models which were compared with the reference model. As shown in figure 14, the point clouds on the whole are very disturbed. This effect is probably due to the resampling operated on the images to reduce the lens distortion effects.
Figure 14: Point clouds obtained using undistorted photos (dataset 01)
Figure 15: Point clouds obtained using undistorted photos (dataset 02)
The model shown in figure 15 is better than that one in figure 14 even if also in this case the dense point clouds presents areas of high noise, but the façade of the building is correct, devoid of holes and missing data. Again this result is due to the shorter distance from the object and to the presence of photo taken with inclined optical axis. Also in this case the comparison with the reference model points out deviations that are in agreement with a Weibull distribution (fig. 16).
The values of the deviations are less than those in the previous steps, with significant differences in amplitude of the two graphs, confirming what already found on residuals of orientation of the GCPs (Values in the table 5 below those of table 4). This test with externally calibrated images from the project PhotoScan has therefore provided the best results, even if remains problems on dense clouds: noisy and with some sections incomplete.
STEP 5: During the course of the trial a new software release PhotoScan was made available dedicated to the use of cameras with a fisheye lens, such as the GoPro. Therefore it was made a new test with the original images and by setting the model fisheye. In Figures 17 and 18 are shown respectively the models obtained by the images with vertical and oblique axes.
Figure 16: Weibull distribution of absolute distances between the photogrammetric point clouds and the TLS one. Project
made from undistorted photos.
Figure 17: Point clouds and camera positions obtained using fisheye release (dataset 01)
Figure 18: Point clouds and camera positions obtained using fisheye release (dataset 02)
As can be seen qualitatively in the figures there is no trace of the bowl-effect. Table 6 shows the residuals of orientation calculated for some GCPs. More models made were made using the images with inclined axis: one for each side (from project 2 to project 5). The residuals obtained are the lowest among all the tests carried out so far. Also in this case were made the comparison with the reference model. The deviations found are shown in figures 20 and 21, while figure 22 illustrates the distribution of these deviations.
ID
flight/dataset
GCP Error (m) Error (pix)
01 8 0.014 0.207
02 8 0.008 0.357
03 8 0.007 0.222
04 8 0.006 0.362
05 8 0.005 0.475
Table 6: Residual error of GCPs estimated positions by PhotoScan
You do not notice an improvement of the curves of deviation from the previous step, however, the models created are significantly more "clean", as shown in figure 23.
Figure 20: Comparison between photogrammetric point clouds and TLS one. Comparison made by CloudCompare
(dataset 01)
Figure 21: Comparison between photogrammetric point clouds and TLS one. Comparison made by CloudCompare
(dataset 02)
Figure 22: Weibull distribution of absolute distances between the photogrammetric point clouds and the TLS one. Project
made using fisheye release in Photoscan.
Figure 23: Point clouds obtained using fisheye release (dataset 01)
STEP 6: using the latest version of the software PhotoScan able to work directly with "fisheye images" has made a final project in which they were introduced all the images, vertical and lateral, for a total of 670 images and 40 GCPs.
In figure 24 we observe the dense cloud obtained.
Figure 24: Point clouds obtained using fisheye release (project made using all dataset simultaneously)
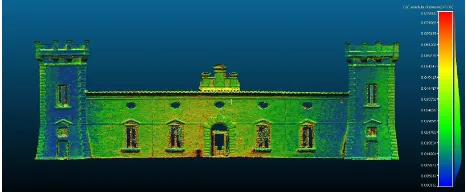
Figures 25 and 26 show the deviations and their distribution, between global model obtained and the reference model. As can be seen, the results are absolutely acceptable.
Figure 25: Comparison between photogrammetric point clouds and TLS one. Comparison made by CloudCompare (project
made using all dataset simultaneously)
Figure 26: Weibull distribution of absolute distances between the photogrammetric point clouds and the TLS one. Project
made using all dataset simultaneously.
5. CONCLUSIONS
At the end of the trial we can definitely say that micro RPAS equipped with low-cost sensors can be considered in all respects an effective tool for the survey of cultural heritage. To obtain accuracies comparable to those of photogrammetry systems "classical", is fundamental the knowledge of the parameters of optical distortion, as well as the use of a minimum number of GCPs (at least 8-10). Furthermore, it seems very important to maintain a close distance of the sensor from the object and to
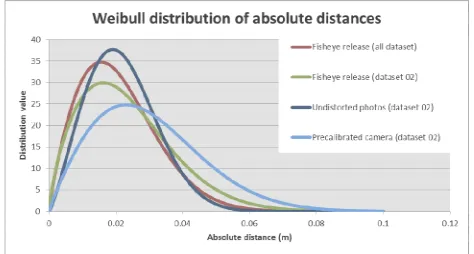
use simultaneously acquired images with vertical and inclined axes. More specifically, the latest tests have shown the good results obtained with the new version of PhotoScan that allows you to directly use images taken with fisheye sensor. In figures 27 and 28 are reported distributions relating to tests carried out so as to better understand the differences.
In figure 27 we observe that the deviations of the model created with the fisheye images (integrated model) compared to the reference model are on average better than the other three. Observing the residuals is known also another important feature, namely the simultaneous use of images with a vertical and inclined axis has reduced the uncertainty of the final model. A similar conclusion can be deduced from figure 28 which shows the distributions for the models of the individual façades.
Figure 27: Weibull distribution of absolute distances. Comparison between integrated model and other ones made
from dataset 01.
Figure 28: Weibull distribution of absolute distances. Comparison between integrated model and other ones made
from dataset 02.
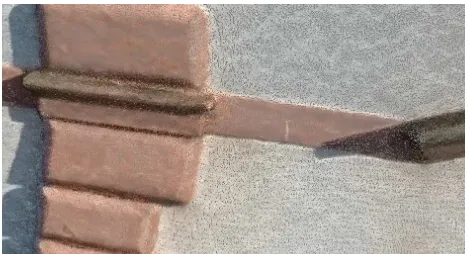
It is appropriate to conclude with a few comments on the modelling of architectural details. Note in figure 29 a detail of the cloud obtained from the integrated model.
Although architectural elements of the prospectus are clearly visible, a precise identification is unfortunately still difficult. Anyhow this type of problem is partly solved by varying the parameters of quality of the "dense cloud" that creates PhotoScan in the last stage of the processing. Figure 30 shows the same detail obtained with a higher density of points: it is easy to observe that the interpretation of the object, and thus the vectorization of the model, is definitely better.
Another important product is the orthographic projection of the model created. In figures 31 and 32 is reported the textured model necessary for creating orthophoto, while figure 33 shows a façade projected as orthophoto.
Figure 29: detail of the cloud obtained from the integrated model (medium quality)
Figure 30: same detail of the cloud obtained from the integrated model (ultra high quality)
Figure 31: Front view of the textured model of the castle.
Figure 32: Back view of the textured model of the castle.
Figure 33: Ortophoto of the front façade of the castle.
Figure 34 shows a zoom of the orthophoto: note the quality of the product and its easy vectorization.
Figure 34: a detail of the orthophoto in fig. 33
In conclusion, the potential offered by RPAS photogrammetric low-cost and user friendly systems, are very interesting and they will see a growing trend in the world of the cultural heritage survey. However in order to achieve an adequate level of precision is required compliance with some simple rules that were in part highlighted in this work.
REFERENCES
Bolognesi M., Furini A., Russo V., Pellegrinelli A., Russo P., 2014 Accuracy of cultural heritage 3D models by RPAS and terrestrial photogrammetry. In: The International Archives of the Photogrammetry, Remote Sensing and Spatial Information Sciences, XL-5, 2014, pp.113-119.
Green, S., Bevan A., Shapland, M., 2014. A comparative assessment of structure from motion methods for archaeological research. Journal of Archaeological Science, 46, pp. 173-181.
Fonstad, M. A., Dietrich, J., T., Courville, B. C., Jensen, J. L., Carbonneau P. E., 2013. Topographic structure from motion: a new development in photogrammetric measurement. Eart. Surf. Process. Landforms, 38, pp. 421-430.
Hashim, K. A., Ahmad, A., Samad, Abd. M., Nizam Tahar, K., Udin, W. S., 2012. Integration of low altitude aerial & terrestrial photogrammetry data in 3D heritage building modelling. In: Proceedings – 2012 IEEE Control and System
Graduate Research Colloquium, ICSGRC, Shah Alam,
Malaysia, Article number 6287166, pp. 225-230.
Koutsoudis, A., Vidma, B., Ioannakis, G., Arnaoutoglou, F., Pavlidis, G., Chamzas, C., 2014. Multi-Image 3D reconstruction data evaluation. Journal of Cultural Heritage, 15, pp. 73-79.
Mancini, F., Dubbini, M., Gattelli, M., Stecchi, F., Fabbri, S., Gabbianelli, G., 2013. Using unmanned aerial vehicles (UAV) for high-resolution reconstruction of topography: the structure from motion approach on coastal environments. Remote Sensing, 5 (12), pp. 6880-6898.
Nex, F., Remondino, F., 2014. UAV for 3D mapping applications: A review. Applied Geomatics, 6 (1), pp. 1-15.
Turner, D., Lucieer, A., Watson, C., 2012. An automated technique for generating georectified mosaics from ultra-high resolution Unmanned Aerial Vehicle (UAV) imagery, based on Structure from Motion (SFM) point clouds. Remote Sensing, 4 (5), pp. 1392-1410.